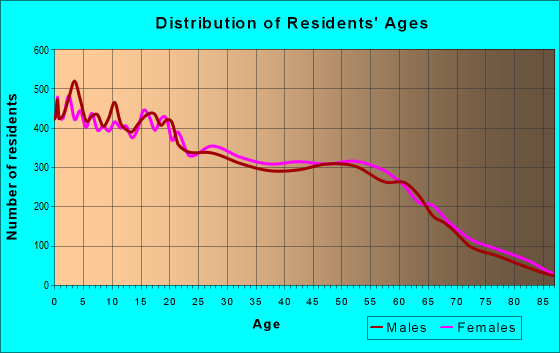
Estimated zip code population in 2022: 50,998 Zip code population in 2010: 48,519 Zip code population in 2000: 42,342
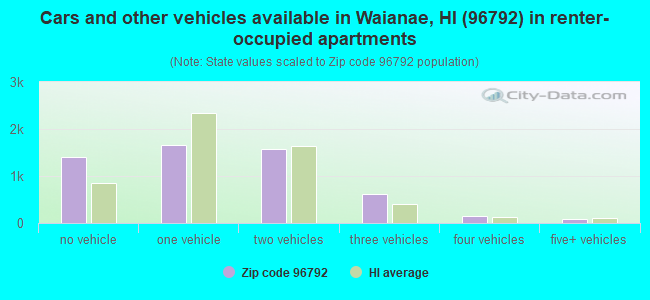
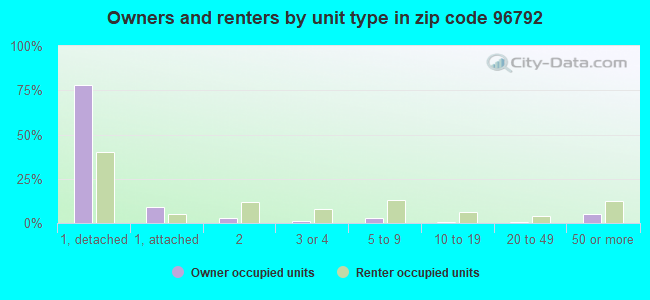
Houses and condos: 15,655 Renter-occupied apartments: 5,473
% of renters here:
40%
State:
37%
March 2022 cost of living index in zip code 96792: 131.7 (high, U.S. average is 100)
Land area: 61.0 sq. mi. Water area: 13.6 sq. mi.
Population density: 837 people per square mile
(low).
OSM Map
General Map
Google Map
MSN Map
OSM Map
General Map
Google Map
MSN Map
OSM Map
General Map
Google Map
MSN Map
OSM Map
General Map
Google Map
MSN Map
Please wait while loading the map...
Real estate property taxes paid for housing units in 2022:
This zip code:
0.2% ($1,161)
Hawaii:
0.3% ($2,092)
Median real estate property taxes paid for housing units with mortgages in 2022: $1,386 (0.2%) Median real estate property taxes paid for housing units with no mortgage in 2022: $677 (0.1%)
Averages for the 2020 tax year for zip code 96792, filed in 2021:
Average Adjusted Gross Income (AGI) in 2020: $49,678 (Individual Income Tax Returns)
Here:
$49,678
State:
$72,945
Salary/wage: $44,741 (reported on 85.6% of returns)
Here:
$44,741
State:
$57,697
(% of AGI for various income ranges: 1085.2% for AGIs below $25k, 3535.8% for AGIs $25k-50k, 6558.5% for AGIs $50k-75k, 9943.0% for AGIs $75k-100k, 19411.3% for AGIs $100k-200k, 65731.7% for AGIs over 200k)
Taxable interest for individuals: $480 (reported on 17.2% of returns)
This zip code:
$480
Hawaii:
$1,356
(% of AGI for various income ranges: 5.9% for AGIs below $25k, 5.8% for AGIs $25k-50k, 10.5% for AGIs $50k-75k, 10.5% for AGIs $75k-100k, 44.2% for AGIs $100k-200k, 280.0% for AGIs over 200k)
Ordinary dividends: $1,704 (reported on 6.5% of returns)
Here:
$1,704
State:
$6,387
(% of AGI for various income ranges: 4.0% for AGIs below $25k, 5.7% for AGIs $25k-50k, 11.1% for AGIs $50k-75k, 18.9% for AGIs $75k-100k, 57.0% for AGIs $100k-200k, 913.3% for AGIs over 200k)
Net capital gain/loss in AGI: +$11,104 (reported on 5.7% of returns)
Here:
+$11,104
State:
+$23,240
(% of AGI for various income ranges: 2.3% for AGIs below $25k, 7.7% for AGIs $25k-50k, 15.4% for AGIs $50k-75k, 46.5% for AGIs $75k-100k, 201.7% for AGIs $100k-200k, 14736.7% for AGIs over 200k)
Profit/loss from business: +$6,021 (reported on 8.6% of returns)
Here:
+$6,021
State:
+$15,381
(% of AGI for various income ranges: 41.0% for AGIs below $25k, 31.0% for AGIs $25k-50k, 42.6% for AGIs $50k-75k, 73.0% for AGIs $75k-100k, 235.5% for AGIs $100k-200k, 3275.0% for AGIs over 200k)
Taxable individual retirement arrangement distribution: $14,980 (reported on 4.1% of returns)
96792:
$14,980
Hawaii:
$19,883
(% of AGI for various income ranges: 14.9% for AGIs below $25k, 26.0% for AGIs $25k-50k, 82.5% for AGIs $50k-75k, 153.9% for AGIs $75k-100k, 378.1% for AGIs $100k-200k, 3356.7% for AGIs over 200k)
Total itemized deductions: $28,151 (reported on 7.5% of returns)
Here:
$28,151
State:
$33,097
(% of AGI for various income ranges: 22.6% for AGIs below $25k, 86.0% for AGIs $25k-50k, 272.5% for AGIs $50k-75k, 604.8% for AGIs $75k-100k, 1572.3% for AGIs $100k-200k, 7753.3% for AGIs over 200k)
Charity contributions: $6,487 (reported on 5.3% of returns)
Here:
$6,487
State:
$7,368
(% of AGI for various income ranges: 1.8% for AGIs below $25k, 9.8% for AGIs $25k-50k, 37.0% for AGIs $50k-75k, 87.4% for AGIs $75k-100k, 263.6% for AGIs $100k-200k, 2001.7% for AGIs over 200k)
Taxes paid: $6,692 (reported on 7.5% of returns)
96792:
$6,692
State:
$7,601
(% of AGI for various income ranges: 3.1% for AGIs below $25k, 12.0% for AGIs $25k-50k, 53.7% for AGIs $50k-75k, 148.3% for AGIs $75k-100k, 435.7% for AGIs $100k-200k, 1795.0% for AGIs over 200k)
Earned income credit: $2,371 (reported on 23.7% of returns)
Here:
$2,371
State:
$2,008
(% of AGI for various income ranges: 122.2% for AGIs below $25k, 97.0% for AGIs $25k-50k, 2.1% for AGIs $50k-75k)
Percentage of individuals using paid preparers for their 2020 taxes: 91.9%
Here:
92%
State:
89%
(% for various income ranges: 92.4% for AGIs below $25k, 93.1% for AGIs $25k-50k, 90.8% for AGIs $50k-75k, 90.4% for AGIs $75k-100k, 89.7% for AGIs $100k-200k, 95.7% for AGIs over 200k)
Averages for the 2012 tax year for zip code 96792, filed in 2013:
Average Adjusted Gross Income (AGI) in 2012: $39,022 (Individual Income Tax Returns)
Here:
$39,022
State:
$57,303
Salary/wage: $35,279 (reported on 88.7% of returns)
Here:
$35,279
State:
$47,500
(% of AGI for various income ranges: 83.3% for AGIs below $25k, 83.8% for AGIs $25k-50k, 80.8% for AGIs $50k-75k, 80.8% for AGIs $75k-100k, 80.6% for AGIs $100k-200k, 44.9% for AGIs over 200k)
Taxable interest for individuals: $519 (reported on 16.4% of returns)
This zip code:
$519
Hawaii:
$1,212
(% of AGI for various income ranges: 0.3% for AGIs below $25k, 0.2% for AGIs $25k-50k, 0.2% for AGIs $50k-75k, 0.2% for AGIs $75k-100k, 0.2% for AGIs $100k-200k, 0.4% for AGIs over 200k)
Ordinary dividends: $1,580 (reported on 6.2% of returns)
Here:
$1,580
State:
$5,430
(% of AGI for various income ranges: 0.2% for AGIs below $25k, 0.2% for AGIs $25k-50k, 0.2% for AGIs $50k-75k, 0.2% for AGIs $75k-100k, 0.2% for AGIs $100k-200k, 1.1% for AGIs over 200k)
Net capital gain/loss in AGI: +$5,650 (reported on 3.8% of returns)
Here:
+$5,650
State:
+$13,910
(% of AGI for various income ranges: 0.2% for AGIs $75k-100k, 0.5% for AGIs $100k-200k, 8.6% for AGIs over 200k)
Profit/loss from business: +$7,082 (reported on 8.1% of returns)
Here:
+$7,082
State:
+$15,881
(% of AGI for various income ranges: 3.1% for AGIs below $25k, 1.1% for AGIs $25k-50k, 0.5% for AGIs $50k-75k, 0.8% for AGIs $75k-100k, 2.5% for AGIs $100k-200k)
Taxable individual retirement arrangement distribution: $13,087 (reported on 4.6% of returns)
96792:
$13,087
Hawaii:
$15,720
(% of AGI for various income ranges: 0.8% for AGIs below $25k, 0.8% for AGIs $25k-50k, 1.5% for AGIs $50k-75k, 1.8% for AGIs $75k-100k, 3.2% for AGIs $100k-200k)
Total itemized deductions: $20,916 (27% of AGI, reported on 23.7% of returns)
Here:
$20,916
State:
$25,496
Here:
27.1% of AGI
State:
23.1% of AGI
(% of AGI for various income ranges: 4.8% for AGIs below $25k, 9.2% for AGIs $25k-50k, 14.2% for AGIs $50k-75k, 16.4% for AGIs $75k-100k, 17.8% for AGIs $100k-200k, 14.5% for AGIs over 200k)
Charity contributions: $3,031 (reported on 18.9% of returns)
Here:
$3,031
State:
$3,353
(% of AGI for various income ranges: 0.5% for AGIs below $25k, 1.0% for AGIs $25k-50k, 1.7% for AGIs $50k-75k, 1.9% for AGIs $75k-100k, 2.2% for AGIs $100k-200k, 1.9% for AGIs over 200k)
Taxes paid: $5,302 (reported on 23.6% of returns)
96792:
$5,302
State:
$8,029
(% of AGI for various income ranges: 0.5% for AGIs below $25k, 1.8% for AGIs $25k-50k, 3.0% for AGIs $50k-75k, 4.2% for AGIs $75k-100k, 5.4% for AGIs $100k-200k, 6.7% for AGIs over 200k)
Earned income credit: $2,492 (reported on 32.3% of returns)
Here:
$2,492
State:
$2,113
(% of AGI for various income ranges: 10.7% for AGIs below $25k, 2.0% for AGIs $25k-50k)
Percentage of individuals using paid preparers for their 2012 taxes: 50.9%
Here:
51%
State:
53%
(% for various income ranges: 47.2% for AGIs below $25k, 51.6% for AGIs $25k-50k, 54.4% for AGIs $50k-75k, 56.1% for AGIs $75k-100k, 60.2% for AGIs $100k-200k, 80.0% for AGIs over 200k)
Averages for the 2004 tax year for zip code 96792, filed in 2005:
Average Adjusted Gross Income (AGI) in 2004: $31,425 (Individual Income Tax Returns)
Here:
$31,425
State:
$46,564
Salary/wage: $29,605 (reported on 89.5% of returns)
Here:
$29,605
State:
$39,831
(% of AGI for various income ranges: 103.4% for AGIs below $10k, 85.1% for AGIs $10k-25k, 85.4% for AGIs $25k-50k, 86.0% for AGIs $50k-75k, 84.5% for AGIs $75k-100k, 72.9% for AGIs over 100k)
Taxable interest for individuals: $553 (reported on 27.2% of returns)
This zip code:
$553
Hawaii:
$1,263
(% of AGI for various income ranges: 1.1% for AGIs below $10k, 0.5% for AGIs $10k-25k, 0.4% for AGIs $25k-50k, 0.4% for AGIs $50k-75k, 0.4% for AGIs $75k-100k, 0.7% for AGIs over 100k)
Taxable dividends: $1,054 (reported on 7.5% of returns)
Here:
$1,054
State:
$3,145
(% of AGI for various income ranges: 0.7% for AGIs below $10k, 0.2% for AGIs $10k-25k, 0.2% for AGIs $25k-50k, 0.2% for AGIs $50k-75k, 0.3% for AGIs $75k-100k, 0.3% for AGIs over 100k)
Net capital gain/loss: +$5,859 (reported on 5.8% of returns)
Here:
+$5,859
State:
+$16,059
(% of AGI for various income ranges: 0.2% for AGIs below $10k, 0.4% for AGIs $10k-25k, 0.3% for AGIs $25k-50k, 0.4% for AGIs $50k-75k, 1.3% for AGIs $75k-100k, 5.2% for AGIs over 100k)
Profit/loss from business: +$4,495 (reported on 7.8% of returns)
Here:
+$4,495
State:
+$13,847
(% of AGI for various income ranges: -2.8% for AGIs below $10k, 1.7% for AGIs $10k-25k, 0.9% for AGIs $25k-50k, 0.7% for AGIs $50k-75k, 0.8% for AGIs $75k-100k, 3.2% for AGIs over 100k)
Profit/loss from farming: +$2,504 (reported on 0.7% of returns)
Here:
+$2,504
State:
-$719
(% of AGI for various income ranges: 0.7% for AGIs below $10k, 0.2% for AGIs $10k-25k, 0.1% for AGIs $25k-50k, -0.0% for AGIs $50k-75k, -0.1% for AGIs $75k-100k)
IRA payment deduction: $2,161 (reported on 1.5% of returns)
96792:
$2,161
Hawaii:
$2,867
(% of AGI for various income ranges: 0.1% for AGIs $10k-25k, 0.1% for AGIs $25k-50k, 0.1% for AGIs $50k-75k, 0.1% for AGIs $75k-100k, 0.1% for AGIs over 100k)
Self-employed pension: $8,038 (reported on 0.2% of returns)
Here:
$8,038
Hawaii:
$15,523
Total itemized deductions: $16,303 (27% of AGI, reported on 25.1% of returns)
Here:
$16,303
State:
$20,647
Here:
26.9% of AGI
State:
23.5% of AGI
(% of AGI for various income ranges: 4.9% for AGIs below $10k, 6.3% for AGIs $10k-25k, 10.8% for AGIs $25k-50k, 16.1% for AGIs $50k-75k, 18.3% for AGIs $75k-100k, 16.7% for AGIs over 100k)
Charity contributions deductions: $2,792 (4% of AGI, reported on 22.4% of returns)
Here:
$2,792
State:
$2,966
Here:
4.5% of AGI
State:
3.3% of AGI
(% of AGI for various income ranges: 0.3% for AGIs below $10k, 0.9% for AGIs $10k-25k, 1.8% for AGIs $25k-50k, 2.6% for AGIs $50k-75k, 2.8% for AGIs $75k-100k, 2.3% for AGIs over 100k)
Total tax: $3,528 (reported on 62.1% of returns)
96792:
$3,528
State:
$7,224
(% of AGI for various income ranges: 1.5% for AGIs below $10k, 3.2% for AGIs $10k-25k, 5.4% for AGIs $25k-50k, 7.2% for AGIs $50k-75k, 9.2% for AGIs $75k-100k, 14.1% for AGIs over 100k)
Earned income credit: $1,770 (reported on 28.4% of returns)
Here:
$1,770
State:
$1,536
Percentage of individuals using paid preparers for their 2004 taxes: 59.9%
Here:
60%
State:
58%
(% for various income ranges: 51.3% for AGIs below $10k, 62.4% for AGIs $10k-25k, 61.0% for AGIs $25k-50k, 65.2% for AGIs $50k-75k, 65.0% for AGIs $75k-100k, 60.7% for AGIs over 100k)
Likely homosexual households (counted as self-reported same-sex unmarried-partner households)
Lesbian couples: 0.4% of all households
Gay men: 0.0% of all households
Household received Food Stamps/SNAP in the past 12 months: 3,977 Household did not receive Food Stamps/SNAP in the past 12 months: 9,983
Women who had a birth in the past 12 months: 846 (484 now married, 353 unmarried) Women who did not have a birth in the past 12 months: 10,860 (4,198 now married, 6,680 unmarried)
Housing units in zip code 96792 with a mortgage: 5,964 (538 second mortgage, 33 home equity loan, 395 both second mortgage and home equity loan) Houses without a mortgage: 34
Median monthly owner costs for units with a mortgage: $2,163 Median monthly owner costs for units without a mortgage: $499
Residents with income below the poverty level in 2022:
This zip code:
19.9%
Whole state:
10.2%
Residents with income below 50% of the poverty level in 2022:
This zip code:
7.2%
Whole state:
4.7%
Median number of rooms in houses and condos:
Here:
5.4
State:
5.5
Median number of rooms in apartments:
Here:
4.1
State:
3.9
Notable locations in this zip code not listed on our city pages
Notable locations in zip code 96792: Makaha Golf Course (A), Kāne‘ākī Heiau (B), Kuilioloa Heiau (C), Makua (D), Kamaile Heiau (E), Waianae Public Library (F), Honolulu Fire Department Station 26 Waianae (G), Emergency Medical Services Unit Waianae (H), Emergency Medical Services Unit Nanakuli (I), Honolulu Fire Department Station 28 Nanakuli (J). Display/hide their locations on the map
Shopping Centers: Nakatani Shopping Center (1), Pacific Shopping Mall Shopping Center (2), Waianae Cornet Village Shopping Center (3), Waianae Mall Shopping Center (4). Display/hide their locations on the map
Churches in zip code 96792 include: Ka Hana O Ke Akua United Church of Christ (A), Waianae United Methodist Church (B), Waianae Seventh Day Adventist Church (C), Waianae Protestant Church (D), Waianae Pentecostal Faith Church (E), Waianae Hongwanji Mission (F), Waianae Baptist Church (G), Maili Church of the Nazarene (H), Maile Church of Christ (I). Display/hide their locations on the map
Streams, rivers, and creeks: Kaua‘ōpu‘u Stream (A), Waikomo Stream (B), Ulehawa Stream (C), Kawiwi Stream (D), Kaupuni Stream (E), Punapohaku Stream (F), Punanaula Stream (G), ‘Eku Stream (H), Mā‘ili‘ilii Stream (I). Display/hide their locations on the map
Parks in zip code 96792 include: Kahi Kani Park (1), Lualualei Beach Park (2), Wai‘anae Field (3), Mā‘ili Community Park (4), Mā‘ili Kai Community Park (5), Nānāikapono Beach Park (6), Kea‘au Beach Park (7), Ulehawa Beach Park (8), Waianae Regional Park (9). Display/hide their locations on the map
Beaches: Mailiili Beach (A), Ohiki-lolo (B), Zablan Beach (C), Wai‘anae Kai Military Reservation Beach (D), Kahaloko (E), Puau (F), Pomokupa (G), Papaoneone (H), Nene‘u Beach (I). Display/hide their locations on the map
5,783 married couples with children.
5,052 single-parent households (903 men, 4,149 women).
82.2% of residents of 96792 zip code speak English at home.
1.1% of residents speak Spanish at home (88% very well, 10% well, 2% not well).
0.6% of residents speak other Indo-European language at home (79% very well, 21% well).
15.1% of residents speak Asian or Pacific Island language at home (71% very well, 15% well, 14% not well).
1.0% of residents speak other language at home (84% very well, 16% well).
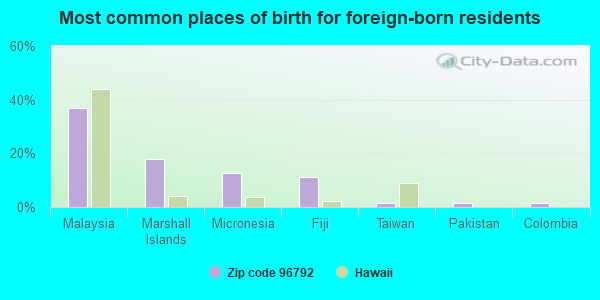
Foreign born population: 3,985 (7.8%) (45.9% of them are naturalized citizens)
This zip code:
7.8%
Whole state:
17.1%
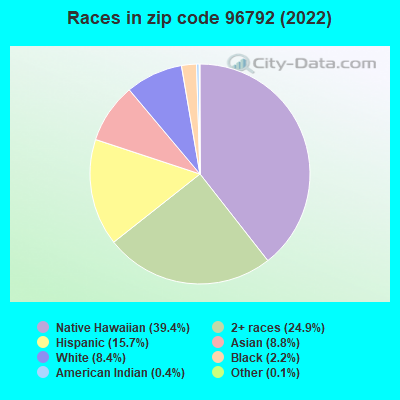
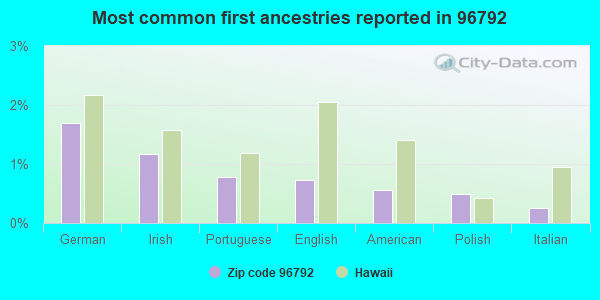
29%Malaysia
22%Marshall Islands
17%Fiji
15%Micronesia
1%Pakistan
1%Taiwan
1%Scotland
2%German
1%Irish
1%Portuguese
1%English
1%American
0%Polish
0%Italian
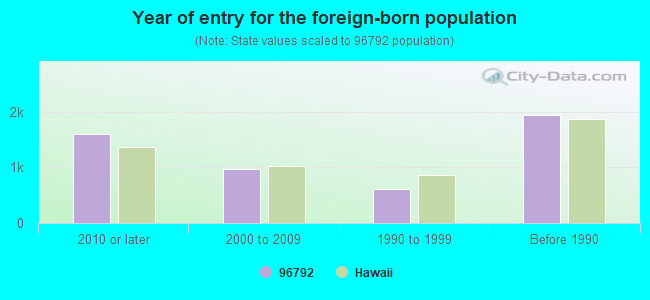
Year of entry for the foreign-born population
1,5992010 or later
9682000 to 2009
6041990 to 1999
1,938Before 1990
Major facilities with environmental interests located in this zip code:
NAVAL MAGAZINE LUALUALEI (LUALUALEI BRANCH) (3 CONSTELLATION ST in WAIANAE, HI) . Federal Facility. U.S. NAVY
SUPERFUND (Superfund database) STATE MASTER (HEER-FRS) STATE MASTER (Hawaii environmental compliance and hazardous materials tracking) UNDERGROUND STORAGE TANK PROGRAM (Hawaii Underground Storage Tank Program) Conditionally Exempt Small Quantity Generators, less than 100 kg/month of hazardous waste (Resource Conservation and Recovery Act (tracking hazardous waste)) - notification HAZARDOUS WASTE BIENNIAL REPORTER (Resource Conservation and Recovery Act (tracking hazardous waste)) Large Quantity Generators, more that 1000 kg of hazardous waste/month (Resource Conservation and Recovery Act (tracking hazardous waste)) - notification Large Quantity Generators, more that 1000 kg of hazardous waste/month (Resource Conservation and Recovery Act (tracking hazardous waste)) - notification TSD (Resource Conservation and Recovery Act (tracking hazardous waste)) Organizations: NAVY PUBLIC WORKS CENTER PEARL HARBOR (CONTACT/OPERATOR)
, CMDR NAVY REG HAWAII (CONTACT/OWNER)
, U S DEPT OF NAVY (CONTACT/OWNER)
, NAVY REGION HAWAII (CONTACT/OWNER)
Alternative names: LUALUAEI NAVAL MAGAZINE (FINDS), NAVAL MAGAZINE - LUALUALEI, NAVAL MAGAZINE - LUALUALEI BRANCH, NAVAL MAGAZINE LUALUALEI (WAIKELE BRANCH), NAVAL MAGAZINE LUALUALEI (WEST LOCH BRANCH), NAVAL MAGAZINE PEARL HARBOR BRANCH, NAVAL MAGAZINE PEARL HARBOR LAULUALEI BR, NRTF LAULUAFEI, USNAVY CMDR NAVY REG HI MAG LUALUALEI, USNAVY CMDR NAVY REG HI NAVAL MAG W LOCH, USNAVY CMDR NVY REG HI NAVAL MAG WAIKELE, USNAVY MAGAZINE LUALUALEI HQ BRANCH, USNAVY MAGAZINE PEARL HARBOR, W LOCH BRA
HAWAIIAN ELECTRIC COMPANY KAHE GENERATING STATION (89-900 FARRINGTON HIGHWAY in WAIANAE, HI)
AIR MAJOR (AIRS/AFS) OIL CONTROL (Facility Response Plan for oil discharge) UNDERGROUND STORAGE TANK PROGRAM (Hawaii Underground Storage Tank Program) (Integrated Compliance Information System) - ICIS-09-1999-0062, FORMAL ENFORCEMENT ACTION CRITERIA AND HAZARDOUS AIR POLLUTANT INVENTORY (Inventory of air pollution sources) National Pollutant Discharge Elimination System MAJOR (Tracking pollutant discharge elimination systems) - permit (Resource Conservation and Recovery Act (tracking hazardous waste)) Small Quantity Generators, between 100 kg and 1000 kg of hazardous waste/month (Resource Conservation and Recovery Act (tracking hazardous waste)) TSD (Resource Conservation and Recovery Act (tracking hazardous waste)) USED OIL PROGRAM (Resource Conservation and Recovery Act (tracking hazardous waste)) TRI REPORTER (Tracking of toxic chemicals releasing facilities) Business SIC classification: ELECTRIC SERVICES Business NAICS classification: FOSSIL FUEL ELECTRIC POWER GENERATION. Alternative names: HAWAIIAN ELECTRIC INDS. INC. KAHE GENERATING STATION, STEARNS-ROGER INC HAWAIIAN ELEC CO
WAIANAE HIGH SCHOOL (85-251 FARRINGTON HIGHWAY in WAIANAE, HI)
(Geographic Names Information System) (National Center for Education Statistics) - STATE ID-3-272 National Pollutant Discharge Elimination System NON-MAJOR (Tracking pollutant discharge elimination systems) - permit Business SIC classification: NONCLASSIFIABLE ESTABLISHMENTS Organizations: HAWAII DEPT OF EDUCATION (SCHOOL DISTRICT)
Alternative names: WAI?ANAE HIGH SCHOOL, WAIANAE HIGH SCHOOL IMPROVE, WAIANAE HIGH SCHOOL IMPROVEMNT
LEIHOKU ELEMENTARY SCHOOL (86-285 LEIHOKU STREET in WAIANAE, HI)
(Geographic Names Information System) (National Center for Education Statistics) - STATE ID-3-271 Organizations: HAWAII DEPT OF EDUCATION (SCHOOL DISTRICT)
NANAKULI ELEMENTARY SCHOOL (89-778 HALEAKALA AVENUE in WAIANAE, HI)
(Geographic Names Information System) (National Center for Education Statistics) - STATE ID-3-262 Organizations: HAWAII DEPT OF EDUCATION (SCHOOL DISTRICT)
NANAIKAPONO ELEMENTARY SCHOOL (89-195 FARRINGTON HIGHWAY in WAIANAE, HI)
(Geographic Names Information System) (National Center for Education Statistics) - STATE ID-3-261 Organizations: HAWAII DEPT OF EDUCATION (SCHOOL DISTRICT)
MAKAHA ELEMENTARY SCHOOL (84-200 ALA NAAUAO PLACE in WAIANAE, HI)
(Geographic Names Information System) (National Center for Education Statistics) - STATE ID-3-258 Organizations: HAWAII DEPT OF EDUCATION (SCHOOL DISTRICT)
SHELL SERVICE STATION (SILVA'S NANAKULI SHELL) (87-1796 FARRINGTON HIGHWAY in WAIANAE, HI)
STATE MASTER (Hawaii environmental compliance and hazardous materials tracking) UNDERGROUND STORAGE TANK PROGRAM (Hawaii Underground Storage Tank Program) (Integrated Compliance Information System) - ICIS-09-1999-0052, FORMAL ENFORCEMENT ACTION Business SIC classification: GASOLINE SERVICE STATIONS Alternative names: SILVA'S NAMAKULI SHELL STA
WAIANAE ELEMENTARY SCHOOL (85-220 MCARTHUR STREET in WAIANAE, HI)
(Geographic Names Information System) (National Center for Education Statistics) - STATE ID-3-270 Organizations: HAWAII DEPT OF EDUCATION (SCHOOL DISTRICT)
Alternative names: WAI?ANAE ELEMENTARY SCHOOL
WAIANAE INTERMEDIATE SCHOOL (85-626 FARRINGTON HIGHWAY in WAIANAE, HI)
(Geographic Names Information System) (National Center for Education Statistics) - STATE ID-3-273 Organizations: HAWAII DEPT OF EDUCATION (SCHOOL DISTRICT)
PVT LAND COMPANY (87-2020 FARRINGTON HIGHWAY in WAIANAE, HI)
SOLID WASTE PROGRAM (Hawaii Office Of Solid Waste) (Integrated Compliance Information System) - ICIS-09-2000-0173, FORMAL ENFORCEMENT ACTION Business SIC classification: GENERAL CONTRACTORS-NONRESIDENTIAL BUILDINGS, OTHER THAN INDUSTRIAL BUILDINGS AND WAREHOUSES Alternative names: PVT RECYCLING COMPANY
KA WAIHONA O KA NAAUAO NEW CENTURY PCS (85-1429 WAIANAE VALLEY ROAD in WAIANAE, HI)
(National Center for Education Statistics) - STATE ID-3-545 Organizations: HAWAII DEPT OF EDUCATION (SCHOOL DISTRICT)
NAVMAG LUALUALEI (NAVMAG in LUALUALEI, HI) . Federal Facility. U.S. NAVY
CRITERIA AND HAZARDOUS AIR POLLUTANT INVENTORY (Inventory of air pollution sources) COMMUNITY WATER SYSTEM (SDWIS) - SDWIS-HI0000358 1T, WATER TREATMENT PLANT Business SIC and NAICS classification: NATIONAL SECURITY
Housing units lacking complete plumbing facilities: 3.3% Housing units lacking complete kitchen facilities: 6.0%
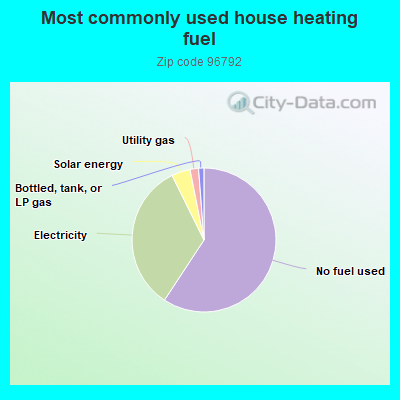
59.2%No fuel used
33.4%Electricity
4.2%Solar energy
1.9%Utility gas
1.2%Bottled, tank, or LP gas
Population in 1990: 37,518. Population change in the 1990s: +4,824 (+12.9%).
Place of birth for U.S.-born residents:
This state: 39,612
Northeast: 696
Midwest: 891
South: 1,986
West: 2,860
61% of the 96792 zip code residents lived in the same house 5 years ago. Out of people who lived in different houses, 88% lived in this county. Out of people who lived in different counties, 50% lived in Hawaii.
89% of the 96792 zip code residents lived in the same house 1 year ago. Out of people who lived in different houses, 81% moved from this county. Out of people who lived in different houses, 3% moved from different county within same state. Out of people who lived in different houses, 14% moved from different state. Out of people who lived in different houses, 2% moved from abroad.
Private vs. public school enrollment:
Students in private schools in grades 1 to 8 (elementary and middle school): 1,053
Here:
15.4%
Hawaii:
21.6%
Students in private schools in grades 9 to 12 (high school): 602
Here:
16.9%
Hawaii:
21.5%
Students in private undergraduate colleges: 463
Here:
29.3%
Hawaii:
23.3%
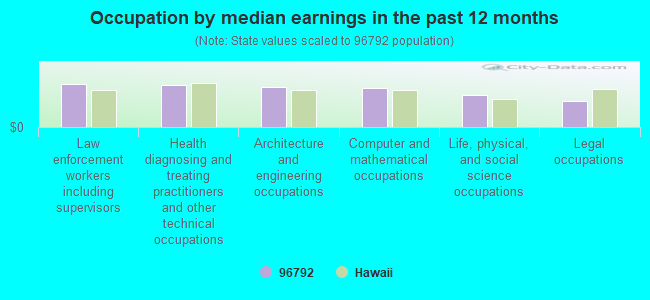
Occupation by median earnings in the past 12 months ($)
100,286Law enforcement workers including supervisors
96,054Health diagnosing and treating practitioners and other technical occupations
91,268Architecture and engineering occupations
89,189Computer and mathematical occupations
74,156Life, physical, and social science occupations
59,923Legal occupations
Companies with biggest federal contracts located in this zip code (WAIANAE, HI):
PVT LAND COMPANY LTD (87-2020 FARRINGTON HWY; small business) : $4,296,207 in 153 contractsfrom 2000 to 2006
Contracts for Construction of Structures and Facilities -- Sewage and Waste Facilities, Trash/Garbage Collection Services - Including Portable Sanitation Services, Lease or Rental of Equipment -- Ground Effect Vehicles, Motor Vehicles, Trailers, and Cycles by Navy Signed by year:2000: $500,000; 2001: $1,103,530; 2002: $1,382,771; 2003: $499,099; 2004: $270,114; 2005: $235,488; 2006: $305,205.
Biggest contracts:
$100,000 with Navy for Construction of Structures and Facilities -- Sewage and Waste Facilities. Signed on 2003-10-06. Completion date: 2003-10-31.
$100,000 with Navy for Trash/Garbage Collection Services - Including Portable Sanitation Services. Signed on 2002-10-01. Completion date: 2002-10-22.
$100,000, same as above.Signed on 2002-10-24. Completion date: 2012-11-12.
$100,000, same as above.Signed on 2003-06-02. Completion date: 2003-06-30.
KOLONA PAINTING, INC (84-1042 MAUNAOLU ST; small business) : $1,672,998 in 25 contractsfrom 2001 to 2005
Contracts for Maintenance, Repair or Alteration of Real Property -- Other Administrative Facilities and Service Buildings, Maintenance, Repair or Alteration of Real Property -- Miscellaneous Buildings, Maintenance, Repair or Alteration of Real Property -- Other Non-Building Facilities by Army Signed by year:2000: $0; 2001: $437,788; 2002: $1,036,401; 2003: $154,232; 2004: -$37,046; 2005: $81,623; 2006: $0.
Biggest contracts:
$203,149 with Army for Maintenance, Repair or Alteration of Real Property -- Other Administrative Facilities and Service Buildings. Signed on 2002-04-17. Completion date: 2002-06-10.
$164,510, same as above.Signed on 2002-04-17. Completion date: 2002-05-24.
$163,466 with Army for Maintenance, Repair or Alteration of Real Property -- Miscellaneous Buildings. Signed on 2003-06-30. Completion date: 2004-08-27.
$144,901 with Army for Maintenance, Repair or Alteration of Real Property -- Other Administrative Facilities and Service Buildings. Signed on 2001-09-30. Completion date: 2001-11-06.
ALOHA LP GAS INC (87 275 MAIPALAOA RD; small business) : $1,525,964 in 9 contractsfrom 1999 to 2004
Contracts for Gas Services, Gases: Compressed and Liquefied, Liquid Propellants and Fuels, Petroleum Base by Navy Signed by year:2000: $168,836; 2001: $368,588; 2002: $519,159; 2003: $28,117; 2004: $279,535; 2005: $0; 2006: $0.
Biggest contracts:
$279,535 with Navy for Gas Services. Signed on 2004-11-17. Completion date: 2005-10-31.
$245,034 with Navy for Gases: Compressed and Liquefied. Signed on 2002-10-01. Completion date: 2003-09-30.
$244,033, same as above.Signed on 2002-12-11. Completion date: 2002-12-18.
$199,752, same as above.Signed on 2001-10-01. Completion date: 2002-09-30.
RHINO BUILDERS, INC (87-1610 ULEHAWA ROAD; small business) : $925,200 in 22 contractsfrom 1999 to 2004
Contracts for Maintenance, Repair or Alteration of Real Property -- Other Non-Building Facilities, Maintenance, Repair or Alteration of Real Property -- Air Traffic Control Towers, Maintenance, Repair or Alteration of Real Property -- Family Housing Facilities, Maintenance, Repair or Alteration of Real Property -- Other Administrative Facilities and Service Buildings, and moreby Army, Air Force, United States Coast Guard (disused code: now 7008), Public Buildings Service, and others Signed by year:2000: $651,017; 2001: $355,000; 2002: $11,009; 2003: $0; 2004: -$98,826; 2005: $0; 2006: $0.
Biggest contracts:
$372,935 with Army for Maintenance, Repair or Alteration of Real Property -- Other Non-Building Facilities. Signed on 2000-08-21. Completion date: 2001-01-22.
$249,736 with Army for Maintenance, Repair or Alteration of Real Property -- Air Traffic Control Towers. Signed on 2000-09-26. Completion date: 2001-03-21.
$240,000 with Air Force for Maintenance, Repair or Alteration of Real Property -- Family Housing Facilities. Taking place in CA. Signed on 2001-09-28. Completion date: 2002-09-30.
$84,000 with United States Coast Guard (disused code: now 7008) for Maintenance, Repair or Alteration of Real Property -- Other Administrative Facilities and Service Buildings. Signed on 2001-02-15. Completion date: 2001-10-15.
MEDEIROS TRUCKING SERVICE INC (87-299 MALIONA STREET; small business) : $665,799 in 4 contractsfrom 2001 to 2003
$241,800 with Army for Mineral Construction Materials, Bulk. Signed on 2003-01-24. Completion date: 2003-01-24.
$180,323 with Army for Miscellaneous Construction Materials. Signed on 2002-09-30. Completion date: 2002-08-07.
$179,000, same as above.Signed on 2002-06-28. Completion date: 2002-06-30.
$64,676 with Army for Mineral Construction Materials, Bulk. Signed on 2001-11-15. Completion date: 2001-11-14.
ISLAND CRANE & MARINE SERVICES (83580 FARRINGTON HIGHWAY; small business) : $272,500 in 2 contractsfrom 2000 to 2001
$387,500 with U.S. Army Corps of Engineers - civil program financing only for Maintenance, Repair or Alteration of Real Property -- Dredging. Signed on 2000-08-10. Completion date: 2000-02-14.
-$115,000, same as above.Signed on 2001-05-16. Completion date: 2001-05-16.
WEST COAST ROOFING, INC (85-841-C FARRINGTON HWY; small business) : $75,327 in 2 contractsin 2005
$49,436 with Army for Construction of Structures and Facilities -- Other Non-Building Facilities. Signed on 2005-08-09. Completion date: 2005-08-18.
$25,891, same as above.Signed on 2005-08-31. Completion date: 2005-08-29.
PARADISE LUA INC (87-735 ILIILI ROAD; small business) : $73,015 in 5 contractsfrom 2001 to 2004
Contracts for Waste Treatment and Storage, Lease or Rental of Equipment -- Toiletries by Air Force, Army Signed by year:2000: $0; 2001: $70,012; 2002: $0; 2003: $0; 2004: $3,003; 2005: $0; 2006: $0.
Biggest contracts:
$36,012 with Air Force for Waste Treatment and Storage. Signed on 2001-10-01. Completion date: 2002-09-30.
$34,000, same as above.Signed on 2001-05-18. Completion date: 2001-09-30.
$3,003 with Army for Lease or Rental of Equipment -- Toiletries. Signed on 2004-09-22. Completion date: 2002-09-30.
$0, same as above.Signed on 2004-09-22. Completion date: 2002-09-30.
JEROME LEWIS (87-486 HAKIMO RD; small business)
$36,590 with Air Force for Radio and Television Communication Equipment, Except Airborne. Signed on 2000-01-04. Completion date: 2000-01-30.
TECHNICAL CONSULTING SERVICES (86-303 MAILIILII RD; small business)
$29,711 with Army for Hospital Furniture, Equipment, Utensils, and Supplies. Signed on 2002-03-21. Completion date: 2002-04-22.
Top industries in this zip code by the number of employees in 2005:
Other Services (except Public Administration): Other Similar Organizations (except Business, Professional, Labor, and Political Organizations) (20-49: 1, 10-19: 1, 5-9: 2, 1-4: 7)
People in group quarters in 2010:
1,010 people in emergency and transitional shelters (with sleeping facilities) for people experiencing homelessness
465 people in other noninstitutional facilities
156 people in group homes intended for adults
85 people in nursing facilities/skilled-nursing facilities
35 people in group homes for juveniles (non-correctional)
31 people in workers' group living quarters and job corps centers
29 people in residential treatment centers for adults
People in group quarters in 2000:
204 people in other noninstitutional group quarters
95 people in nursing homes
40 people in homes for the mentally retarded
29 people in other group homes
26 people in homes for the physically handicapped
21 people in homes for the mentally ill
14 people in other types of correctional institutions
13 people in religious group quarters
6 people in other workers' dormitories
5 people in other nonhousehold living situations
3 people in homes or halfway houses for drug/alcohol abuse
Fatal accident statistics in 2014:
Fatal accident count: 3
Vehicles involved in fatal accidents: 8
Fatal accidents caused by drunken drivers: 1
Fatalities: 3
Persons involved in fatal accidents: 14
Pedestrians involved in fatal accidents: 1
Fatal accident statistics in 2013:
Fatal accident count: 2
Vehicles involved in fatal accidents: 2
Fatal accidents caused by drunken drivers: 1
Fatalities: 2
Persons involved in fatal accidents: 2
Pedestrians involved in fatal accidents: 0
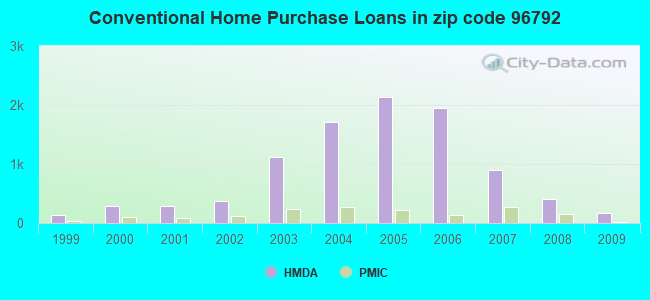
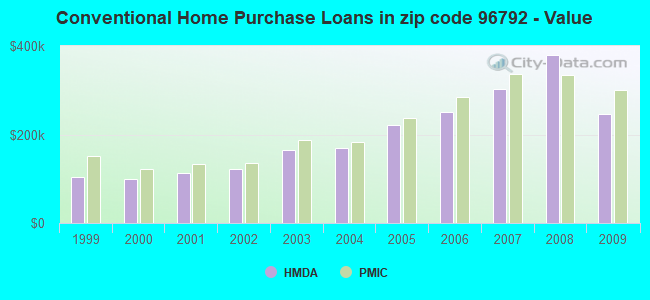
Home Mortgage Disclosure Act Aggregated Statistics For Year 2009 (Based on 14 full and 4 partial tracts)
A) FHA, FSA/RHS & VA Home Purchase Loans
B) Conventional Home Purchase Loans
C) Refinancings
D) Home Improvement Loans
E) Loans on Dwellings For 5+ Families
F) Non-occupant Loans on < 5 Family Dwellings (A B C & D)
Number
Average Value
Number
Average Value
Number
Average Value
Number
Average Value
Number
Average Value
Number
Average Value
LOANS ORIGINATED
275
$337,940
175
$245,844
1,092
$277,307
76
$147,083
2
$1,000,000
185
$249,324
APPLICATIONS APPROVED, NOT ACCEPTED
27
$322,965
14
$198,166
200
$270,733
16
$312,701
0
$0
29
$260,869
APPLICATIONS DENIED
92
$279,437
70
$274,151
650
$272,539
73
$178,662
2
$1,884,000
124
$244,315
APPLICATIONS WITHDRAWN
23
$290,660
28
$269,111
283
$283,552
23
$157,401
2
$14,667,000
53
$285,853
FILES CLOSED FOR INCOMPLETENESS
4
$230,090
0
$0
64
$241,841
4
$193,820
0
$0
4
$325,292
Aggregated Statistics For Year 2008 (Based on 14 full and 4 partial tracts)
A) FHA, FSA/RHS & VA Home Purchase Loans
B) Conventional Home Purchase Loans
C) Refinancings
D) Home Improvement Loans
E) Loans on Dwellings For 5+ Families
F) Non-occupant Loans on < 5 Family Dwellings (A B C & D)
G) Loans On Manufactured Home Dwelling (A B C & D)
Number
Average Value
Number
Average Value
Number
Average Value
Number
Average Value
Number
Average Value
Number
Average Value
Number
Average Value
LOANS ORIGINATED
257
$377,336
403
$380,217
816
$253,158
116
$138,822
4
$1,275,000
310
$316,763
0
$0
APPLICATIONS APPROVED, NOT ACCEPTED
11
$303,985
44
$334,132
152
$268,634
36
$167,211
0
$0
39
$319,640
0
$0
APPLICATIONS DENIED
62
$360,879
156
$312,377
1,029
$277,278
158
$178,221
0
$0
190
$287,535
6
$362,333
APPLICATIONS WITHDRAWN
40
$332,444
110
$362,526
332
$273,733
19
$228,867
2
$800,000
66
$362,027
6
$76,762
FILES CLOSED FOR INCOMPLETENESS
0
$0
12
$367,882
44
$267,268
2
$154,880
0
$0
16
$278,736
0
$0
Aggregated Statistics For Year 2007 (Based on 14 full and 4 partial tracts)
A) FHA, FSA/RHS & VA Home Purchase Loans
B) Conventional Home Purchase Loans
C) Refinancings
D) Home Improvement Loans
E) Loans on Dwellings For 5+ Families
F) Non-occupant Loans on < 5 Family Dwellings (A B C & D)
G) Loans On Manufactured Home Dwelling (A B C & D)
Number
Average Value
Number
Average Value
Number
Average Value
Number
Average Value
Number
Average Value
Number
Average Value
Number
Average Value
LOANS ORIGINATED
174
$388,162
891
$303,201
1,600
$253,684
280
$161,212
6
$825,000
536
$262,635
2
$149,000
APPLICATIONS APPROVED, NOT ACCEPTED
13
$324,512
147
$262,149
442
$249,549
45
$167,546
0
$0
98
$244,400
0
$0
APPLICATIONS DENIED
44
$307,579
313
$287,976
1,339
$273,217
299
$160,435
0
$0
232
$256,478
0
$0
APPLICATIONS WITHDRAWN
38
$282,602
144
$289,877
545
$268,565
107
$169,046
0
$0
72
$297,868
0
$0
FILES CLOSED FOR INCOMPLETENESS
2
$144,000
36
$345,610
94
$253,959
6
$203,658
0
$0
12
$398,259
0
$0
Aggregated Statistics For Year 2006 (Based on 14 full and 4 partial tracts)
A) FHA, FSA/RHS & VA Home Purchase Loans
B) Conventional Home Purchase Loans
C) Refinancings
D) Home Improvement Loans
E) Loans on Dwellings For 5+ Families
F) Non-occupant Loans on < 5 Family Dwellings (A B C & D)
G) Loans On Manufactured Home Dwelling (A B C & D)
Number
Average Value
Number
Average Value
Number
Average Value
Number
Average Value
Number
Average Value
Number
Average Value
Number
Average Value
LOANS ORIGINATED
211
$335,983
1,957
$250,839
2,417
$238,954
345
$159,873
0
$0
899
$261,778
0
$0
APPLICATIONS APPROVED, NOT ACCEPTED
8
$307,162
304
$262,229
437
$256,720
54
$159,020
0
$0
170
$263,098
0
$0
APPLICATIONS DENIED
23
$359,370
631
$249,457
1,353
$233,822
299
$151,223
0
$0
294
$270,132
6
$123,667
APPLICATIONS WITHDRAWN
17
$391,474
325
$244,632
1,050
$248,132
127
$182,432
2
$1,767,000
144
$260,337
2
$65,000
FILES CLOSED FOR INCOMPLETENESS
0
$0
99
$194,374
333
$254,540
15
$225,267
0
$0
34
$260,966
0
$0
Aggregated Statistics For Year 2005 (Based on 14 full and 4 partial tracts)
A) FHA, FSA/RHS & VA Home Purchase Loans
B) Conventional Home Purchase Loans
C) Refinancings
D) Home Improvement Loans
E) Loans on Dwellings For 5+ Families
F) Non-occupant Loans on < 5 Family Dwellings (A B C & D)
G) Loans On Manufactured Home Dwelling (A B C & D)
Number
Average Value
Number
Average Value
Number
Average Value
Number
Average Value
Number
Average Value
Number
Average Value
Number
Average Value
LOANS ORIGINATED
102
$234,398
2,144
$220,739
2,518
$213,296
301
$154,779
2
$700,000
1,120
$204,265
4
$123,668
APPLICATIONS APPROVED, NOT ACCEPTED
10
$170,902
301
$214,361
353
$194,853
25
$156,026
0
$0
104
$222,193
0
$0
APPLICATIONS DENIED
16
$231,664
616
$225,186
1,286
$212,107
188
$127,006
0
$0
294
$219,093
6
$98,033
APPLICATIONS WITHDRAWN
12
$247,126
451
$213,130
905
$210,074
178
$203,059
0
$0
200
$214,236
4
$242,000
FILES CLOSED FOR INCOMPLETENESS
2
$209,260
80
$197,533
369
$227,089
2
$96,305
0
$0
39
$275,685
2
$349,000
Aggregated Statistics For Year 2004 (Based on 14 full and 4 partial tracts)
A) FHA, FSA/RHS & VA Home Purchase Loans
B) Conventional Home Purchase Loans
C) Refinancings
D) Home Improvement Loans
E) Loans on Dwellings For 5+ Families
F) Non-occupant Loans on < 5 Family Dwellings (A B C & D)
G) Loans On Manufactured Home Dwelling (A B C & D)
Number
Average Value
Number
Average Value
Number
Average Value
Number
Average Value
Number
Average Value
Number
Average Value
Number
Average Value
LOANS ORIGINATED
110
$191,264
1,715
$169,779
2,046
$171,842
152
$128,204
10
$749,072
951
$159,639
2
$212,000
APPLICATIONS APPROVED, NOT ACCEPTED
8
$144,729
282
$159,480
411
$172,089
41
$87,994
0
$0
177
$158,482
0
$0
APPLICATIONS DENIED
22
$169,184
327
$175,742
1,053
$174,628
137
$84,245
4
$171,000
199
$163,945
0
$0
APPLICATIONS WITHDRAWN
25
$164,780
249
$156,129
1,126
$172,305
73
$103,620
0
$0
163
$128,407
2
$185,000
FILES CLOSED FOR INCOMPLETENESS
0
$0
24
$202,701
153
$173,429
0
$0
0
$0
15
$178,524
0
$0
Aggregated Statistics For Year 2003 (Based on 14 full and 4 partial tracts)
A) FHA, FSA/RHS & VA Home Purchase Loans
B) Conventional Home Purchase Loans
C) Refinancings
D) Home Improvement Loans
E) Loans on Dwellings For 5+ Families
F) Non-occupant Loans on < 5 Family Dwellings (A B C & D)
Number
Average Value
Number
Average Value
Number
Average Value
Number
Average Value
Number
Average Value
Number
Average Value
LOANS ORIGINATED
180
$179,202
1,112
$164,009
2,360
$151,857
72
$77,490
2
$704,000
740
$148,627
APPLICATIONS APPROVED, NOT ACCEPTED
9
$185,089
194
$155,768
309
$169,242
5
$39,508
0
$0
166
$155,576
APPLICATIONS DENIED
22
$135,596
194
$158,429
908
$161,707
38
$24,338
0
$0
166
$140,745
APPLICATIONS WITHDRAWN
11
$180,467
143
$197,942
865
$161,309
15
$65,545
0
$0
124
$171,862
FILES CLOSED FOR INCOMPLETENESS
4
$107,000
27
$211,312
148
$133,139
0
$0
0
$0
39
$128,441
Aggregated Statistics For Year 2002 (Based on 10 full and 2 partial tracts)
A) FHA, FSA/RHS & VA Home Purchase Loans
B) Conventional Home Purchase Loans
C) Refinancings
D) Home Improvement Loans
F) Non-occupant Loans on < 5 Family Dwellings (A B C & D)
Number
Average Value
Number
Average Value
Number
Average Value
Number
Average Value
Number
Average Value
LOANS ORIGINATED
118
$141,853
366
$122,011
773
$136,633
40
$24,974
207
$103,830
APPLICATIONS APPROVED, NOT ACCEPTED
8
$130,431
90
$128,435
100
$154,316
10
$20,989
29
$100,089
APPLICATIONS DENIED
13
$131,605
68
$130,405
293
$151,776
33
$32,099
42
$97,271
APPLICATIONS WITHDRAWN
18
$145,707
50
$126,985
462
$157,937
21
$27,601
58
$117,464
FILES CLOSED FOR INCOMPLETENESS
2
$115,000
6
$107,075
72
$171,152
0
$0
5
$75,774
Aggregated Statistics For Year 2001 (Based on 10 full and 2 partial tracts)
A) FHA, FSA/RHS & VA Home Purchase Loans
B) Conventional Home Purchase Loans
C) Refinancings
D) Home Improvement Loans
F) Non-occupant Loans on < 5 Family Dwellings (A B C & D)
Number
Average Value
Number
Average Value
Number
Average Value
Number
Average Value
Number
Average Value
LOANS ORIGINATED
145
$135,146
288
$114,109
621
$129,105
36
$22,808
172
$111,193
APPLICATIONS APPROVED, NOT ACCEPTED
17
$127,136
48
$104,471
95
$160,011
10
$23,592
23
$97,147
APPLICATIONS DENIED
28
$106,180
98
$98,942
307
$156,266
46
$16,729
52
$93,786
APPLICATIONS WITHDRAWN
14
$139,261
44
$85,105
181
$124,027
20
$21,766
24
$99,031
FILES CLOSED FOR INCOMPLETENESS
2
$167,480
8
$68,738
181
$172,783
2
$24,920
5
$115,580
Aggregated Statistics For Year 2000 (Based on 10 full and 2 partial tracts)
A) FHA, FSA/RHS & VA Home Purchase Loans
B) Conventional Home Purchase Loans
C) Refinancings
D) Home Improvement Loans
E) Loans on Dwellings For 5+ Families
F) Non-occupant Loans on < 5 Family Dwellings (A B C & D)
Number
Average Value
Number
Average Value
Number
Average Value
Number
Average Value
Number
Average Value
Number
Average Value
LOANS ORIGINATED
145
$128,182
284
$98,933
338
$89,058
97
$9,155
1
$1,399,220
139
$82,548
APPLICATIONS APPROVED, NOT ACCEPTED
7
$115,331
65
$121,323
81
$179,901
15
$21,437
0
$0
12
$125,436
APPLICATIONS DENIED
26
$111,253
134
$95,836
137
$128,760
27
$15,807
0
$0
37
$105,220
APPLICATIONS WITHDRAWN
16
$155,151
36
$106,078
71
$111,290
4
$34,000
0
$0
20
$89,278
FILES CLOSED FOR INCOMPLETENESS
4
$104,938
12
$99,704
223
$179,195
4
$64,493
0
$0
6
$131,615
Aggregated Statistics For Year 1999 (Based on 5 full and 3 partial tracts)
A) FHA, FSA/RHS & VA Home Purchase Loans
B) Conventional Home Purchase Loans
C) Refinancings
D) Home Improvement Loans
E) Loans on Dwellings For 5+ Families
F) Non-occupant Loans on < 5 Family Dwellings (A B C & D)
2003 - 2018 National Fire Incident Reporting System (NFIRS) incidents
Based on the data from the years 2003 - 2018 the average number of fire incidents per year is 378. The highest number of fire incidents - 823 took place in 2005, and the least - 166 in 2003. The data has a rising trend.
When looking into fire subcategories, the most reports belonged to: Outside Fires (71.3%), and Mobile Property/Vehicle Fires (18.5%).
Fire incident types reported to NFIRS in Zip Code 96792


+$2,504
-$719
(% of AGI for various income ranges: 0.7% for AGIs below $10k, 0.2% for AGIs $10k-25k, 0.1% for AGIs $25k-50k, -0.0% for AGIs $50k-75k, -0.1% for AGIs $75k-100k) Nearest zip codes: 96759, 96791, 96857, 96707, 96706, 96712.


 . Federal Facility. U.S. NAVY
 Based on the data from the years 2003 - 2018 the average number of fire incidents per year is 378. The highest number of fire incidents - 823 took place in 2005, and the least - 166 in 2003. The data has a rising trend.
 When looking into fire subcategories, the most reports belonged to: Outside Fires (71.3%), and Mobile Property/Vehicle Fires (18.5%).