Waianae, Hawaii Submit your own pictures of this place and show them to the world
OSM Map
General Map
Google Map
MSN Map
OSM Map
General Map
Google Map
MSN Map
OSM Map
General Map
Google Map
MSN Map
OSM Map
General Map
Google Map
MSN Map
Please wait while loading the map...
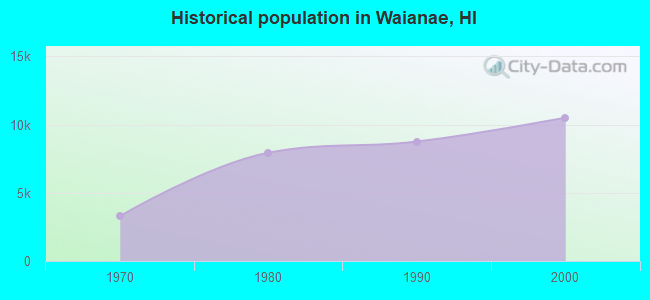
Population in 2010: 13,177. Population change since 2000: +25.4%Males: 6,581 Females: 6,596
March 2022 cost of living index in Waianae: 131.6 (high, U.S. average is 100) Percentage of residents living in poverty in 2022: 18.4%for White Non-Hispanic residents , 10.3% for Black residents , 18.5% for Hispanic or Latino residents , 88.2% for American Indian residents , 21.4% for Native Hawaiian and other Pacific Islander residents , 4.9% for other race residents , 20.1% for two or more races residents )
Profiles of local businesses
Business Search - 14 Million verified businesses
Data:
Median household income ($)
Median household income (% change since 2000)
Household income diversity
Ratio of average income to average house value (%)
Ratio of average income to average rent
Median household income ($) - White
Median household income ($) - Black or African American
Median household income ($) - Asian
Median household income ($) - Hispanic or Latino
Median household income ($) - American Indian and Alaska Native
Median household income ($) - Multirace
Median household income ($) - Other Race
Median household income for houses/condos with a mortgage ($)
Median household income for apartments without a mortgage ($)
Races - White alone (%)
Races - White alone (% change since 2000)
Races - Black alone (%)
Races - Black alone (% change since 2000)
Races - American Indian alone (%)
Races - American Indian alone (% change since 2000)
Races - Asian alone (%)
Races - Asian alone (% change since 2000)
Races - Hispanic (%)
Races - Hispanic (% change since 2000)
Races - Native Hawaiian and Other Pacific Islander alone (%)
Races - Native Hawaiian and Other Pacific Islander alone (% change since 2000)
Races - Two or more races (%)
Races - Two or more races (% change since 2000)
Races - Other race alone (%)
Races - Other race alone (% change since 2000)
Racial diversity
Unemployment (%)
Unemployment (% change since 2000)
Unemployment (%) - White
Unemployment (%) - Black or African American
Unemployment (%) - Asian
Unemployment (%) - Hispanic or Latino
Unemployment (%) - American Indian and Alaska Native
Unemployment (%) - Multirace
Unemployment (%) - Other Race
Population density (people per square mile)
Population - Males (%)
Population - Females (%)
Population - Males (%) - White
Population - Males (%) - Black or African American
Population - Males (%) - Asian
Population - Males (%) - Hispanic or Latino
Population - Males (%) - American Indian and Alaska Native
Population - Males (%) - Multirace
Population - Males (%) - Other Race
Population - Females (%) - White
Population - Females (%) - Black or African American
Population - Females (%) - Asian
Population - Females (%) - Hispanic or Latino
Population - Females (%) - American Indian and Alaska Native
Population - Females (%) - Multirace
Population - Females (%) - Other Race
Coronavirus confirmed cases (Apr 27, 2024)
Deaths caused by coronavirus (Apr 27, 2024)
Coronavirus confirmed cases (per 100k population) (Apr 27, 2024)
Deaths caused by coronavirus (per 100k population) (Apr 27, 2024)
Daily increase in number of cases (Apr 27, 2024)
Weekly increase in number of cases (Apr 27, 2024)
Cases doubled (in days) (Apr 27, 2024)
Hospitalized patients (Apr 18, 2022)
Negative test results (Apr 18, 2022)
Total test results (Apr 18, 2022)
COVID Vaccine doses distributed (per 100k population) (Sep 19, 2023)
COVID Vaccine doses administered (per 100k population) (Sep 19, 2023)
COVID Vaccine doses distributed (Sep 19, 2023)
COVID Vaccine doses administered (Sep 19, 2023)
Likely homosexual households (%)
Likely homosexual households (% change since 2000)
Likely homosexual households - Lesbian couples (%)
Likely homosexual households - Lesbian couples (% change since 2000)
Likely homosexual households - Gay men (%)
Likely homosexual households - Gay men (% change since 2000)
Cost of living index
Median gross rent ($)
Median contract rent ($)
Median monthly housing costs ($)
Median house or condo value ($)
Median house or condo value ($ change since 2000)
Mean house or condo value by units in structure - 1, detached ($)
Mean house or condo value by units in structure - 1, attached ($)
Mean house or condo value by units in structure - 2 ($)
Mean house or condo value by units in structure by units in structure - 3 or 4 ($)
Mean house or condo value by units in structure - 5 or more ($)
Mean house or condo value by units in structure - Boat, RV, van, etc. ($)
Mean house or condo value by units in structure - Mobile home ($)
Median house or condo value ($) - White
Median house or condo value ($) - Black or African American
Median house or condo value ($) - Asian
Median house or condo value ($) - Hispanic or Latino
Median house or condo value ($) - American Indian and Alaska Native
Median house or condo value ($) - Multirace
Median house or condo value ($) - Other Race
Median resident age
Resident age diversity
Median resident age - Males
Median resident age - Females
Median resident age - White
Median resident age - Black or African American
Median resident age - Asian
Median resident age - Hispanic or Latino
Median resident age - American Indian and Alaska Native
Median resident age - Multirace
Median resident age - Other Race
Median resident age - Males - White
Median resident age - Males - Black or African American
Median resident age - Males - Asian
Median resident age - Males - Hispanic or Latino
Median resident age - Males - American Indian and Alaska Native
Median resident age - Males - Multirace
Median resident age - Males - Other Race
Median resident age - Females - White
Median resident age - Females - Black or African American
Median resident age - Females - Asian
Median resident age - Females - Hispanic or Latino
Median resident age - Females - American Indian and Alaska Native
Median resident age - Females - Multirace
Median resident age - Females - Other Race
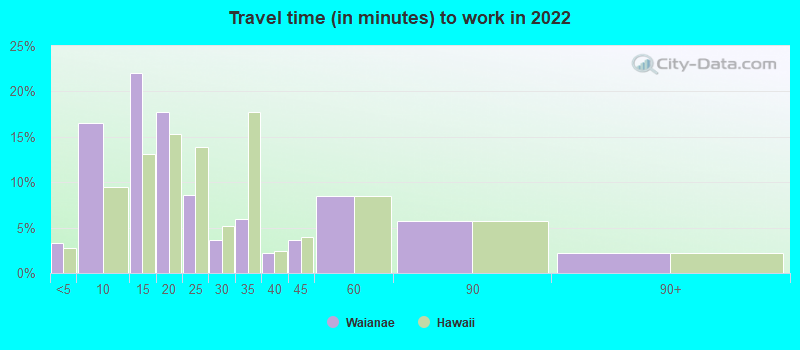
Commute - mean travel time to work (minutes)
Travel time to work - Less than 5 minutes (%)
Travel time to work - Less than 5 minutes (% change since 2000)
Travel time to work - 5 to 9 minutes (%)
Travel time to work - 5 to 9 minutes (% change since 2000)
Travel time to work - 10 to 19 minutes (%)
Travel time to work - 10 to 19 minutes (% change since 2000)
Travel time to work - 20 to 29 minutes (%)
Travel time to work - 20 to 29 minutes (% change since 2000)
Travel time to work - 30 to 39 minutes (%)
Travel time to work - 30 to 39 minutes (% change since 2000)
Travel time to work - 40 to 59 minutes (%)
Travel time to work - 40 to 59 minutes (% change since 2000)
Travel time to work - 60 to 89 minutes (%)
Travel time to work - 60 to 89 minutes (% change since 2000)
Travel time to work - 90 or more minutes (%)
Travel time to work - 90 or more minutes (% change since 2000)
Marital status - Never married (%)
Marital status - Now married (%)
Marital status - Separated (%)
Marital status - Widowed (%)
Marital status - Divorced (%)
Median family income ($)
Median family income (% change since 2000)
Median non-family income ($)
Median non-family income (% change since 2000)
Median per capita income ($)
Median per capita income (% change since 2000)
Median family income ($) - White
Median family income ($) - Black or African American
Median family income ($) - Asian
Median family income ($) - Hispanic or Latino
Median family income ($) - American Indian and Alaska Native
Median family income ($) - Multirace
Median family income ($) - Other Race
Median year house/condo built
Median year apartment built
Year house built - Built 2005 or later (%)
Year house built - Built 2000 to 2004 (%)
Year house built - Built 1990 to 1999 (%)
Year house built - Built 1980 to 1989 (%)
Year house built - Built 1970 to 1979 (%)
Year house built - Built 1960 to 1969 (%)
Year house built - Built 1950 to 1959 (%)
Year house built - Built 1940 to 1949 (%)
Year house built - Built 1939 or earlier (%)
Average household size
Household density (households per square mile)
Average household size - White
Average household size - Black or African American
Average household size - Asian
Average household size - Hispanic or Latino
Average household size - American Indian and Alaska Native
Average household size - Multirace
Average household size - Other Race
Occupied housing units (%)
Vacant housing units (%)
Owner occupied housing units (%)
Renter occupied housing units (%)
Vacancy status - For rent (%)
Vacancy status - For sale only (%)
Vacancy status - Rented or sold, not occupied (%)
Vacancy status - For seasonal, recreational, or occasional use (%)
Vacancy status - For migrant workers (%)
Vacancy status - Other vacant (%)
Residents with income below the poverty level (%)
Residents with income below 50% of the poverty level (%)
Children below poverty level (%)
Poor families by family type - Married-couple family (%)
Poor families by family type - Male, no wife present (%)
Poor families by family type - Female, no husband present (%)
Poverty status for native-born residents (%)
Poverty status for foreign-born residents (%)
Poverty among high school graduates not in families (%)
Poverty among people who did not graduate high school not in families (%)
Residents with income below the poverty level (%) - White
Residents with income below the poverty level (%) - Black or African American
Residents with income below the poverty level (%) - Asian
Residents with income below the poverty level (%) - Hispanic or Latino
Residents with income below the poverty level (%) - American Indian and Alaska Native
Residents with income below the poverty level (%) - Multirace
Residents with income below the poverty level (%) - Other Race
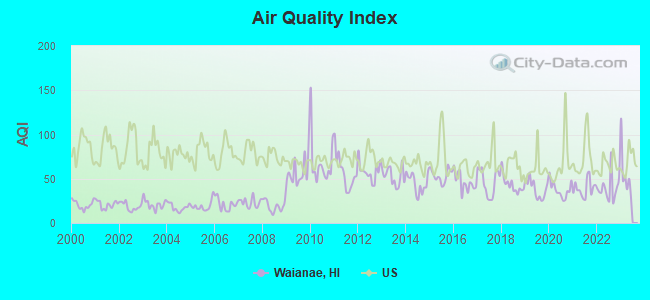
Air pollution - Air Quality Index (AQI)
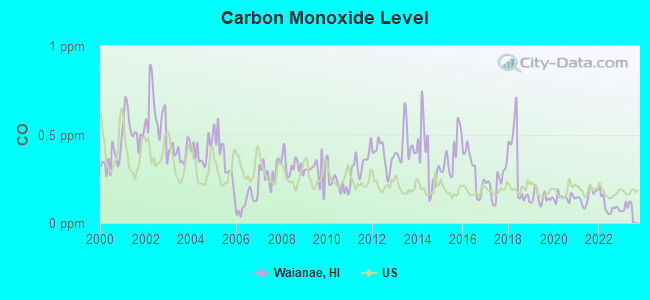
Air pollution - CO
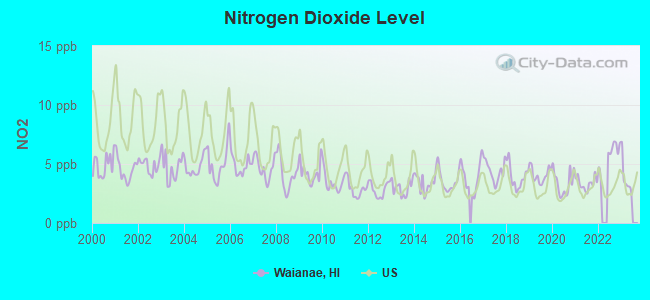
Air pollution - NO2
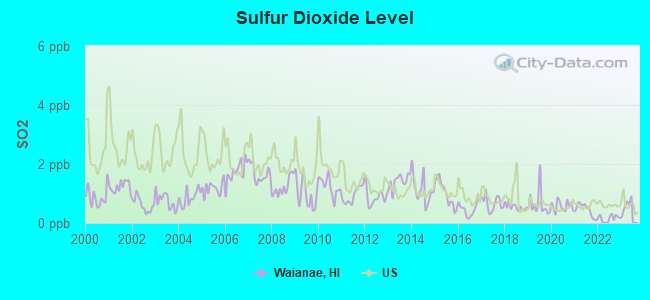
Air pollution - SO2
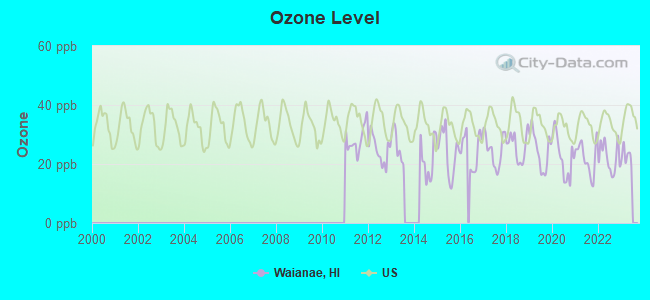
Air pollution - Ozone
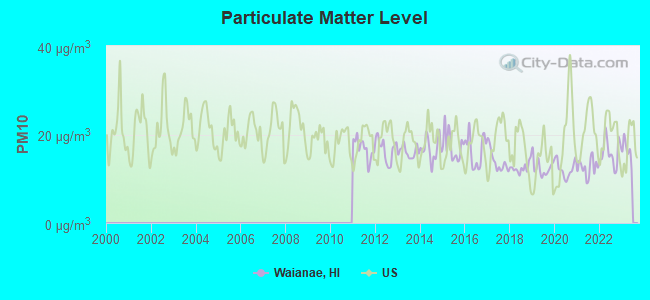
Air pollution - PM10
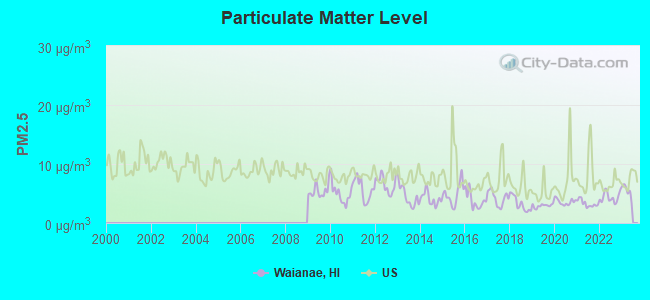
Air pollution - PM25
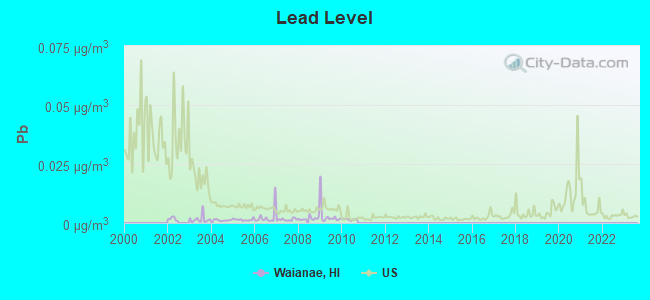
Air pollution - Pb
Crime - Murders per 100,000 population
Crime - Rapes per 100,000 population
Crime - Robberies per 100,000 population
Crime - Assaults per 100,000 population
Crime - Burglaries per 100,000 population
Crime - Thefts per 100,000 population
Crime - Auto thefts per 100,000 population
Crime - Arson per 100,000 population
Crime - City-data.com crime index
Crime - Violent crime index
Crime - Property crime index
Crime - Murders per 100,000 population (5 year average)
Crime - Rapes per 100,000 population (5 year average)
Crime - Robberies per 100,000 population (5 year average)
Crime - Assaults per 100,000 population (5 year average)
Crime - Burglaries per 100,000 population (5 year average)
Crime - Thefts per 100,000 population (5 year average)
Crime - Auto thefts per 100,000 population (5 year average)
Crime - Arson per 100,000 population (5 year average)
Crime - City-data.com crime index (5 year average)
Crime - Violent crime index (5 year average)
Crime - Property crime index (5 year average)
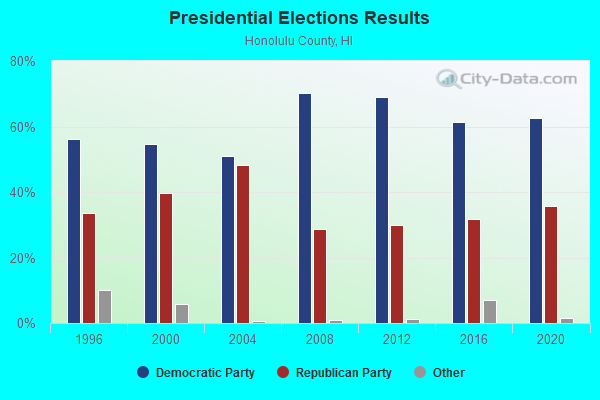
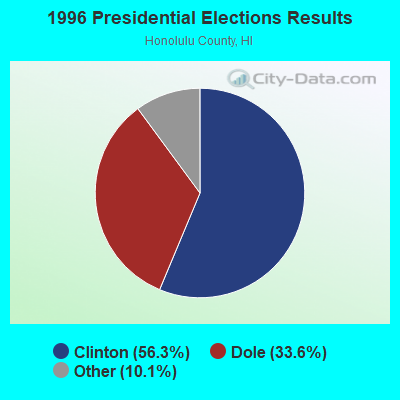
1996 Presidential Elections Results (%) - Democratic Party (Clinton)
1996 Presidential Elections Results (%) - Republican Party (Dole)
1996 Presidential Elections Results (%) - Other
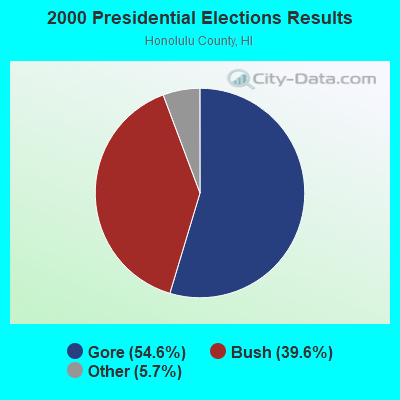
2000 Presidential Elections Results (%) - Democratic Party (Gore)
2000 Presidential Elections Results (%) - Republican Party (Bush)
2000 Presidential Elections Results (%) - Other
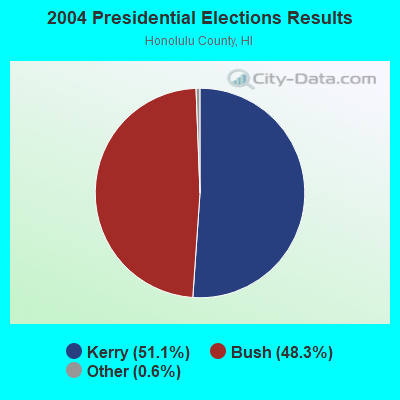
2004 Presidential Elections Results (%) - Democratic Party (Kerry)
2004 Presidential Elections Results (%) - Republican Party (Bush)
2004 Presidential Elections Results (%) - Other
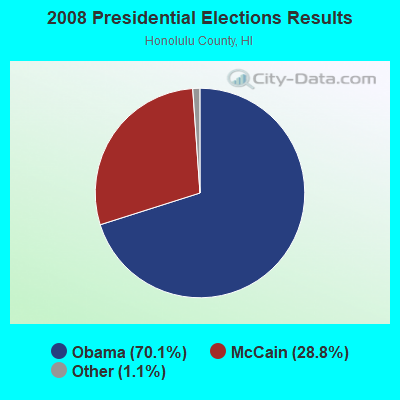
2008 Presidential Elections Results (%) - Democratic Party (Obama)
2008 Presidential Elections Results (%) - Republican Party (McCain)
2008 Presidential Elections Results (%) - Other
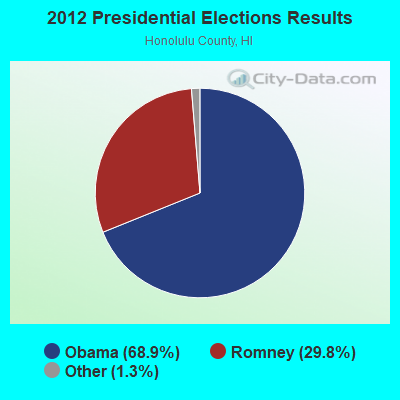
2012 Presidential Elections Results (%) - Democratic Party (Obama)
2012 Presidential Elections Results (%) - Republican Party (Romney)
2012 Presidential Elections Results (%) - Other
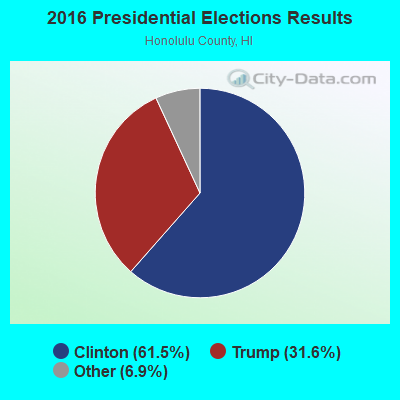
2016 Presidential Elections Results (%) - Democratic Party (Clinton)
2016 Presidential Elections Results (%) - Republican Party (Trump)
2016 Presidential Elections Results (%) - Other
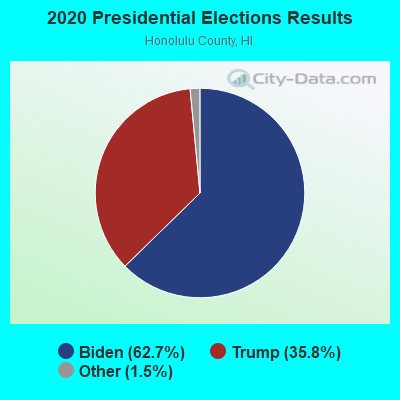
2020 Presidential Elections Results (%) - Democratic Party (Biden)
2020 Presidential Elections Results (%) - Republican Party (Trump)
2020 Presidential Elections Results (%) - Other
Ancestries Reported - Arab (%)
Ancestries Reported - Czech (%)
Ancestries Reported - Danish (%)
Ancestries Reported - Dutch (%)
Ancestries Reported - English (%)
Ancestries Reported - French (%)
Ancestries Reported - French Canadian (%)
Ancestries Reported - German (%)
Ancestries Reported - Greek (%)
Ancestries Reported - Hungarian (%)
Ancestries Reported - Irish (%)
Ancestries Reported - Italian (%)
Ancestries Reported - Lithuanian (%)
Ancestries Reported - Norwegian (%)
Ancestries Reported - Polish (%)
Ancestries Reported - Portuguese (%)
Ancestries Reported - Russian (%)
Ancestries Reported - Scotch-Irish (%)
Ancestries Reported - Scottish (%)
Ancestries Reported - Slovak (%)
Ancestries Reported - Subsaharan African (%)
Ancestries Reported - Swedish (%)
Ancestries Reported - Swiss (%)
Ancestries Reported - Ukrainian (%)
Ancestries Reported - United States (%)
Ancestries Reported - Welsh (%)
Ancestries Reported - West Indian (%)
Ancestries Reported - Other (%)
Educational Attainment - No schooling completed (%)
Educational Attainment - Less than high school (%)
Educational Attainment - High school or equivalent (%)
Educational Attainment - Less than 1 year of college (%)
Educational Attainment - 1 or more years of college (%)
Educational Attainment - Associate degree (%)
Educational Attainment - Bachelor's degree (%)
Educational Attainment - Master's degree (%)
Educational Attainment - Professional school degree (%)
Educational Attainment - Doctorate degree (%)
School Enrollment - Nursery, preschool (%)
School Enrollment - Kindergarten (%)
School Enrollment - Grade 1 to 4 (%)
School Enrollment - Grade 5 to 8 (%)
School Enrollment - Grade 9 to 12 (%)
School Enrollment - College undergrad (%)
School Enrollment - Graduate or professional (%)
School Enrollment - Not enrolled in school (%)
School enrollment - Public schools (%)
School enrollment - Private schools (%)
School enrollment - Not enrolled (%)
Median number of rooms in houses and condos
Median number of rooms in apartments
Housing units lacking complete plumbing facilities (%)
Housing units lacking complete kitchen facilities (%)
Density of houses
Urban houses (%)
Rural houses (%)
Households with people 60 years and over (%)
Households with people 65 years and over (%)
Households with people 75 years and over (%)
Households with one or more nonrelatives (%)
Households with no nonrelatives (%)
Population in households (%)
Family households (%)
Nonfamily households (%)
Population in families (%)
Family households with own children (%)
Median number of bedrooms in owner occupied houses
Mean number of bedrooms in owner occupied houses
Median number of bedrooms in renter occupied houses
Mean number of bedrooms in renter occupied houses
Median number of vehichles in owner occupied houses
Mean number of vehichles in owner occupied houses
Median number of vehichles in renter occupied houses
Mean number of vehichles in renter occupied houses
Mortgage status - with mortgage (%)
Mortgage status - with second mortgage (%)
Mortgage status - with home equity loan (%)
Mortgage status - with both second mortgage and home equity loan (%)
Mortgage status - without a mortgage (%)
Average family size
Average family size - White
Average family size - Black or African American
Average family size - Asian
Average family size - Hispanic or Latino
Average family size - American Indian and Alaska Native
Average family size - Multirace
Average family size - Other Race
Geographical mobility - Same house 1 year ago (%)
Geographical mobility - Moved within same county (%)
Geographical mobility - Moved from different county within same state (%)
Geographical mobility - Moved from different state (%)
Geographical mobility - Moved from abroad (%)
Place of birth - Born in state of residence (%)
Place of birth - Born in other state (%)
Place of birth - Native, outside of US (%)
Place of birth - Foreign born (%)
Housing units in structures - 1, detached (%)
Housing units in structures - 1, attached (%)
Housing units in structures - 2 (%)
Housing units in structures - 3 or 4 (%)
Housing units in structures - 5 to 9 (%)
Housing units in structures - 10 to 19 (%)
Housing units in structures - 20 to 49 (%)
Housing units in structures - 50 or more (%)
Housing units in structures - Mobile home (%)
Housing units in structures - Boat, RV, van, etc. (%)
House/condo owner moved in on average (years ago)
Renter moved in on average (years ago)
Year householder moved into unit - Moved in 1999 to March 2000 (%)
Year householder moved into unit - Moved in 1995 to 1998 (%)
Year householder moved into unit - Moved in 1990 to 1994 (%)
Year householder moved into unit - Moved in 1980 to 1989 (%)
Year householder moved into unit - Moved in 1970 to 1979 (%)
Year householder moved into unit - Moved in 1969 or earlier (%)
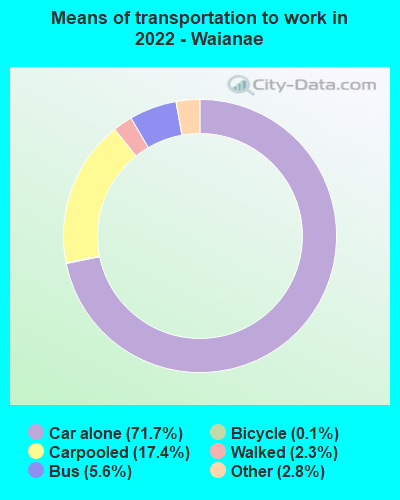
Means of transportation to work - Drove car alone (%)
Means of transportation to work - Carpooled (%)
Means of transportation to work - Public transportation (%)
Means of transportation to work - Bus or trolley bus (%)
Means of transportation to work - Streetcar or trolley car (%)
Means of transportation to work - Subway or elevated (%)
Means of transportation to work - Railroad (%)
Means of transportation to work - Ferryboat (%)
Means of transportation to work - Taxicab (%)
Means of transportation to work - Motorcycle (%)
Means of transportation to work - Bicycle (%)
Means of transportation to work - Walked (%)
Means of transportation to work - Other means (%)
Working at home (%)
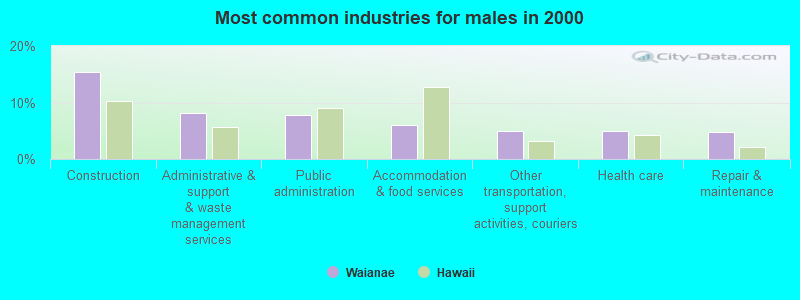
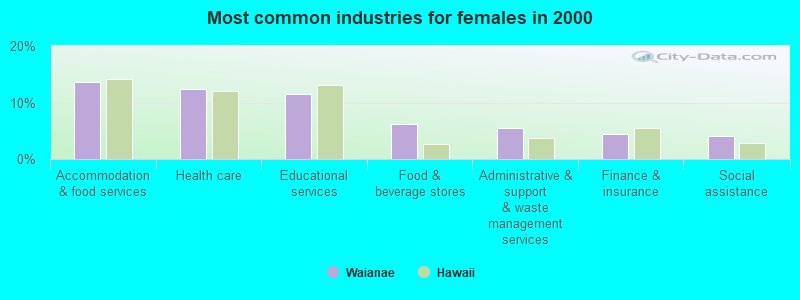
Industry diversity
Most Common Industries - Agriculture, forestry, fishing and hunting, and mining (%)
Most Common Industries - Agriculture, forestry, fishing and hunting (%)
Most Common Industries - Mining, quarrying, and oil and gas extraction (%)
Most Common Industries - Construction (%)
Most Common Industries - Manufacturing (%)
Most Common Industries - Wholesale trade (%)
Most Common Industries - Retail trade (%)
Most Common Industries - Transportation and warehousing, and utilities (%)
Most Common Industries - Transportation and warehousing (%)
Most Common Industries - Utilities (%)
Most Common Industries - Information (%)
Most Common Industries - Finance and insurance, and real estate and rental and leasing (%)
Most Common Industries - Finance and insurance (%)
Most Common Industries - Real estate and rental and leasing (%)
Most Common Industries - Professional, scientific, and management, and administrative and waste management services (%)
Most Common Industries - Professional, scientific, and technical services (%)
Most Common Industries - Management of companies and enterprises (%)
Most Common Industries - Administrative and support and waste management services (%)
Most Common Industries - Educational services, and health care and social assistance (%)
Most Common Industries - Educational services (%)
Most Common Industries - Health care and social assistance (%)
Most Common Industries - Arts, entertainment, and recreation, and accommodation and food services (%)
Most Common Industries - Arts, entertainment, and recreation (%)
Most Common Industries - Accommodation and food services (%)
Most Common Industries - Other services, except public administration (%)
Most Common Industries - Public administration (%)
Occupation diversity
Most Common Occupations - Management, business, science, and arts occupations (%)
Most Common Occupations - Management, business, and financial occupations (%)
Most Common Occupations - Management occupations (%)
Most Common Occupations - Business and financial operations occupations (%)
Most Common Occupations - Computer, engineering, and science occupations (%)
Most Common Occupations - Computer and mathematical occupations (%)
Most Common Occupations - Architecture and engineering occupations (%)
Most Common Occupations - Life, physical, and social science occupations (%)
Most Common Occupations - Education, legal, community service, arts, and media occupations (%)
Most Common Occupations - Community and social service occupations (%)
Most Common Occupations - Legal occupations (%)
Most Common Occupations - Education, training, and library occupations (%)
Most Common Occupations - Arts, design, entertainment, sports, and media occupations (%)
Most Common Occupations - Healthcare practitioners and technical occupations (%)
Most Common Occupations - Health diagnosing and treating practitioners and other technical occupations (%)
Most Common Occupations - Health technologists and technicians (%)
Most Common Occupations - Service occupations (%)
Most Common Occupations - Healthcare support occupations (%)
Most Common Occupations - Protective service occupations (%)
Most Common Occupations - Fire fighting and prevention, and other protective service workers including supervisors (%)
Most Common Occupations - Law enforcement workers including supervisors (%)
Most Common Occupations - Food preparation and serving related occupations (%)
Most Common Occupations - Building and grounds cleaning and maintenance occupations (%)
Most Common Occupations - Personal care and service occupations (%)
Most Common Occupations - Sales and office occupations (%)
Most Common Occupations - Sales and related occupations (%)
Most Common Occupations - Office and administrative support occupations (%)
Most Common Occupations - Natural resources, construction, and maintenance occupations (%)
Most Common Occupations - Farming, fishing, and forestry occupations (%)
Most Common Occupations - Construction and extraction occupations (%)
Most Common Occupations - Installation, maintenance, and repair occupations (%)
Most Common Occupations - Production, transportation, and material moving occupations (%)
Most Common Occupations - Production occupations (%)
Most Common Occupations - Transportation occupations (%)
Most Common Occupations - Material moving occupations (%)
People in Group quarters - Institutionalized population (%)
People in Group quarters - Correctional institutions (%)
People in Group quarters - Federal prisons and detention centers (%)
People in Group quarters - Halfway houses (%)
People in Group quarters - Local jails and other confinement facilities (including police lockups) (%)
People in Group quarters - Military disciplinary barracks (%)
People in Group quarters - State prisons (%)
People in Group quarters - Other types of correctional institutions (%)
People in Group quarters - Nursing homes (%)
People in Group quarters - Hospitals/wards, hospices, and schools for the handicapped (%)
People in Group quarters - Hospitals/wards and hospices for chronically ill (%)
People in Group quarters - Hospices or homes for chronically ill (%)
People in Group quarters - Military hospitals or wards for chronically ill (%)
People in Group quarters - Other hospitals or wards for chronically ill (%)
People in Group quarters - Hospitals or wards for drug/alcohol abuse (%)
People in Group quarters - Mental (Psychiatric) hospitals or wards (%)
People in Group quarters - Schools, hospitals, or wards for the mentally retarded (%)
People in Group quarters - Schools, hospitals, or wards for the physically handicapped (%)
People in Group quarters - Institutions for the deaf (%)
People in Group quarters - Institutions for the blind (%)
People in Group quarters - Orthopedic wards and institutions for the physically handicapped (%)
People in Group quarters - Wards in general hospitals for patients who have no usual home elsewhere (%)
People in Group quarters - Wards in military hospitals for patients who have no usual home elsewhere (%)
People in Group quarters - Juvenile institutions (%)
People in Group quarters - Long-term care (%)
People in Group quarters - Homes for abused, dependent, and neglected children (%)
People in Group quarters - Residential treatment centers for emotionally disturbed children (%)
People in Group quarters - Training schools for juvenile delinquents (%)
People in Group quarters - Short-term care, detention or diagnostic centers for delinquent children (%)
People in Group quarters - Type of juvenile institution unknown (%)
People in Group quarters - Noninstitutionalized population (%)
People in Group quarters - College dormitories (includes college quarters off campus) (%)
People in Group quarters - Military quarters (%)
People in Group quarters - On base (%)
People in Group quarters - Barracks, unaccompanied personnel housing (UPH), (Enlisted/Officer), ;and similar group living quarters for military personnel (%)
People in Group quarters - Transient quarters for temporary residents (%)
People in Group quarters - Military ships (%)
People in Group quarters - Group homes (%)
People in Group quarters - Homes or halfway houses for drug/alcohol abuse (%)
People in Group quarters - Homes for the mentally ill (%)
People in Group quarters - Homes for the mentally retarded (%)
People in Group quarters - Homes for the physically handicapped (%)
People in Group quarters - Other group homes (%)
People in Group quarters - Religious group quarters (%)
People in Group quarters - Dormitories (%)
People in Group quarters - Agriculture workers' dormitories on farms (%)
People in Group quarters - Job Corps and vocational training facilities (%)
People in Group quarters - Other workers' dormitories (%)
People in Group quarters - Crews of maritime vessels (%)
People in Group quarters - Other nonhousehold living situations (%)
People in Group quarters - Other noninstitutional group quarters (%)
Residents speaking English at home (%)
Residents speaking English at home - Born in the United States (%)
Residents speaking English at home - Native, born elsewhere (%)
Residents speaking English at home - Foreign born (%)
Residents speaking Spanish at home (%)
Residents speaking Spanish at home - Born in the United States (%)
Residents speaking Spanish at home - Native, born elsewhere (%)
Residents speaking Spanish at home - Foreign born (%)
Residents speaking other language at home (%)
Residents speaking other language at home - Born in the United States (%)
Residents speaking other language at home - Native, born elsewhere (%)
Residents speaking other language at home - Foreign born (%)
Class of Workers - Employee of private company (%)
Class of Workers - Self-employed in own incorporated business (%)
Class of Workers - Private not-for-profit wage and salary workers (%)
Class of Workers - Local government workers (%)
Class of Workers - State government workers (%)
Class of Workers - Federal government workers (%)
Class of Workers - Self-employed workers in own not incorporated business and Unpaid family workers (%)
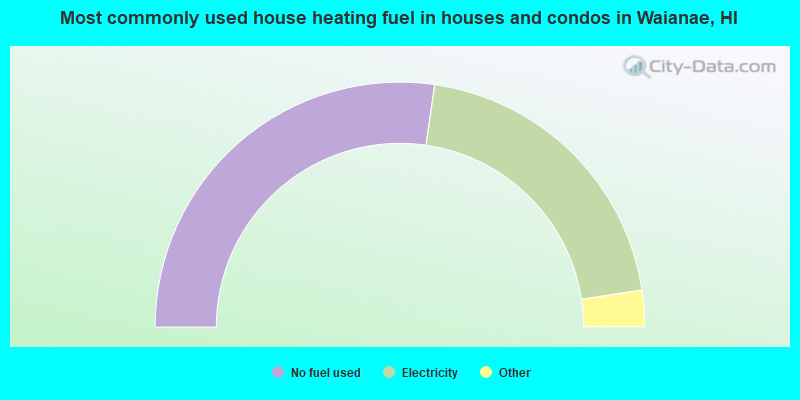
House heating fuel used in houses and condos - Utility gas (%)
House heating fuel used in houses and condos - Bottled, tank, or LP gas (%)
House heating fuel used in houses and condos - Electricity (%)
House heating fuel used in houses and condos - Fuel oil, kerosene, etc. (%)
House heating fuel used in houses and condos - Coal or coke (%)
House heating fuel used in houses and condos - Wood (%)
House heating fuel used in houses and condos - Solar energy (%)
House heating fuel used in houses and condos - Other fuel (%)
House heating fuel used in houses and condos - No fuel used (%)
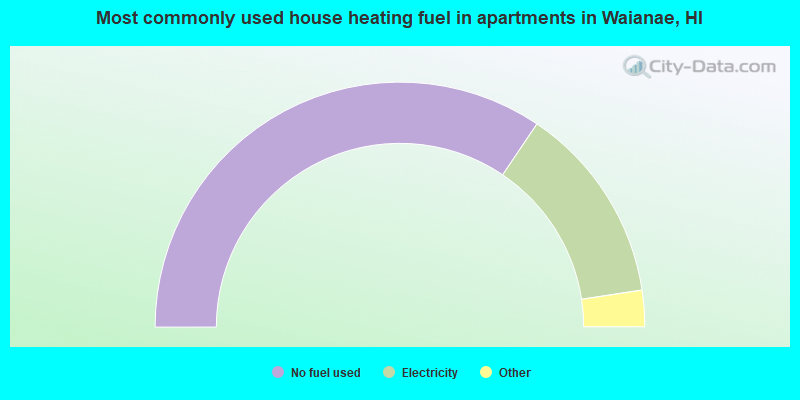
House heating fuel used in apartments - Utility gas (%)
House heating fuel used in apartments - Bottled, tank, or LP gas (%)
House heating fuel used in apartments - Electricity (%)
House heating fuel used in apartments - Fuel oil, kerosene, etc. (%)
House heating fuel used in apartments - Coal or coke (%)
House heating fuel used in apartments - Wood (%)
House heating fuel used in apartments - Solar energy (%)
House heating fuel used in apartments - Other fuel (%)
House heating fuel used in apartments - No fuel used (%)
Armed forces status - In Armed Forces (%)
Armed forces status - Civilian (%)
Armed forces status - Civilian - Veteran (%)
Armed forces status - Civilian - Nonveteran (%)
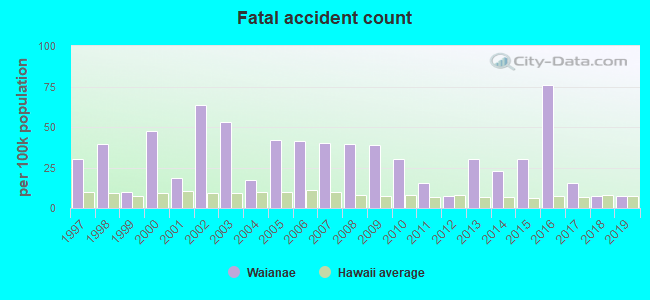
Fatal accidents locations in years 2005-2021
Fatal accidents locations in 2005
Fatal accidents locations in 2006
Fatal accidents locations in 2007
Fatal accidents locations in 2008
Fatal accidents locations in 2009
Fatal accidents locations in 2010
Fatal accidents locations in 2011
Fatal accidents locations in 2012
Fatal accidents locations in 2013
Fatal accidents locations in 2014
Fatal accidents locations in 2015
Fatal accidents locations in 2016
Fatal accidents locations in 2017
Fatal accidents locations in 2018
Fatal accidents locations in 2019
Fatal accidents locations in 2020
Fatal accidents locations in 2021
Alcohol use - People drinking some alcohol every month (%)
Alcohol use - People not drinking at all (%)
Alcohol use - Average days/month drinking alcohol
Alcohol use - Average drinks/week
Alcohol use - Average days/year people drink much
Audiometry - Average condition of hearing (%)
Audiometry - People that can hear a whisper from across a quiet room (%)
Audiometry - People that can hear normal voice from across a quiet room (%)
Audiometry - Ears ringing, roaring, buzzing (%)
Audiometry - Had a job exposure to loud noise (%)
Audiometry - Had off-work exposure to loud noise (%)
Blood Pressure & Cholesterol - Has high blood pressure (%)
Blood Pressure & Cholesterol - Checking blood pressure at home (%)
Blood Pressure & Cholesterol - Frequently checking blood cholesterol (%)
Blood Pressure & Cholesterol - Has high cholesterol level (%)
Consumer Behavior - Money monthly spent on food at supermarket/grocery store
Consumer Behavior - Money monthly spent on food at other stores
Consumer Behavior - Money monthly spent on eating out
Consumer Behavior - Money monthly spent on carryout/delivered foods
Consumer Behavior - Income spent on food at supermarket/grocery store (%)
Consumer Behavior - Income spent on food at other stores (%)
Consumer Behavior - Income spent on eating out (%)
Consumer Behavior - Income spent on carryout/delivered foods (%)
Current Health Status - General health condition (%)
Current Health Status - Blood donors (%)
Current Health Status - Has blood ever tested for HIV virus (%)
Current Health Status - Left-handed people (%)
Dermatology - People using sunscreen (%)
Diabetes - Diabetics (%)
Diabetes - Had a blood test for high blood sugar (%)
Diabetes - People taking insulin (%)
Diet Behavior & Nutrition - Diet health (%)
Diet Behavior & Nutrition - Milk product consumption (# of products/month)
Diet Behavior & Nutrition - Meals not home prepared (#/week)
Diet Behavior & Nutrition - Meals from fast food or pizza place (#/week)
Diet Behavior & Nutrition - Ready-to-eat foods (#/month)
Diet Behavior & Nutrition - Frozen meals/pizza (#/month)
Drug Use - People that ever used marijuana or hashish (%)
Drug Use - Ever used hard drugs (%)
Drug Use - Ever used any form of cocaine (%)
Drug Use - Ever used heroin (%)
Drug Use - Ever used methamphetamine (%)
Health Insurance - People covered by health insurance (%)
Kidney Conditions-Urology - Avg. # of times urinating at night
Medical Conditions - People with asthma (%)
Medical Conditions - People with anemia (%)
Medical Conditions - People with psoriasis (%)
Medical Conditions - People with overweight (%)
Medical Conditions - Elderly people having difficulties in thinking or remembering (%)
Medical Conditions - People who ever received blood transfusion (%)
Medical Conditions - People having trouble seeing even with glass/contacts (%)
Medical Conditions - People with arthritis (%)
Medical Conditions - People with gout (%)
Medical Conditions - People with congestive heart failure (%)
Medical Conditions - People with coronary heart disease (%)
Medical Conditions - People with angina pectoris (%)
Medical Conditions - People who ever had heart attack (%)
Medical Conditions - People who ever had stroke (%)
Medical Conditions - People with emphysema (%)
Medical Conditions - People with thyroid problem (%)
Medical Conditions - People with chronic bronchitis (%)
Medical Conditions - People with any liver condition (%)
Medical Conditions - People who ever had cancer or malignancy (%)
Mental Health - People who have little interest in doing things (%)
Mental Health - People feeling down, depressed, or hopeless (%)
Mental Health - People who have trouble sleeping or sleeping too much (%)
Mental Health - People feeling tired or having little energy (%)
Mental Health - People with poor appetite or overeating (%)
Mental Health - People feeling bad about themself (%)
Mental Health - People who have trouble concentrating on things (%)
Mental Health - People moving or speaking slowly or too fast (%)
Mental Health - People having thoughts they would be better off dead (%)
Oral Health - Average years since last visit a dentist
Oral Health - People embarrassed because of mouth (%)
Oral Health - People with gum disease (%)
Oral Health - General health of teeth and gums (%)
Oral Health - Average days a week using dental floss/device
Oral Health - Average days a week using mouthwash for dental problem
Oral Health - Average number of teeth
Pesticide Use - Households using pesticides to control insects (%)
Pesticide Use - Households using pesticides to kill weeds (%)
Physical Activity - People doing vigorous-intensity work activities (%)
Physical Activity - People doing moderate-intensity work activities (%)
Physical Activity - People walking or bicycling (%)
Physical Activity - People doing vigorous-intensity recreational activities (%)
Physical Activity - People doing moderate-intensity recreational activities (%)
Physical Activity - Average hours a day doing sedentary activities
Physical Activity - Average hours a day watching TV or videos
Physical Activity - Average hours a day using computer
Physical Functioning - People having limitations keeping them from working (%)
Physical Functioning - People limited in amount of work they can do (%)
Physical Functioning - People that need special equipment to walk (%)
Physical Functioning - People experiencing confusion/memory problems (%)
Physical Functioning - People requiring special healthcare equipment (%)
Prescription Medications - Average number of prescription medicines taking
Preventive Aspirin Use - Adults 40+ taking low-dose aspirin (%)
Reproductive Health - Vaginal deliveries (%)
Reproductive Health - Cesarean deliveries (%)
Reproductive Health - Deliveries resulted in a live birth (%)
Reproductive Health - Pregnancies resulted in a delivery (%)
Reproductive Health - Women breastfeeding newborns (%)
Reproductive Health - Women that had a hysterectomy (%)
Reproductive Health - Women that had both ovaries removed (%)
Reproductive Health - Women that have ever taken birth control pills (%)
Reproductive Health - Women taking birth control pills (%)
Reproductive Health - Women that have ever used Depo-Provera or injectables (%)
Reproductive Health - Women that have ever used female hormones (%)
Sexual Behavior - People 18+ that ever had sex (vaginal, anal, or oral) (%)
Sexual Behavior - Males 18+ that ever had vaginal sex with a woman (%)
Sexual Behavior - Males 18+ that ever performed oral sex on a woman (%)
Sexual Behavior - Males 18+ that ever had anal sex with a woman (%)
Sexual Behavior - Males 18+ that ever had any sex with a man (%)
Sexual Behavior - Females 18+ that ever had vaginal sex with a man (%)
Sexual Behavior - Females 18+ that ever performed oral sex on a man (%)
Sexual Behavior - Females 18+ that ever had anal sex with a man (%)
Sexual Behavior - Females 18+ that ever had any kind of sex with a woman (%)
Sexual Behavior - Average age people first had sex
Sexual Behavior - Average number of female sex partners in lifetime (males 18+)
Sexual Behavior - Average number of female vaginal sex partners in lifetime (males 18+)
Sexual Behavior - Average age people first performed oral sex on a woman (18+)
Sexual Behavior - Average number of woman performed oral sex on in lifetime (18+)
Sexual Behavior - Average number of male sex partners in lifetime (males 18+)
Sexual Behavior - Average number of male anal sex partners in lifetime (males 18+)
Sexual Behavior - Average age people first performed oral sex on a man (18+)
Sexual Behavior - Average number of male oral sex partners in lifetime (18+)
Sexual Behavior - People using protection when performing oral sex (%)
Sexual Behavior - Average number of times people have vaginal or anal sex a year
Sexual Behavior - People having sex without condom (%)
Sexual Behavior - Average number of male sex partners in lifetime (females 18+)
Sexual Behavior - Average number of male vaginal sex partners in lifetime (females 18+)
Sexual Behavior - Average number of female sex partners in lifetime (females 18+)
Sexual Behavior - Circumcised males 18+ (%)
Sleep Disorders - Average hours sleeping at night
Sleep Disorders - People that has trouble sleeping (%)
Smoking-Cigarette Use - People smoking cigarettes (%)
Taste & Smell - People 40+ having problems with smell (%)
Taste & Smell - People 40+ having problems with taste (%)
Taste & Smell - People 40+ that ever had wisdom teeth removed (%)
Taste & Smell - People 40+ that ever had tonsils teeth removed (%)
Taste & Smell - People 40+ that ever had a loss of consciousness because of a head injury (%)
Taste & Smell - People 40+ that ever had a broken nose or other serious injury to face or skull (%)
Taste & Smell - People 40+ that ever had two or more sinus infections (%)
Weight - Average height (inches)
Weight - Average weight (pounds)
Weight - Average BMI
Weight - People that are obese (%)
Weight - People that ever were obese (%)
Weight - People trying to lose weight (%)
Latest news from Waianae, HI collected exclusively by city-data.com from local newspapers, TV, and radio stations
Ancestries: Portuguese (1.6%).
Current Local Time:
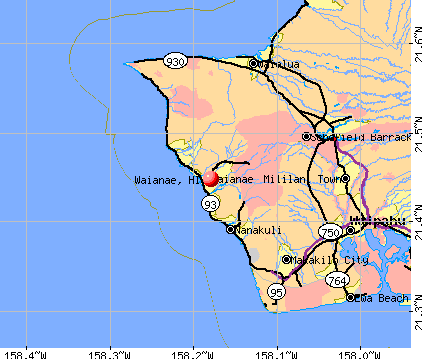
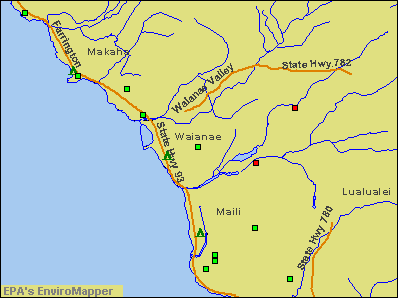
Land area: 3.40 square miles.
Population density: 3,871 people per square mile (average).
896 residents are foreign born (3.3% Asia , 2.8% Oceania ).
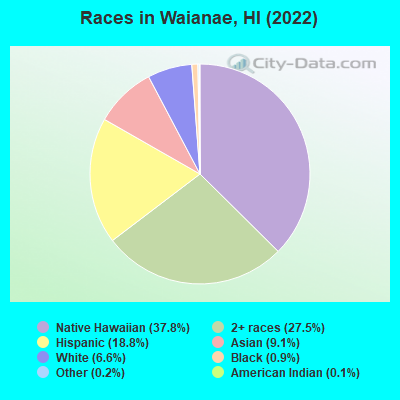
This place:
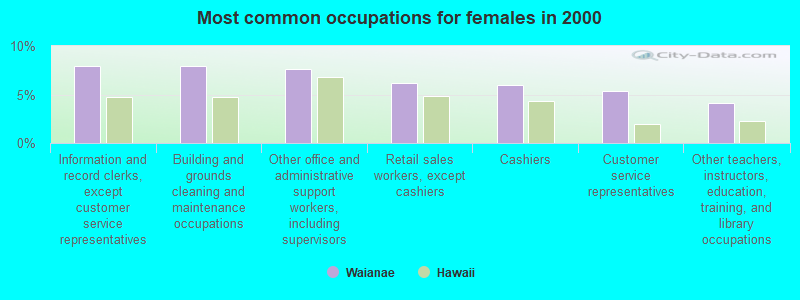
6.6%Hawaii:
18.0%
Median real estate property taxes paid for housing units with mortgages in 2022: $1,186 (0.2%)Median real estate property taxes paid for housing units with no mortgage in 2022: $788 (0.2%)
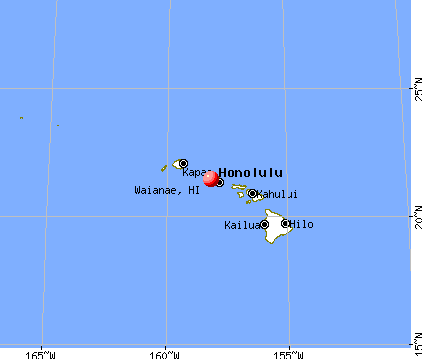
Nearest city with pop. 50,000+: Ewa, HI
Nearest city with pop. 1,000,000+: Los Angeles, CA
Nearest cities:
Latitude: 21.45 N, Longitude: 158.18 W
Daytime population change due to commuting: -1,958 (-14.4%)Workers who live and work in this place: 926 (17.9%)
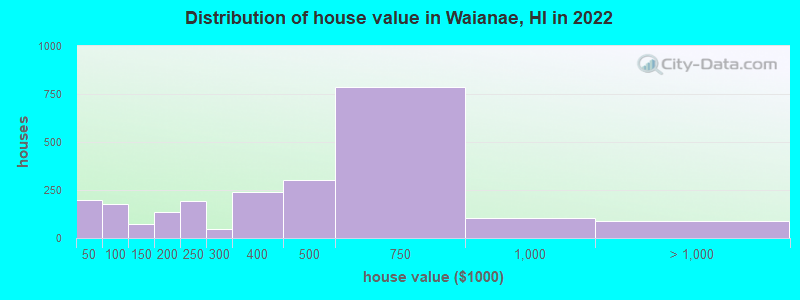
Property values in Waianae, HI
Waianae tourist attractions:
Unemployment in December 2023:
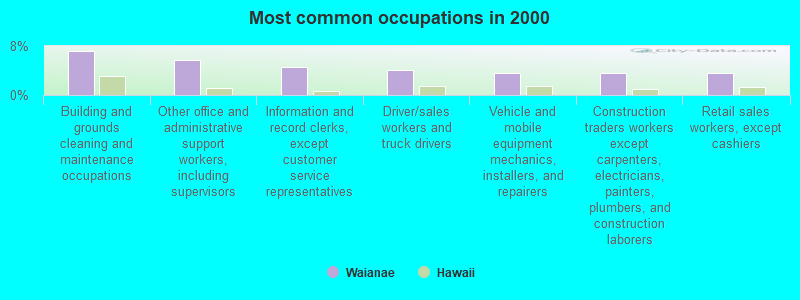
Most common occupations in Waianae, HI (%)
Both Males Females
Building and grounds cleaning and maintenance occupations (7.2%)
Other office and administrative support workers, including supervisors (5.6%)
Information and record clerks, except customer service representatives (4.5%)
Driver/sales workers and truck drivers (4.1%)
Vehicle and mobile equipment mechanics, installers, and repairers (3.6%)
Construction traders workers except carpenters, electricians, painters, plumbers, and construction laborers (3.6%)
Retail sales workers, except cashiers (3.6%)
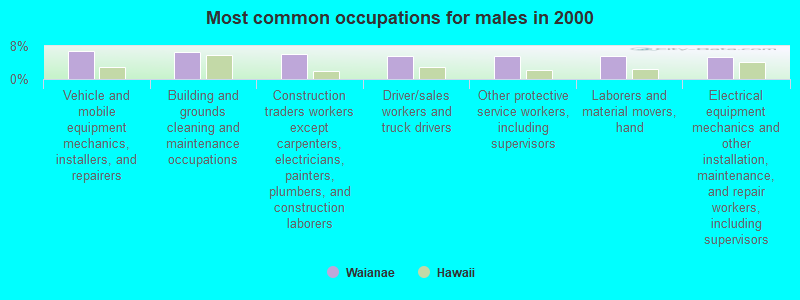
Vehicle and mobile equipment mechanics, installers, and repairers (6.9%)
Building and grounds cleaning and maintenance occupations (6.5%)
Construction traders workers except carpenters, electricians, painters, plumbers, and construction laborers (6.0%)
Driver/sales workers and truck drivers (5.6%)
Other protective service workers, including supervisors (5.5%)
Laborers and material movers, hand (5.5%)
Electrical equipment mechanics and other installation, maintenance, and repair workers, including supervisors (5.2%)
Information and record clerks, except customer service representatives (8.0%)
Building and grounds cleaning and maintenance occupations (7.9%)
Other office and administrative support workers, including supervisors (7.6%)
Retail sales workers, except cashiers (6.2%)
Cashiers (6.0%)
Customer service representatives (5.4%)
Other teachers, instructors, education, training, and library occupations (4.1%)
Earthquake activity:
Waianae-area historical earthquake activity is significantly above Hawaii state average. It is 1024% greater than the overall U.S. average. On 11/29/1975 at 14:47:40, a magnitude 7.2 (6.0 MB, 7.1 MS, 7.2 UK, 7.2 MS, Class: Major, Intensity: VIII - XII) earthquake occurred 246.2 miles away from the city center, causing 2 deaths ( 2 shaking deaths) On 8/21/1951 at 10:57:00, a magnitude 6.9 (6.9 UK, Class: Strong, Intensity: VII - IX) earthquake occurred 183.6 miles away from Waianae center On 10/15/2006 at 17:07:49, a magnitude 6.7 (6.2 MB, 6.6 MS, 6.7 MW) earthquake occurred 179.3 miles away from Waianae center On 10/15/2006 at 17:07:49, a magnitude 6.7 (6.7 MD, Depth: 23.7 mi) earthquake occurred 181.4 miles away from Waianae center On 5/4/2018 at 22:32:54, a magnitude 6.9 (6.9 MW, Depth: 3.6 mi) earthquake occurred 253.3 miles away from Waianae center On 11/16/1983 at 16:13:00, a magnitude 6.7 (6.4 MB, 6.7 MS, 6.7 MW) earthquake occurred 228.7 miles away from Waianae center, causing $6,000,000 total damage Magnitude types: body-wave magnitude (MB), duration magnitude (MD), surface-wave magnitude (MS), moment magnitude (MW) Natural disasters: The number of natural disasters in Honolulu County (16) is near the US average (15).Major Disasters (Presidential) Declared: 10Emergencies Declared: 1Floods: 7, Storms: 7, Fires: 3, Mudslides: 3, Landslides: 2, Earthquake: 1, Flash Flood: 1, Heavy Rain: 1, Hurricane: 1, Tsunami Wave: 1, Typhoon: 1, Other: 1 (Note: some incidents may be assigned to more than one category). Hospitals and medical centers in Waianae: LEEWARD INTEGRATED HEALTH SERVICES (84-390 JADE STREET)
WAIANAE DIALYSIS (86-080 FARRINGTON HIGHWAY SUITE 101)
Other hospitals and medical centers near Waianae: FMC DIALYSIS SERVICES OF KAPOLEI (Dialysis Facility, about 8 miles away; KAPOLEI, HI)
WAHIAWA GENERAL HOSPITAL (Nursing Home, about 11 miles away; WAHIAWA, HI)
WAHIAWA GEN HOSP ICF (Nursing Home, about 11 miles away; WHIAWA, HI)
FMC WAHIAWA DIALYSIS CENTER (Dialysis Facility, about 11 miles away; WAHIAWA, HI)
WAHIAWA GENERAL HOSPITAL HHA (Home Health Center, about 11 miles away; WAHIAWA, HI)
KAHI MOHALA (Hospital, about 12 miles away; EWA BEACH, HI)
PEARL CITY NURSING HOME (Nursing Home, about 14 miles away; PEARL CITY, HI)
Colleges/universities with over 2000 students nearest to Waianae:
Leeward Community College (about 14 miles; Pearl City, HI ; Full-time enrollment: 4,589)
Brigham Young University-Hawaii (about 22 miles; Laie, HI ; FT enrollment: 3,527)
Honolulu Community College (about 22 miles; Honolulu, HI ; FT enrollment: 2,538)
Hawaii Pacific University (about 23 miles; Honolulu, HI ; FT enrollment: 5,506)
University of Hawaii at Manoa (about 26 miles; Honolulu, HI ; FT enrollment: 16,461)
Chaminade University of Honolulu (about 27 miles; Honolulu, HI ; FT enrollment: 2,610)
Kapiolani Community College (about 28 miles; Honolulu, HI ; FT enrollment: 5,069)
Public high schools in Waianae:
Private high school in Waianae: MAILI BIBLE SCHOOL Students: 80, Location: 87-138 GILIPAKE ST, Grades: PK-12)
Public elementary/middle schools in Waianae: NANAIKAPONO ELEMENTARY SCHOOL Students: 882, Location: 89-153 MANO AVE, Grades: PK-6)WAIANAE INTERMEDIATE SCHOOL Students: 875, Location: 85-626 FARRINGTON HWY, Grades: 7-8)LEIHOKU ELEMENTARY SCHOOL Students: 853, Location: 86-285 LEIHOKU ST, Grades: PK-6)MAILI ELEMENTARY SCHOOL Students: 772, Location: 87-360 KULAAUPUNI ST, Grades: PK-6)WAIANAE ELEMENTARY SCHOOL Students: 583, Location: 85-220 MCARTHUR ST, Grades: PK-6)MAKAHA ELEMENTARY SCHOOL Students: 580, Location: 84-200 ALA NAAUAO PL, Grades: PK-6)NANAKULI ELEMENTARY SCHOOL Students: 485, Location: 89-778 HALEAKALA AVE, Grades: PK-6)KA WAIHONA O KA NAAUAO - NEW CENTURY PCS Location: 89-195 FARRINGTON HWY, Grades: KG-8, Charter school )
Private elementary/middle school in Waianae: ADVENTIST MALAMA ELEMENTARY SCHOOL Students: 58, Location: 86-072 FARRINGTON HWY, Grades: KG-8)
See full list of schools located in Waianae
Notable locations in Waianae: (A) , Honolulu Fire Department Station 26 Waianae (B) , Emergency Medical Services Unit Waianae (C) . Display/hide their locations on the map
Shopping Center: (1) . Display/hide its location on the map
Churches in Waianae include: (A) , Waianae Seventh Day Adventist Church (B) , Waianae Protestant Church (C) , Waianae Pentecostal Faith Church (D) , Waianae Hongwanji Mission (E) , Sacred Heart Church (F) . Display/hide their locations on the map
Cemeteries: (1) , Waianae Protestant Cemetery (2) . Display/hide their locations on the map
Streams, rivers, and creeks: (A) . Display/hide its location on the map
Parks in Waianae include: (1) , Waianae Regional Park (2) , Kaupuni Neighborhood Park (3) , Pililaau Community Park (4) . Display/hide their locations on the map
Beaches: (A) , Nene‘u Beach (B) . Display/hide their locations on the map
Tourist attraction:
Court:
Birthplace of: Max Holloway - Martial artist.
Honolulu County has a predicted average indoor radon screening level less than 2 pCi/L (pico curies per liter) - Low Potential Average household size: This place:
4.2 peopleHawaii:
2.9 people
Percentage of family households: This place:
84.7%Whole state:
68.9%
Percentage of households with unmarried partners: This place:
10.3%Whole state:
7.3%
Likely homosexual households (counted as self-reported same-sex unmarried-partner households)
Lesbian couples: 0.8% of all households Gay men: 0.6% of all households
People in group quarters in Waianae in 2010:
419 people in emergency and transitional shelters (with sleeping facilities) for people experiencing homelessness
62 people in other noninstitutional facilities
15 people in group homes intended for adults
6 people in workers' group living quarters and job corps centers
People in group quarters in Waianae in 2000:
11 people in other group homes
11 people in religious group quarters
6 people in other workers' dormitories
5 people in other nonhousehold living situations
Banks with branches in Waianae (2011 data):
American Savings Bank, FSB: Nanakuli Branch at 87-2070 Farrington Hwy, branch established on 1993/11/06; Waianae Branch at 86-120 Farrington Highway, branch established on 1992/08/01. Info updated 2012/01/09: Bank assets: $4,910.1 mil, Deposits: $4,107.0 mil, headquarters in Honolulu, HI, positive income , Mortgage Lending Specialization, 57 total offices
Bank of Hawaii: Waianae Branch at 86-120 Farrington Highway, branch established on 1953/03/09. Info updated 2010/09/12: Bank assets: $13,868.5 mil, Deposits: $10,599.9 mil, headquarters in Honolulu, HI, positive income , Mortgage Lending Specialization, 71 total offices , Holding Company: Bank Of Hawaii Corporation
First Hawaiian Bank: Waianae Branch at 86-020 Farrington Highway, branch established on 1962/08/20. Info updated 2012/02/02: Bank assets: $15,830.2 mil, Deposits: $12,165.6 mil, headquarters in Honolulu, HI, positive income , 59 total offices , Holding Company: Bnp Paribas
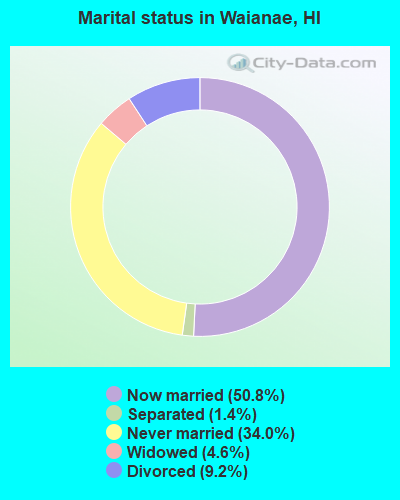
For population 15 years and over in Waianae:
Never married: 34.0%Now married: 50.8%Separated: 1.4%Widowed: 4.6%Divorced: 9.2% For population 25 years and over in Waianae:
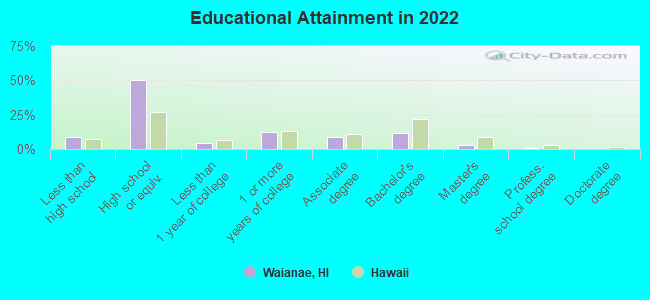
High school or higher: 90.1%Bachelor's degree or higher: 14.7%Graduate or professional degree: 3.2%Unemployed: 13.4%Mean travel time to work (commute): 40.7 minutes
Education Gini index (Inequality in education) Here:
8.6Hawaii average:
11.2
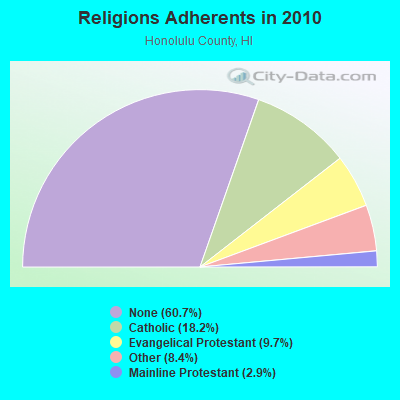
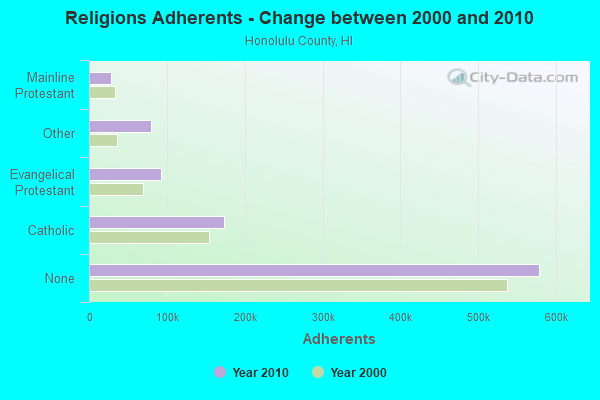
Religion statistics for Waianae, HI (based on Honolulu County data)
Religion Adherents Congregations Catholic 173,716 39 Evangelical Protestant 92,310 382 Other 80,221 204 Mainline Protestant 28,013 115 Orthodox 300 4 None 578,647 -
Source: Clifford Grammich, Kirk Hadaway, Richard Houseal, Dale E.Jones, Alexei Krindatch, Richie Stanley and Richard H.Taylor. 2012. 2010 U.S.Religion Census: Religious Congregations & Membership Study. Association of Statisticians of American Religious Bodies. Jones, Dale E., et al. 2002. Congregations and Membership in the United States 2000. Nashville, TN: Glenmary Research Center. Graphs represent county-level data
Food Environment Statistics: Number of grocery stores : 195Honolulu County :
2.17 / 10,000 pop.Hawaii :
2.30 / 10,000 pop.
Number of supercenters and club stores : 9Honolulu County :
0.10 / 10,000 pop.Hawaii :
0.09 / 10,000 pop.
Number of convenience stores (no gas) : 126Honolulu County :
1.40 / 10,000 pop.State :
1.57 / 10,000 pop.
Number of convenience stores (with gas) : 141Here :
1.57 / 10,000 pop.Hawaii :
1.72 / 10,000 pop.
Number of full-service restaurants : 734Honolulu County :
8.15 / 10,000 pop.Hawaii :
9.00 / 10,000 pop.
Adult diabetes rate : Honolulu County :
8.3%State :
8.1%
Adult obesity rate : Honolulu County :
20.5%State :
20.8%
Low-income preschool obesity rate : Health and Nutrition: Healthy diet rate : This city:
49.9%Hawaii:
54.6%
Average overall health of teeth and gums : This city:
46.7%Hawaii:
50.5%
People feeling badly about themselves : People not drinking alcohol at all : Average hours sleeping at night : Overweight people : This city:
31.8%Hawaii:
26.1%
General health condition : This city:
54.6%Hawaii:
57.4%
Average condition of hearing : More about Health and Nutrition of Waianae, HI Residents
4.80% of this county's 2021 resident taxpayers lived in other counties in 2020 ($72,704 average adjusted gross income )
Here:
4.80%Hawaii average:
4.91%
0.27% of residents moved from foreign countries ($4,064 average AGI )Honolulu County:
0.27%Hawaii average:
0.19%
Top counties from which taxpayers relocated into this county between 2020 and 2021:
5.90% of this county's 2020 resident taxpayers moved to other counties in 2021 ($71,643 average adjusted gross income )
Here:
5.90%Hawaii average:
5.53%
0.21% of residents moved to foreign countries ($2,928 average AGI )Honolulu County:
0.21%Hawaii average:
0.15%
Top counties to which taxpayers relocated from this county between 2020 and 2021:
Businesses in Waianae, HI
Name Count Name Count
7-Eleven 3 Curves 1 Baskin-Robbins 1 Jamba Juice 1 Blockbuster 1 Little Caesars Pizza 1 Burger King 1 McDonald's 1 CVS 1 Starbucks 1
Strongest AM radio stations in Waianae:
KHNR (650 AM; 10 kW; HONOLULU, HI; Owner: SALEM MEDIA OF HAWAII, INC.)
KHCM (940 AM; 10 kW; WAIPAHU, HI; Owner: SALEM MEDIA OF HAWAII, INC.)
KJPN (1370 AM; 6 kW; PEARL CITY, HI; Owner: DIAMOND BROADCASTING CORPORATION)
KORL (690 AM; 10 kW; HONOLULU, HI; Owner: NEW WAVE BROADCASTING, L.P.)
KSSK (590 AM; 8 kW; HONOLULU, HI; Owner: CAPSTAR TX LIMITED PARTNERSHIP)
KHVH (830 AM; 10 kW; HONOLULU, HI; Owner: CAPSTAR TX LIMITED PARTNERSHIP)
KGU (760 AM; 10 kW; HONOLULU, HI; Owner: SALEM MEDIA OF HAWAII, INC.)
KLHT (1040 AM; 10 kW; HONOLULU, HI; Owner: CALVARY CHAPEL OF HONOLULU, INC.)
KUMU (1500 AM; 10 kW; HONOLULU, HI; Owner: MAVERICK MEDIA OF OAHU LICENSE LLC)
KAIM (870 AM; 50 kW; HONOLULU, HI; Owner: SALEM MEDIA OF HAWAII, INC.)
KHBZ (990 AM; 5 kW; HONOLULU, HI; Owner: CAPSTAR TX LIMITED PARTNERSHIP)
KNDI (1270 AM; 5 kW; HONOLULU, HI; Owner: BROADCAST HOUSE OF THE PACIFIC INC.)
KWAI (1080 AM; 5 kW; HONOLULU, HI; Owner: RADIO HAWAII, INC.)
Strongest FM radio stations in Waianae:
KIPO (89.3 FM; HONOLULU, HI; Owner: HAWAII PUBLIC RADIO)
KAHA (105.9 FM; HONOLULU, HI; Owner: KASA MOKU KA PAWA BROADCASTING, INC.)
KCCN-FM (100.3 FM; HONOLULU, HI; Owner: CXR HOLDINGS, INC.)
KGMZ-FM (107.9 FM; AIEA, HI; Owner: HONOLULU BROADCASTING, INC.)
KINE-FM (105.1 FM; HONOLULU, HI; Owner: CXR HOLDINGS, INC.)
KUCD (101.9 FM; PEARL CITY, HI; Owner: CAPSTAR TX LIMITED PARTNERSHIP)
KAIM-FM (95.5 FM; HONOLULU, HI; Owner: SALEM MEDIA OF HAWAII, INC.)
KSSK-FM (92.3 FM; WAIPAHU, HI; Owner: CAPSTAR TX LIMITED PARTNERSHIP)
KDDB (102.7 FM; WAIPAHU, HI; Owner: NEW WAVE BROADCASTING, L.P.)
KPOI-FM (97.5 FM; HONOLULU, HI; Owner: NEW WAVE BROADCASTING, L.P.)
KQMQ-FM (93.1 FM; HONOLULU, HI; Owner: NEW WAVE BROADCASTING, L.P.)
KHUI (99.5 FM; HONOLULU, HI; Owner: NEW WAVE BROADCASTING, L.P.)
KXME (104.3 FM; KANEOHE, HI; Owner: CXR HOLDINGS, INC.)
KRTR-FM (96.3 FM; KAILUA, HI; Owner: CXR HOLDINGS, INC.)
K215EH (90.9 FM; KAILUA, HI; Owner: CALVARY CHAPEL OF TWIN FALLS, INC.)
K217AA (91.3 FM; WAIALUA, HI; Owner: UNIVERSITY OF HAWAII)
K204BB (88.7 FM; HALEIWA, ETC., HI; Owner: HAWAII PUBLIC RADIO)
K214CY (90.7 FM; MAILI, HI; Owner: EDUCATIONAL MEDIA FOUNDATION)
TV broadcast stations around Waianae:
KWHE (Channel 14; HONOLULU, HI; Owner: LESEA BROADCASTING CORPORATION)
KIKU (Channel 20; HONOLULU, HI; Owner: KHLS, INC.)
KHLU-LP (Channel 60; HONOLULU, HI; Owner: HTV/HTN/HAWAIIAN TV NETWORK, LTD.)
K54EX (Channel 54; HONOLULU, HI; Owner: CRAIG ALLYN JUE)
KAAH (Channel 26; HONOLULU, HI; Owner: TRINITY BROADCASTING NETWORK)
KHON-TV (Channel 2; HONOLULU, HI; Owner: EMMIS TELEVISION LICENSE CORPORATION)
KGMB (Channel 9; HONOLULU, HI; Owner: EMMIS TELEVISION LICENSE CORPORATION)
KITV (Channel 4; HONOLULU, HI; Owner: KITV HEARST-ARGYLE TV, INC. (CA CORP.))
KHET (Channel 11; HONOLULU, HI; Owner: HAWAII PUBLIC TELEVISION FOUNDATION)
KWBN (Channel 44; HONOLULU, HI; Owner: HO'ONA'AUAO COMMUNITY TV, INC.)
KBFD (Channel 32; HONOLULU, HI; Owner: THE ALLEN BROADCASTING CORP.)
KALO (Channel 38; HONOLULU, HI; Owner: PACIFICA BROADCASTING COMPANY)
KHNL (Channel 13; HONOLULU, HI; Owner: RAYCOM NATIONAL, INC.)
KHHI-LP (Channel 48; HONOLULU, HI; Owner: EQUITY BROADCASTING CORPORATION)
K56EX (Channel 56; HONOLULU, HI; Owner: VICTOR AGMATA, JR.)
National Bridge Inventory (NBI) Statistics 15 Number of bridges98ft / 30.0m Total length $3,012,000 Total costs58,568 Total average daily traffic1,351 Total average daily truck traffic81,957 Total future (year 2025) average daily traffic
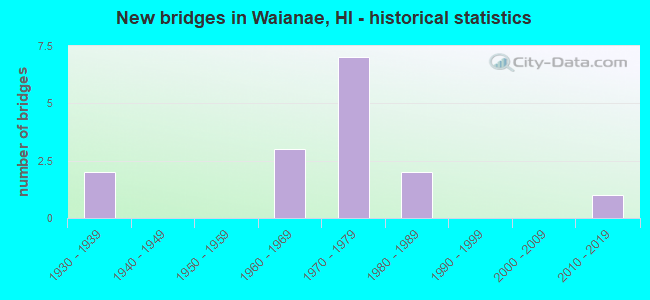
New bridges - historical statistics
2 1930-1939 3 1960-1969 7 1970-1979 2 1980-1989 1 2010-2019
See full National Bridge Inventory statistics for Waianae, HI
FCC Registered Cell Phone Towers: 1
84-083 Makau Street; Tmk 8-4-10:20 (Lat: 21.482944 Lon: -158.230556), Type: Building, Structure height: 7.6 m, Overall height: 7.9 m, Call Sign: KNKA373Assigned Frequencies: 869.040 MHz, 824.040 MHz, 890.010 MHz, 845.010 MHzGrant Date: 09/01/2015, Expiration Date: 10/01/2025, Certifier: Michael P GogginRegistrant: At&t Services, Inc., 208 S Akard St, 20f, Dallas, TX 75202, Phone: (855) 699-7073, Fax: (214) 746-6410, Email:
FCC Registered Antenna Towers: 1
Kevin J Bae, 85578 Waianae Road (Lat: 21.447667 Lon: -158.176972), Type: 91.4, Overall height: 90.3 m, Registrant: Km Communications, Inc., Kevinbae@kmcommunications.Com, , Skoki-e, Phone: (847) 674-0864 FCC Registered Commercial Land Mobile Towers: 1 (
See the full list of FCC Registered Commercial Land Mobile Towers in Waianae, HI )
FCC Registered Private Land Mobile Towers: 2 (
See the full list of FCC Registered Private Land Mobile Towers )
FCC Registered Broadcast Land Mobile Towers: 17 (
See the full list of FCC Registered Broadcast Land Mobile Towers )
FCC Registered Microwave Towers: 15 (
See the full list of FCC Registered Microwave Towers in this town )
FCC Registered Maritime Coast & Aviation Ground Towers: 2 (
See the full list of FCC Registered Maritime Coast & Aviation Ground Towers )
FCC Registered Amateur Radio Licenses: 168 (
See the full list of FCC Registered Amateur Radio Licenses in Waianae )
FAA Registered Aircraft: 6
Aircraft: PIPER PA-18A 150 (Category: Land, Weight: Up to 12,499 Pounds, Speed: 97 mph), Engine: LYCOMING O-320-B2B (160 HP) (Reciprocating)N-Number: 3977P, N3977P, N-3977P, Serial Number: 18-4768, Year manufactured: 1956, Airworthiness Date: 06/14/1991, Certificate Issue Date: 01/29/2013Registrant (Individual): Pieter U C Meinster, 84-077 Makau St, Waianae, HI 96792Aircraft: CESSNA 170B (Category: Land, Seats: 4, Weight: Up to 12,499 Pounds, Speed: 105 mph), Engine: CONT MOTOR 0-300 SER (145 HP) (Reciprocating)N-Number: 4381B, N4381B, N-4381B, Serial Number: 26725, Year manufactured: 1955, Airworthiness Date: 04/14/1956, Certificate Issue Date: 06/10/2019Registrant (Individual): William A Buck, 87-601 Manuu St, Waianae, HI 96792Aircraft: CESSNA 182H (Category: Land, Seats: 4, Weight: Up to 12,499 Pounds, Speed: 119 mph), Engine: CONT MOTOR O 470R (230 HP) (Reciprocating)N-Number: 5087B, N5087B, N-5087B, Serial Number: 18255988, Airworthiness Date: 12/29/2006, Certificate Issue Date: 05/21/2020Registrant (Individual): John David Pedersen, 84-965 Farrington Hwy # 8912a, Waianae, HI 96792Aircraft: PIPER PA-28-140 (Category: Land, Seats: 4, Weight: Up to 12,499 Pounds, Speed: 107 mph), Engine: LYCOMING IO-320 SERIES (150 HP) (Reciprocating)N-Number: 5702U, N5702U, N-5702U, Serial Number: 28-26499, Year manufactured: 1969, Airworthiness Date: 10/14/1969, Certificate Issue Date: 07/10/2015Registrant (Individual): Axel M Edwardsson, 84-664 Manuku St # A, Waianae, HI 96792Aircraft: CESSNA 150M (Category: Land, Seats: 2, Weight: Up to 12,499 Pounds, Speed: 81 mph), Engine: CONT MOTOR 0-200 SERIES (100 HP) (4 Cycle)N-Number: 704QH, N704QH, N-704QH, Serial Number: 15078786, Year manufactured: 1976, Airworthiness Date: 10/07/1976, Certificate Issue Date: 01/12/1998Registrant (Individual): Henry W Pelekai, 89-210 Mano Ave, Waianae, HI 96792Aircraft: CARPENTER TEENIE TWO (Category: Land, Weight: Up to 12,499 Pounds, Speed: 85 mph), Engine: VOLKSWAGEN CONVERSION (36 HP) (Reciprocating)N-Number: 25205, N25205, N-25205, Serial Number: 5-10782, Airworthiness Date: 05/17/1986, Certificate Issue Date: 01/03/2012Registrant (Individual): Dan I Carpenter, Po Box 4279, Waianae, HI 96792Deregistered: Cancel Date: 01/02/2018
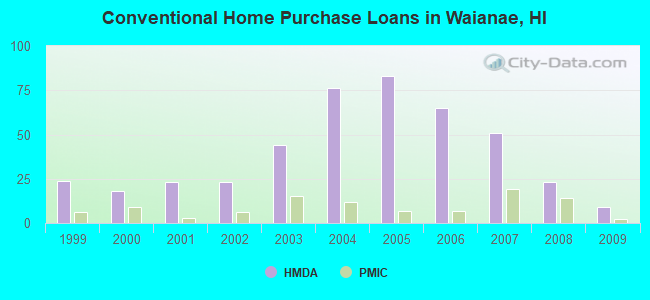
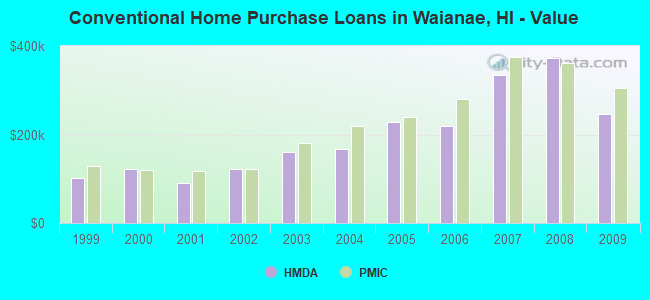
Home Mortgage Disclosure Act Aggregated Statistics For Year 2009(Based on 1 partial tract) A) FHA, FSA/RHS & VA B) Conventional C) Refinancings D) Home Improvement Loans F) Non-occupant Loans on Number Average Value Number Average Value Number Average Value Number Average Value Number Average Value
LOANS ORIGINATED 28 $302,603 9 $247,124 116 $281,132 3 $144,350 8 $228,334 APPLICATIONS APPROVED, NOT ACCEPTED 6 $282,163 1 $71,930 17 $270,936 1 $295,000 3 $276,833 APPLICATIONS DENIED 12 $276,895 4 $287,552 57 $289,238 8 $144,049 7 $263,963 APPLICATIONS WITHDRAWN 2 $277,925 2 $170,750 24 $247,922 2 $217,980 5 $215,800 FILES CLOSED FOR INCOMPLETENESS 0 $0 0 $0 9 $220,079 0 $0 0 $0
Aggregated Statistics For Year 2008(Based on 1 partial tract) A) FHA, FSA/RHS & VA B) Conventional C) Refinancings D) Home Improvement Loans E) Loans on Dwellings For 5+ Families F) Non-occupant Loans on G) Loans On Manufactured Number Average Value Number Average Value Number Average Value Number Average Value Number Average Value Number Average Value Number Average Value
LOANS ORIGINATED 12 $387,096 23 $372,967 62 $242,134 10 $133,694 1 $457,760 11 $302,265 0 $0 APPLICATIONS APPROVED, NOT ACCEPTED 1 $220,160 0 $0 12 $265,754 4 $72,478 0 $0 0 $0 0 $0 APPLICATIONS DENIED 2 $416,705 9 $240,262 91 $276,739 8 $98,272 0 $0 3 $331,813 1 $290,640 APPLICATIONS WITHDRAWN 3 $340,050 5 $351,384 23 $255,637 1 $441,050 0 $0 1 $636,500 0 $0 FILES CLOSED FOR INCOMPLETENESS 0 $0 0 $0 1 $188,190 0 $0 0 $0 1 $188,190 0 $0
Aggregated Statistics For Year 2007(Based on 1 partial tract) A) FHA, FSA/RHS & VA B) Conventional C) Refinancings D) Home Improvement Loans F) Non-occupant Loans on G) Loans On Manufactured Number Average Value Number Average Value Number Average Value Number Average Value Number Average Value Number Average Value
LOANS ORIGINATED 21 $462,429 51 $333,367 121 $259,757 20 $131,042 13 $309,475 1 $108,260 APPLICATIONS APPROVED, NOT ACCEPTED 2 $344,410 9 $315,021 26 $258,418 4 $172,568 2 $340,050 0 $0 APPLICATIONS DENIED 3 $307,593 23 $306,404 98 $289,958 28 $188,475 9 $322,046 0 $0 APPLICATIONS WITHDRAWN 3 $187,463 9 $252,938 38 $266,911 7 $190,680 4 $206,718 0 $0 FILES CLOSED FOR INCOMPLETENESS 1 $104,630 1 $576,920 12 $254,552 0 $0 1 $579,830 0 $0
Aggregated Statistics For Year 2006(Based on 1 partial tract) A) FHA, FSA/RHS & VA B) Conventional C) Refinancings D) Home Improvement Loans F) Non-occupant Loans on G) Loans On Manufactured Number Average Value Number Average Value Number Average Value Number Average Value Number Average Value Number Average Value
LOANS ORIGINATED 16 $313,573 65 $220,037 192 $234,881 23 $183,324 17 $231,871 0 $0 APPLICATIONS APPROVED, NOT ACCEPTED 0 $0 17 $295,256 34 $261,939 7 $163,277 9 $268,519 0 $0 APPLICATIONS DENIED 1 $376,380 36 $224,802 97 $249,905 22 $155,426 14 $272,942 0 $0 APPLICATIONS WITHDRAWN 1 $755,660 14 $242,581 76 $253,994 9 $214,509 4 $213,802 1 $47,230 FILES CLOSED FOR INCOMPLETENESS 0 $0 9 $220,079 20 $247,844 1 $315,340 1 $206,350 0 $0
Aggregated Statistics For Year 2005(Based on 1 partial tract) A) FHA, FSA/RHS & VA B) Conventional C) Refinancings D) Home Improvement Loans F) Non-occupant Loans on G) Loans On Manufactured Number Average Value Number Average Value Number Average Value Number Average Value Number Average Value Number Average Value
LOANS ORIGINATED 6 $184,557 83 $227,216 188 $220,987 20 $150,406 28 $238,974 0 $0 APPLICATIONS APPROVED, NOT ACCEPTED 1 $120,620 21 $169,817 22 $222,141 1 $301,540 1 $350,220 0 $0 APPLICATIONS DENIED 1 $279,010 30 $253,317 95 $216,611 18 $135,349 11 $265,737 1 $98,090 APPLICATIONS WITHDRAWN 1 $278,290 20 $153,712 62 $207,784 14 $159,385 5 $218,706 0 $0 FILES CLOSED FOR INCOMPLETENESS 0 $0 8 $157,128 25 $219,142 1 $44,320 0 $0 0 $0
Aggregated Statistics For Year 2004(Based on 1 partial tract) A) FHA, FSA/RHS & VA B) Conventional C) Refinancings D) Home Improvement Loans E) Loans on Dwellings For 5+ Families F) Non-occupant Loans on G) Loans On Manufactured Number Average Value Number Average Value Number Average Value Number Average Value Number Average Value Number Average Value Number Average Value
LOANS ORIGINATED 12 $189,763 76 $167,462 137 $171,674 12 $110,322 1 $1,195,980 18 $168,369 1 $154,040 APPLICATIONS APPROVED, NOT ACCEPTED 0 $0 18 $143,867 39 $168,981 4 $89,918 0 $0 5 $173,222 0 $0 APPLICATIONS DENIED 2 $185,285 20 $171,296 74 $169,779 11 $70,678 0 $0 7 $128,400 0 $0 APPLICATIONS WITHDRAWN 2 $167,120 15 $154,766 82 $177,742 9 $97,688 0 $0 7 $146,773 0 $0 FILES CLOSED FOR INCOMPLETENESS 0 $0 1 $205,630 15 $172,107 0 $0 0 $0 0 $0 0 $0
Aggregated Statistics For Year 2003(Based on 1 partial tract) A) FHA, FSA/RHS & VA B) Conventional C) Refinancings D) Home Improvement Loans F) Non-occupant Loans on Number Average Value Number Average Value Number Average Value Number Average Value Number Average Value
LOANS ORIGINATED 9 $167,602 44 $160,546 171 $147,606 8 $84,376 20 $132,168 APPLICATIONS APPROVED, NOT ACCEPTED 1 $265,940 7 $152,483 19 $156,410 1 $52,320 6 $133,332 APPLICATIONS DENIED 1 $74,110 12 $164,212 65 $157,303 1 $29,060 12 $131,393 APPLICATIONS WITHDRAWN 2 $226,700 7 $141,583 63 $155,331 1 $1,450 4 $100,635 FILES CLOSED FOR INCOMPLETENESS 1 $55,220 0 $0 15 $128,511 0 $0 2 $64,665
Aggregated Statistics For Year 2002(Based on 1 partial tract) A) FHA, FSA/RHS & VA B) Conventional C) Refinancings D) Home Improvement Loans F) Non-occupant Loans on Number Average Value Number Average Value Number Average Value Number Average Value Number Average Value
LOANS ORIGINATED 15 $134,179 23 $121,279 89 $127,963 5 $25,430 13 $110,499 APPLICATIONS APPROVED, NOT ACCEPTED 1 $46,500 10 $150,987 6 $167,118 1 $34,880 0 $0 APPLICATIONS DENIED 2 $172,565 6 $161,668 22 $147,665 1 $18,160 3 $78,230 APPLICATIONS WITHDRAWN 4 $137,872 2 $122,430 38 $153,446 1 $4,360 4 $133,875 FILES CLOSED FOR INCOMPLETENESS 0 $0 0 $0 9 $165,746 0 $0 0 $0
Aggregated Statistics For Year 2001(Based on 1 partial tract) A) FHA, FSA/RHS & VA B) Conventional C) Refinancings D) Home Improvement Loans F) Non-occupant Loans on Number Average Value Number Average Value Number Average Value Number Average Value Number Average Value
LOANS ORIGINATED 19 $131,515 23 $90,825 65 $129,827 3 $6,053 15 $105,163 APPLICATIONS APPROVED, NOT ACCEPTED 3 $127,640 4 $109,172 10 $161,305 2 $18,890 3 $73,870 APPLICATIONS DENIED 2 $126,065 6 $156,825 26 $161,501 4 $17,075 4 $99,180 APPLICATIONS WITHDRAWN 2 $147,135 3 $63,213 19 $104,707 1 $25,430 1 $82,110 FILES CLOSED FOR INCOMPLETENESS 0 $0 0 $0 20 $167,772 0 $0 0 $0
Aggregated Statistics For Year 2000(Based on 1 partial tract) A) FHA, FSA/RHS & VA B) Conventional C) Refinancings D) Home Improvement Loans F) Non-occupant Loans on Number Average Value Number Average Value Number Average Value Number Average Value Number Average Value
LOANS ORIGINATED 15 $120,906 18 $122,149 33 $81,093 10 $8,647 9 $93,893 APPLICATIONS APPROVED, NOT ACCEPTED 1 $164,210 12 $133,694 7 $171,374 0 $0 3 $151,373 APPLICATIONS DENIED 5 $120,906 12 $104,207 17 $121,128 1 $7,270 4 $176,382 APPLICATIONS WITHDRAWN 1 $107,540 1 $157,670 7 $128,297 0 $0 1 $141,690 FILES CLOSED FOR INCOMPLETENESS 0 $0 0 $0 15 $197,393 0 $0 1 $119,160
Aggregated Statistics For Year 1999(Based on 1 partial tract) A) FHA, FSA/RHS & VA B) Conventional C) Refinancings D) Home Improvement Loans F) Non-occupant Loans on Number Average Value Number Average Value Number Average Value Number Average Value Number Average Value
LOANS ORIGINATED 25 $108,134 24 $100,918 78 $82,696 16 $19,346 12 $100,594 APPLICATIONS APPROVED, NOT ACCEPTED 1 $138,900 4 $115,990 13 $164,288 1 $129,740 5 $164,006 APPLICATIONS DENIED 1 $172,750 11 $609,399 27 $173,220 8 $5,024 7 $154,114 APPLICATIONS WITHDRAWN 4 $143,135 1 $177,690 16 $131,061 0 $0 1 $97,300 FILES CLOSED FOR INCOMPLETENESS 1 $110,700 1 $181,210 23 $158,923 0 $0 1 $188,970
Detailed HMDA statistics for the following Tracts:
0097.02
Private Mortgage Insurance Companies Aggregated Statistics For Year 2009(Based on 1 partial tract) A) Conventional B) Refinancings Number Average Value Number Average Value
LOANS ORIGINATED 2 $305,900 2 $315,345 APPLICATIONS APPROVED, NOT ACCEPTED 0 $0 0 $0 APPLICATIONS DENIED 0 $0 1 $56,670 APPLICATIONS WITHDRAWN 1 $134,420 0 $0 FILES CLOSED FOR INCOMPLETENESS 0 $0 0 $0
Aggregated Statistics For Year 2008(Based on 1 partial tract) A) Conventional B) Refinancings C) Non-occupant Loans on Number Average Value Number Average Value Number Average Value
LOANS ORIGINATED 14 $362,106 8 $262,848 0 $0 APPLICATIONS APPROVED, NOT ACCEPTED 4 $417,978 4 $372,565 0 $0 APPLICATIONS DENIED 0 $0 1 $243,410 0 $0 APPLICATIONS WITHDRAWN 2 $377,105 0 $0 0 $0 FILES CLOSED FOR INCOMPLETENESS 1 $331,330 0 $0 1 $331,330
Aggregated Statistics For Year 2007(Based on 1 partial tract) A) Conventional B) Refinancings C) Non-occupant Loans on Number Average Value Number Average Value Number Average Value
LOANS ORIGINATED 19 $375,346 11 $327,829 1 $154,770 APPLICATIONS APPROVED, NOT ACCEPTED 0 $0 1 $274,650 0 $0 APPLICATIONS DENIED 0 $0 0 $0 0 $0 APPLICATIONS WITHDRAWN 1 $546,400 1 $380,740 1 $408,350 FILES CLOSED FOR INCOMPLETENESS 0 $0 0 $0 0 $0
Aggregated Statistics For Year 2006(Based on 1 partial tract) A) Conventional B) Refinancings C) Non-occupant Loans on Number Average Value Number Average Value Number Average Value
LOANS ORIGINATED 7 $280,467 3 $308,803 1 $186,740 APPLICATIONS APPROVED, NOT ACCEPTED 0 $0 1 $274,650 0 $0 APPLICATIONS DENIED 0 $0 0 $0 0 $0 APPLICATIONS WITHDRAWN 0 $0 0 $0 0 $0 FILES CLOSED FOR INCOMPLETENESS 0 $0 1 $203,450 0 $0
Aggregated Statistics For Year 2005(Based on 1 partial tract) A) Conventional B) Refinancings Number Average Value Number Average Value
LOANS ORIGINATED 7 $238,740 8 $236,962 APPLICATIONS APPROVED, NOT ACCEPTED 1 $165,660 0 $0 APPLICATIONS DENIED 1 $134,420 0 $0 APPLICATIONS WITHDRAWN 0 $0 1 $154,770 FILES CLOSED FOR INCOMPLETENESS 0 $0 0 $0
Aggregated Statistics For Year 2004(Based on 1 partial tract) A) Conventional B) Refinancings C) Non-occupant Loans on D) Loans On Manufactured Number Average Value Number Average Value Number Average Value Number Average Value
LOANS ORIGINATED 12 $218,827 7 $184,349 5 $205,918 1 $154,040 APPLICATIONS APPROVED, NOT ACCEPTED 1 $151,130 4 $205,990 0 $0 0 $0 APPLICATIONS DENIED 0 $0 0 $0 0 $0 0 $0 APPLICATIONS WITHDRAWN 1 $331,330 0 $0 0 $0 0 $0 FILES CLOSED FOR INCOMPLETENESS 0 $0 0 $0 0 $0 0 $0
Aggregated Statistics For Year 2003(Based on 1 partial tract) A) Conventional B) Refinancings C) Non-occupant Loans on Number Average Value Number Average Value Number Average Value
LOANS ORIGINATED 15 $180,342 14 $182,532 2 $166,030 APPLICATIONS APPROVED, NOT ACCEPTED 2 $216,165 3 $158,157 1 $71,210 APPLICATIONS DENIED 1 $163,480 0 $0 0 $0 APPLICATIONS WITHDRAWN 2 $235,055 1 $133,690 0 $0 FILES CLOSED FOR INCOMPLETENESS 0 $0 0 $0 0 $0
Aggregated Statistics For Year 2002(Based on 1 partial tract) A) Conventional B) Refinancings C) Non-occupant Loans on Number Average Value Number Average Value Number Average Value
LOANS ORIGINATED 6 $122,553 9 $162,193 1 $60,310 APPLICATIONS APPROVED, NOT ACCEPTED 1 $103,180 1 $76,290 0 $0 APPLICATIONS DENIED 1 $65,390 0 $0 0 $0 APPLICATIONS WITHDRAWN 1 $363,300 1 $76,290 0 $0 FILES CLOSED FOR INCOMPLETENESS 1 $103,900 0 $0 0 $0
Aggregated Statistics For Year 2001(Based on 1 partial tract) A) Conventional B) Refinancings Number Average Value Number Average Value
LOANS ORIGINATED 3 $116,983 4 $190,915 APPLICATIONS APPROVED, NOT ACCEPTED 1 $90,100 2 $161,305 APPLICATIONS DENIED 0 $0 0 $0 APPLICATIONS WITHDRAWN 1 $78,470 0 $0 FILES CLOSED FOR INCOMPLETENESS 0 $0 0 $0
Aggregated Statistics For Year 2000(Based on 1 partial tract) A) Conventional B) Refinancings C) Non-occupant Loans on Number Average Value Number Average Value Number Average Value
LOANS ORIGINATED 9 $119,486 1 $85,010 0 $0 APPLICATIONS APPROVED, NOT ACCEPTED 2 $131,515 1 $85,010 1 $75,570 APPLICATIONS DENIED 2 $117,710 0 $0 0 $0 APPLICATIONS WITHDRAWN 0 $0 0 $0 0 $0 FILES CLOSED FOR INCOMPLETENESS 0 $0 0 $0 0 $0
Aggregated Statistics For Year 1999(Based on 1 partial tract) A) Conventional B) Refinancings Number Average Value Number Average Value
LOANS ORIGINATED 6 $129,622 1 $240,440 APPLICATIONS APPROVED, NOT ACCEPTED 0 $0 1 $108,590 APPLICATIONS DENIED 0 $0 0 $0 APPLICATIONS WITHDRAWN 0 $0 0 $0 FILES CLOSED FOR INCOMPLETENESS 0 $0 0 $0
Detailed PMIC statistics for the following Tracts:
0097.02
Waianae compared to Hawaii state average:
Median house value below state average. Hispanic race population percentage above state average. Median age significantly below state average. Foreign-born population percentage below state average. Length of stay since moving in significantly above state average. Percentage of population with a bachelor's degree or higher below state average.
#23 on the list of "Top 100 low-educated but high-earning cities (pop. 5,000+)"
#47 on the list of "Top 101 cities with the most residents born in Oceania, n.e.c. (population 500+)"
#48 on the list of "Top 100 cities with longest commuting times (pop. 5,000+)"
#74 on the list of "Top 101 cities with the most residents born in Oceania (population 500+)"
#51 (96792) on the list of "Top 101 zip codes with the largest percentage of Portuguese first ancestries"
#7 on the list of "Top 101 counties with the lowest average weight of females"
#15 on the list of "Top 101 counties with the highest ground withdrawal of fresh water for public supply"
#21 on the list of "Top 101 counties with the most Other congregations"
#25 on the list of "Top 101 counties with the most Other adherents"
#25 on the list of "Top 101 counties with the highest carbon monoxide air pollution readings in 2012 (ppm)"
Top Patent Applicants
Martin R.m. Dunsmuir (4)
Wayne Grimes Hirakawa (1)
Martin R. M. Dunsmuir (1)
Donald Armand Lopes (1)
Abram Johnasen (1)
Bobby Angel Rodney Freitas (1)
Total of 9 patent applications in 2008-2024.


 Recent articles from our blog. Our writers, many of them Ph.D. graduates or candidates, create easy-to-read articles on a wide variety of topics.

 (12.3 miles
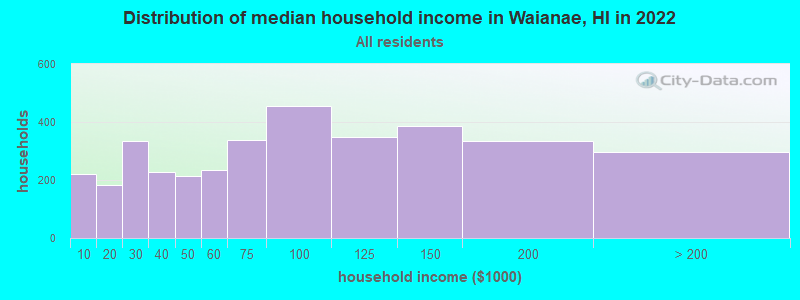


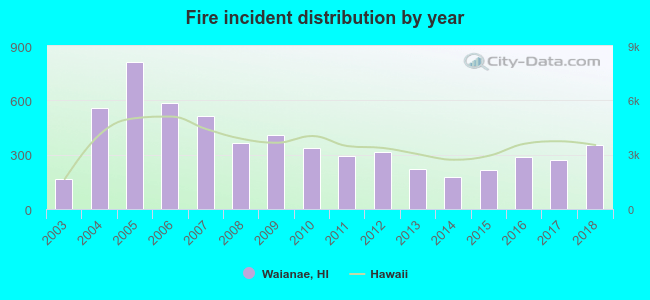 According to the data from the years 2003 - 2018 the average number of fire incidents per year is 366. The highest number of fires - 810 took place in 2005, and the least - 165 in 2003. The data has an increasing trend.
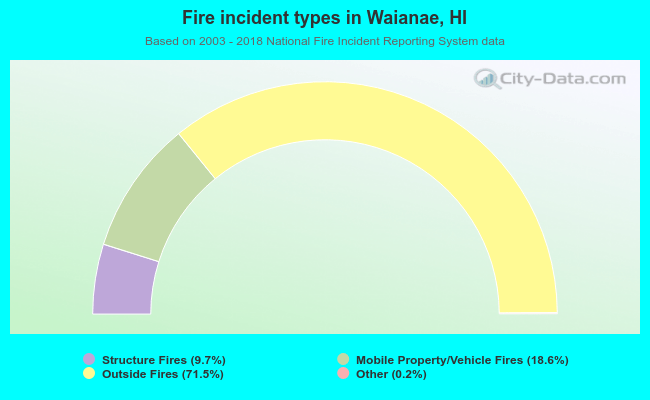 When looking into fire subcategories, the most reports belonged to: Outside Fires (71.5%), and Mobile Property/Vehicle Fires (18.6%).