Makakilo City, Hawaii
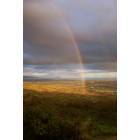
Makakilo City: EVEN WHEN THERE IS RAIN WE STILL GET A RAINBOW IN MAKAKILO
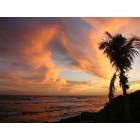
Makakilo City: This was taken at Germaines Luau down in Campbell Industrial Park
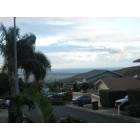
Makakilo City: on top of Hunekai St. This is where my son lives and I took this picture last week
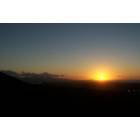
Makakilo City: SUNRISE OVER DIAMOND HEAD FROM MAKAKILO
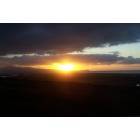
Makakilo City: "Rising Sun Over Diamond Head" from Makakilo City, Oahu
- add
your
Submit your own pictures of this place and show them to the world
- OSM Map
- General Map
- Google Map
- MSN Map
| Males: 6,790 | |
| Females: 6,721 |
| Median resident age: | 32.4 years |
| Hawaii median age: | 36.2 years |
Zip codes: 96707.
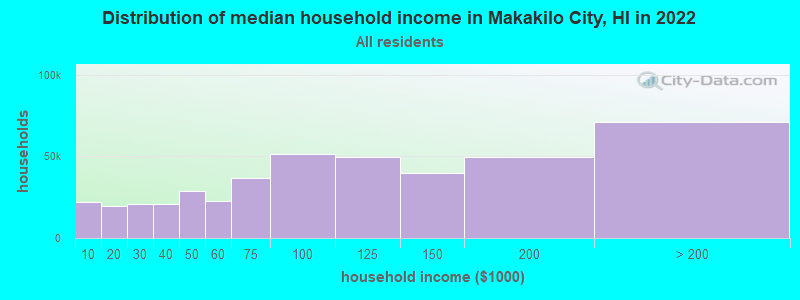
| Makakilo City: | $123,743 |
| HI: | $92,458 |
Estimated per capita income in 2022: $41,522 (it was $20,945 in 2000)
Makakilo City CDP income, earnings, and wages data
Estimated median house or condo value in 2022: $685,014 (it was $215,100 in 2000)
| Makakilo City: | $685,014 |
| HI: | $820,100 |
Mean prices in 2022: all housing units: $999,130; detached houses: over $1,000,000; townhouses or other attached units: $982,127; in 2-unit structures: $920,464; in 3-to-4-unit structures: $717,340; in 5-or-more-unit structures: $577,655; mobile homes: over $1,000,000; occupied boats, rvs, vans, etc.: $319,807
Detailed information about poverty and poor residents in Makakilo City, HI
Compare current foreclosures near Makakilo City, HI:
| Photo | Address | Area | Beds / Baths | Price | Details |
|---|---|---|---|---|---|

|
#1
Victoria St Apt 1002
Honolulu, HI 96822
|
930 sq. feet
|
1 baths 2 beds |
$145,000
|
show details |

|
#2
-133 Pupupuhi St Unit
Waipahu, HI 96797
|
1,176 sq. feet
|
3 baths 3 beds |
$515,000
|
show details |

|
#3
Richard Ln Apt B613
Honolulu, HI 96819
|
643 sq. feet
|
1 baths 2 beds |
$365,000
|
show details |

|
#4
343 Ho Owalea Place
Ewa Beach, HI 96706
|
- sq. feet
|
3 baths 4 beds |
$904,800
|
show details |

|
#5
-680 Kili Dr Unit 1603
Waianae, HI 96792
|
- sq. feet
|
1 baths 2 beds |
$301,600
|
show details |

|
#6
889 Puamaeole St Unit 8a
Ewa Beach, HI 96706
|
- sq. feet
|
2 baths 2 beds |
$468,000
|
show details |

|
#7
S Kukui St Apt D-1003
Honolulu, HI 96813
|
615 sq. feet
|
1 baths 1 beds |
show details | |

|
#8
Pohakupili Pl
Ewa Beach, HI 96706
|
1,468 sq. feet
|
2 baths 3 beds |
show details | |

|
#9
-140 Kupuohi Pl
Waipahu, HI 96797
|
1,128 sq. feet
|
2 baths 3 beds |
show details | |

|
#10
Queen St Apt 3405
Honolulu, HI 96814
|
1,157 sq. feet
|
2 baths 2 beds |
show details |
| Photo | Address | Area | Beds / Baths | Price | Details |
|---|---|---|---|---|---|

|
#11
Pahu St Apt 44
Waipahu, HI 96797
|
968 sq. feet
|
1 baths 3 beds |
show details | |

|
#12
-720 Puluniu Loop
Aiea, HI 96701
|
- sq. feet
|
3 baths 3 beds |
show details | |

|
#13
Liholiho St Apt 1905
Honolulu, HI 96822
|
444 sq. feet
|
1 baths 1 beds |
show details | |

|
#14
Kama Ln
Honolulu, HI 96817
|
720 sq. feet
|
1 baths 3 beds |
show details | |

|
#15
Mahaoo Pl
Honolulu, HI 96819
|
3,453 sq. feet
|
5 baths 8 beds |
show details | |

|
#16
Uakanikoo St
Wahiawa, HI 96786
|
1,090 sq. feet
|
2 baths 3 beds |
show details | |

|
#17
Kalihi St
Honolulu, HI 96819
|
1,292 sq. feet
|
1 baths 4 beds |
show details | |

|
#18
Ala Nioi Pl Apt 105
Honolulu, HI 96818
|
904 sq. feet
|
2 baths 3 beds |
show details | |

|
#19
Hala Dr
Honolulu, HI 96817
|
1,664 sq. feet
|
4 baths 10 beds |
show details | |

|
#20
Perry St
Honolulu, HI 96819
|
660 sq. feet
|
1 baths 3 beds |
show details |
| Photo | Address | Area | Beds / Baths | Price | Details |
|---|---|---|---|---|---|

|
#21
Ehoeho Ave
Wahiawa, HI 96786
|
1,202 sq. feet
|
3 baths 3 beds |
show details | |

|
#22
Ala Napuaa Pl Apt 1019
Honolulu, HI 96818
|
587 sq. feet
|
1 baths 1 beds |
show details | |

|
#23
Ala Makahala Pl Apt 903
Honolulu, HI 96818
|
552 sq. feet
|
1 baths 1 beds |
show details | |

|
#24
Luka St
Honolulu, HI 96817
|
3,052 sq. feet
|
3 baths 5 beds |
show details | |

|
#25
Ahuula St
Honolulu, HI 96819
|
766 sq. feet
|
2 baths 4 beds |
show details | |

|
#26
Puaala Ln
Honolulu, HI 96819
|
3,292 sq. feet
|
4 baths 9 beds |
show details | |

|
#27
Kahauiki St
Honolulu, HI 96819
|
1,440 sq. feet
|
2 baths 5 beds |
show details | |

|
#28
Mokauea St
Honolulu, HI 96819
|
320 sq. feet
|
2 baths 2 beds |
show details | |

|
#29
Makanani Dr
Honolulu, HI 96817
|
2,251 sq. feet
|
3 baths 4 beds |
show details | |

|
#30
Hillcrest St
Honolulu, HI 96817
|
1,135 sq. feet
|
3 baths 7 beds |
show details |
| Photo | Address | Area | Beds / Baths | Price | Details |
|---|---|---|---|---|---|

|
#31
N School St
Honolulu, HI 96819
|
3,468 sq. feet
|
5 baths 8 beds |
show details | |

|
#32
Kaumualii St Apt 309
Honolulu, HI 96817
|
609 sq. feet
|
1 baths 2 beds |
show details | |

|
#33
Elua St
Honolulu, HI 96819
|
1,492 sq. feet
|
2 baths 5 beds |
show details | |

|
#34
Mcneill St Apt 317
Honolulu, HI 96817
|
585 sq. feet
|
1 baths 2 beds |
show details | |

|
#35
Kaauwai Pl # B
Honolulu, HI 96817
|
1,033 sq. feet
|
3 baths 4 beds |
show details | |

|
#36
Kealoha St
Honolulu, HI 96819
|
3,260 sq. feet
|
6 baths 10 beds |
show details | |

|
#37
Pacheco St
Honolulu, HI 96819
|
1,687 sq. feet
|
2 baths 4 beds |
show details | |

|
#38
Makamua St
Pearl City, HI 96782
|
2,663 sq. feet
|
4 baths 6 beds |
show details | |

|
#39
Ala Ilima St Apt 211
Honolulu, HI 96818
|
704 sq. feet
|
1 baths 2 beds |
show details | |

|
#40
Akepa St
Pearl City, HI 96782
|
1,200 sq. feet
|
2 baths 3 beds |
show details |
| Photo | Address | Area | Beds / Baths | Price | Details |
|---|---|---|---|---|---|

|
#41
Makamua St
Pearl City, HI 96782
|
1,619 sq. feet
|
1 baths 4 beds |
show details | |

|
#42
Noelani St
Pearl City, HI 96782
|
3,224 sq. feet
|
2 baths 6 beds |
show details | |

|
#43
Hoolaa Pl
Pearl City, HI 96782
|
3,067 sq. feet
|
5 baths 6 beds |
show details | |

|
#44
Aamanu St
Pearl City, HI 96782
|
1,901 sq. feet
|
2 baths 4 beds |
show details | |

|
#45
Kaweloka St
Pearl City, HI 96782
|
1,440 sq. feet
|
2 baths 3 beds |
show details | |

|
#46
Kaumoli St
Pearl City, HI 96782
|
3,168 sq. feet
|
3 baths 6 beds |
show details | |

|
#47
Alamihi St
Waianae, HI 96792
|
- sq. feet
|
3 baths 4 beds |
show details | |

|
#48
Kaweloka St
Pearl City, HI 96782
|
2,344 sq. feet
|
3 baths 7 beds |
show details | |

|
#49
Kaweloka St
Pearl City, HI 96782
|
1,404 sq. feet
|
1 baths 3 beds |
show details | |

|
Check over 1 million property listings on Foreclosure.com!
|
browse all offers | |||

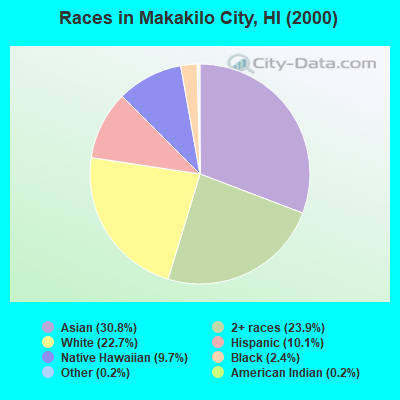
- 4,04930.8%Asian alone
- 3,14923.9%Two or more races
- 2,98622.7%White alone
- 1,32710.1%Hispanic
- 1,2749.7%Native Hawaiian and Other
Pacific Islander alone - 3182.4%Black alone
- 210.2%American Indian alone
- 320.2%Other race alone
Races in Makakilo City detailed stats: ancestries, foreign born residents, place of birth
 Recent articles from our blog. Our writers, many of them Ph.D. graduates or candidates, create easy-to-read articles on a wide variety of topics.

 | Makakilo and Sea Country-On list for consideration (4 replies) |
| Where would you rather live? (18 replies) |
Ancestries: German (5.5%), Irish (5.3%), Portuguese (4.2%), English (3.8%), United States (2.6%), French (1.7%).
Current Local Time: HST (no DST) time zone
Elevation: 400 feet
Land area: 3.14 square miles.
Population density: 4,301 people per square mile (average).
1,962 residents are foreign born (12.6% Asia).
| This place: | 14.9% |
| Hawaii: | 17.5% |
| Makakilo City CDP: | 0.3% ($719) |
| Hawaii: | 0.3% ($765) |
Nearest city with pop. 50,000+: Ewa, HI  (6.5 miles , pop. 272,328).
Nearest city with pop. 1,000,000+: Los Angeles, CA (2567.3 miles , pop. 3,694,820).
Nearest cities:
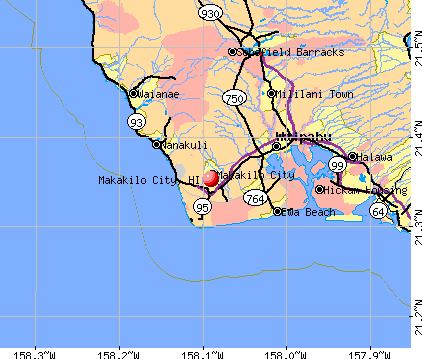
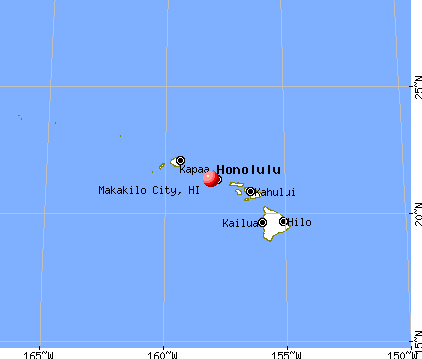
), ), ), ), )Latitude: 21.35 N, Longitude: 158.09 W
Daytime population change due to commuting: -5,913 (-44.9%)
Workers who live and work in this place: 252 (3.9%)
Property values in Makakilo City, HI
Makakilo City tourist attractions:
- Hawaiian Waters Adventure Park - Kapolei, Hawaii - Hawaii's Only Water Park
- JW Marriott Ihilani Resort and Spa at Ko Olina - Kapolei, Hawaii Elegant Resort on Oahu's West Coast
- Ko Olina Lagoons - Kapolei, Hawaii - Manmade Swimming Holes on Oahu's West Coast
- Marriott's Ko Olina Beach Club - Kapolei, Hawaii - Bungalows and Privacy on Oahu's West Coast
| Here: | 2.9% |
| Hawaii: | 2.9% |
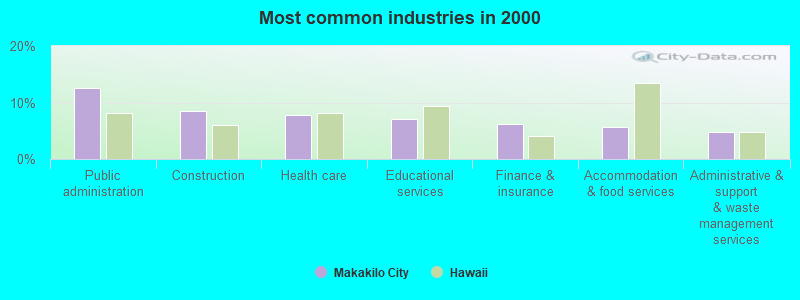
- Public administration (12.5%)
- Construction (8.5%)
- Health care (7.8%)
- Educational services (7.0%)
- Finance & insurance (6.1%)
- Accommodation & food services (5.7%)
- Administrative & support & waste management services (4.7%)
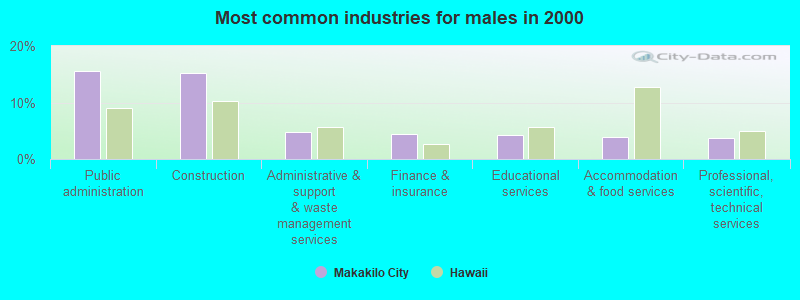
- Public administration (15.7%)
- Construction (15.2%)
- Administrative & support & waste management services (4.7%)
- Finance & insurance (4.5%)
- Educational services (4.3%)
- Accommodation & food services (3.9%)
- Professional, scientific, technical services (3.6%)
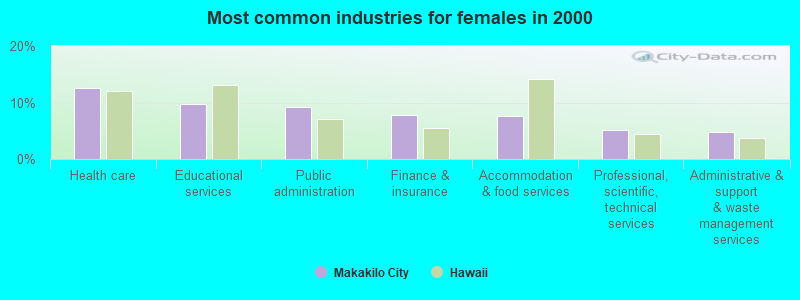
- Health care (12.6%)
- Educational services (9.8%)
- Public administration (9.3%)
- Finance & insurance (7.8%)
- Accommodation & food services (7.6%)
- Professional, scientific, technical services (5.1%)
- Administrative & support & waste management services (4.7%)
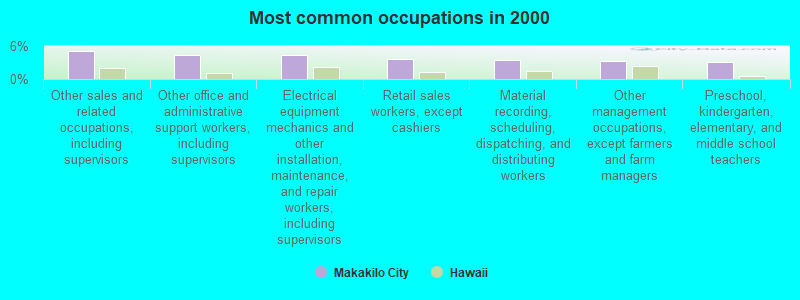
- Other sales and related occupations, including supervisors (5.2%)
- Other office and administrative support workers, including supervisors (4.4%)
- Electrical equipment mechanics and other installation, maintenance, and repair workers, including supervisors (4.4%)
- Retail sales workers, except cashiers (3.6%)
- Material recording, scheduling, dispatching, and distributing workers (3.4%)
- Other management occupations, except farmers and farm managers (3.2%)
- Preschool, kindergarten, elementary, and middle school teachers (3.1%)
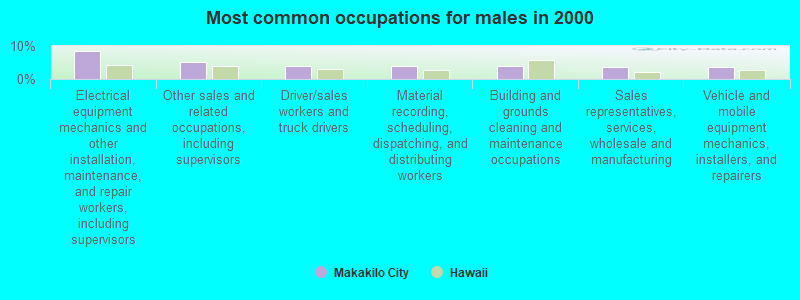
- Electrical equipment mechanics and other installation, maintenance, and repair workers, including supervisors (8.5%)
- Other sales and related occupations, including supervisors (5.1%)
- Driver/sales workers and truck drivers (4.0%)
- Material recording, scheduling, dispatching, and distributing workers (3.9%)
- Building and grounds cleaning and maintenance occupations (3.8%)
- Sales representatives, services, wholesale and manufacturing (3.6%)
- Vehicle and mobile equipment mechanics, installers, and repairers (3.6%)
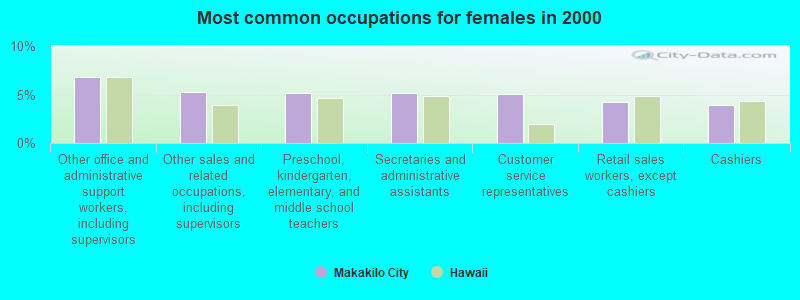
- Other office and administrative support workers, including supervisors (6.8%)
- Other sales and related occupations, including supervisors (5.3%)
- Preschool, kindergarten, elementary, and middle school teachers (5.2%)
- Secretaries and administrative assistants (5.2%)
- Customer service representatives (5.1%)
- Retail sales workers, except cashiers (4.2%)
- Cashiers (3.9%)
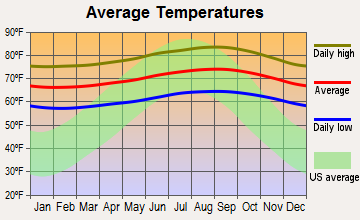
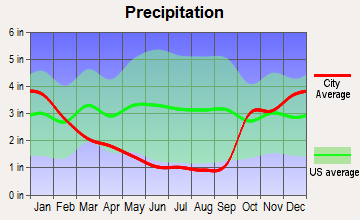
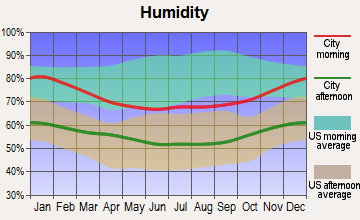
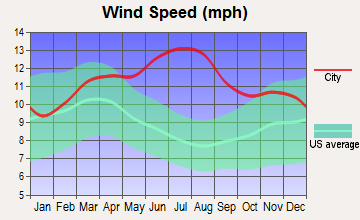
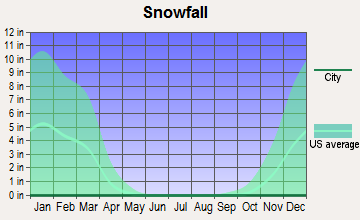
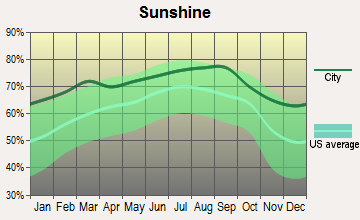
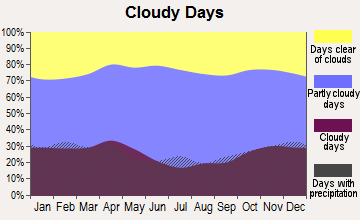
Average climate in Makakilo City, Hawaii
Based on data reported by over 4,000 weather stations
(lower is better)
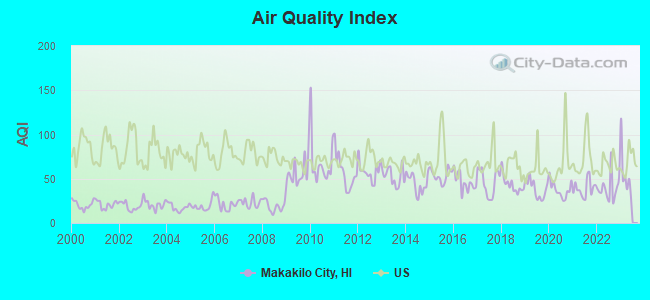
Air Quality Index (AQI) level in 2022 was 39.4. This is significantly better than average.
| City: | 39.4 |
| U.S.: | 72.6 |
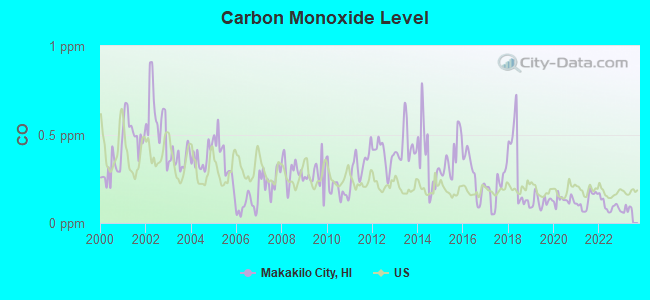
Carbon Monoxide (CO) [ppm] level in 2022 was 0.0980. This is significantly better than average. Closest monitor was 2.0 miles away from the city center.
| City: | 0.0980 |
| U.S.: | 0.2513 |
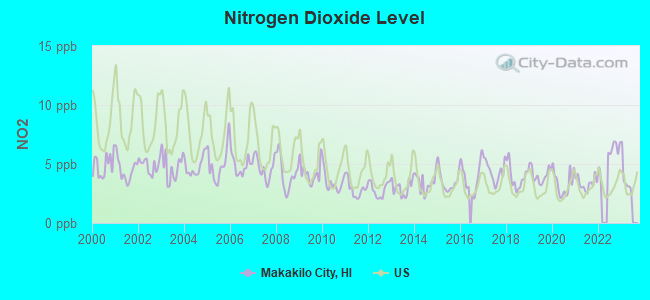
Nitrogen Dioxide (NO2) [ppb] level in 2022 was 5.88. This is about average. Closest monitor was 2.0 miles away from the city center.
| City: | 5.88 |
| U.S.: | 5.11 |
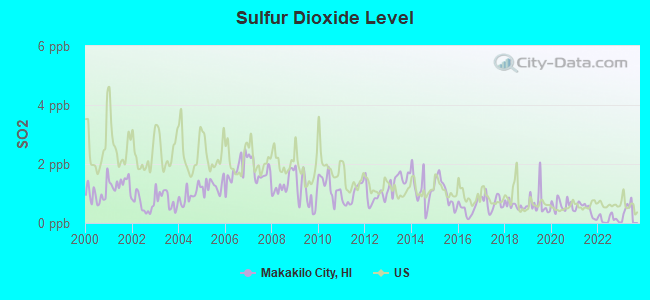
Sulfur Dioxide (SO2) [ppb] level in 2022 was 0.129. This is significantly better than average. Closest monitor was 0.3 miles away from the city center.
| City: | 0.129 |
| U.S.: | 1.515 |
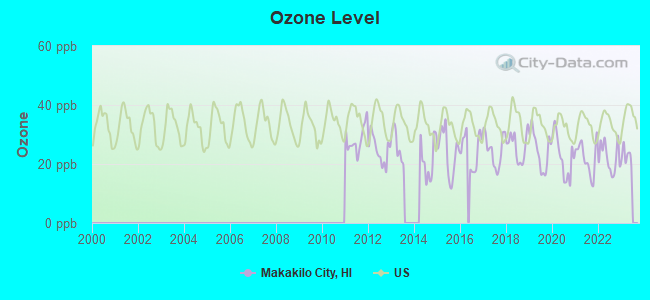
Ozone [ppb] level in 2022 was 22.1. This is significantly better than average. Closest monitor was 2.0 miles away from the city center.
| City: | 22.1 |
| U.S.: | 33.3 |
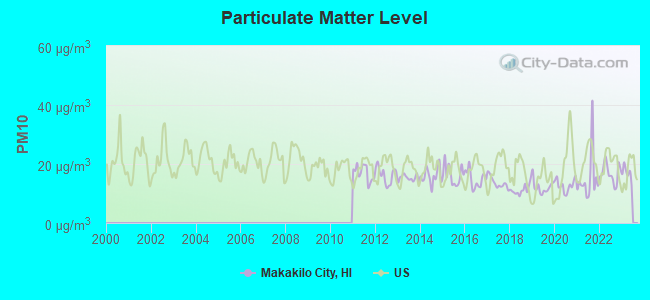
Particulate Matter (PM10) [µg/m3] level in 2022 was 16.9. This is about average. Closest monitor was 2.0 miles away from the city center.
| City: | 16.9 |
| U.S.: | 19.2 |
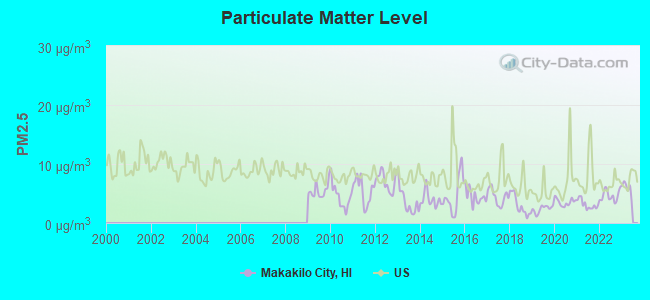
Particulate Matter (PM2.5) [µg/m3] level in 2022 was 4.65. This is significantly better than average. Closest monitor was 2.0 miles away from the city center.
| City: | 4.65 |
| U.S.: | 8.11 |
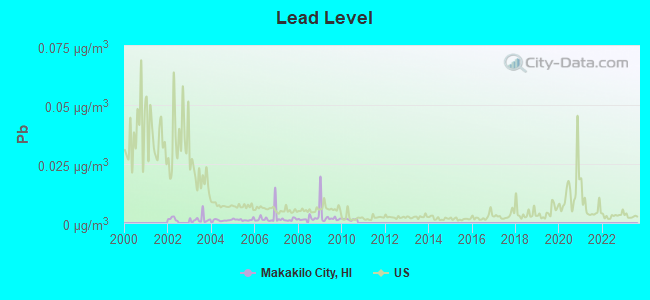
Lead (Pb) [µg/m3] level in 2010 was 0.00154. This is significantly better than average. Closest monitor was 8.3 miles away from the city center.
| City: | 0.00154 |
| U.S.: | 0.00931 |
Earthquake activity:
Makakilo City-area historical earthquake activity is significantly above Hawaii state average. It is 1071% greater than the overall U.S. average.On 11/29/1975 at 14:47:40, a magnitude 7.2 (6.0 MB, 7.1 MS, 7.2 UK, 7.2 MS, Class: Major, Intensity: VIII - XII) earthquake occurred 237.8 miles away from the city center, causing 2 deaths (2 shaking deaths)
On 8/21/1951 at 10:57:00, a magnitude 6.9 (6.9 UK, Class: Strong, Intensity: VII - IX) earthquake occurred 175.0 miles away from Makakilo City center
On 10/15/2006 at 17:07:49, a magnitude 6.7 (6.2 MB, 6.6 MS, 6.7 MW) earthquake occurred 170.8 miles away from the city center
On 10/15/2006 at 17:07:49, a magnitude 6.7 (6.7 MD, Depth: 23.7 mi) earthquake occurred 172.9 miles away from the city center
On 5/4/2018 at 22:32:54, a magnitude 6.9 (6.9 MW, Depth: 3.6 mi) earthquake occurred 244.9 miles away from the city center
On 11/16/1983 at 16:13:00, a magnitude 6.7 (6.4 MB, 6.7 MS, 6.7 MW) earthquake occurred 220.3 miles away from Makakilo City center, causing $6,000,000 total damage
Magnitude types: body-wave magnitude (MB), duration magnitude (MD), surface-wave magnitude (MS), moment magnitude (MW)
Natural disasters:
The number of natural disasters in Honolulu County (16) is near the US average (15).Major Disasters (Presidential) Declared: 10
Emergencies Declared: 1
Causes of natural disasters: Floods: 7, Storms: 7, Fires: 3, Mudslides: 3, Landslides: 2, Earthquake: 1, Flash Flood: 1, Heavy Rain: 1, Hurricane: 1, Tsunami Wave: 1, Typhoon: 1, Other: 1 (Note: some incidents may be assigned to more than one category).

Hospitals and medical centers near Makakilo City:
- FMC DIALYSIS SERVICES OF KAPOLEI (Dialysis Facility, about 3 miles away; KAPOLEI, HI)
- KAHI MOHALA (Hospital, about 5 miles away; EWA BEACH, HI)
- PEARL CITY NURSING HOME (Nursing Home, about 9 miles away; PEARL CITY, HI)
- WAIMANO TRAINING SCHOOL AND HOSPITAL (Nursing Home, about 10 miles away; PEARL CITY, HI)
- WAHIAWA GENERAL HOSPITAL (Nursing Home, about 11 miles away; WAHIAWA, HI)
- WAHIAWA GEN HOSP ICF (Nursing Home, about 11 miles away; WHIAWA, HI)
- FMC WAHIAWA DIALYSIS CENTER (Dialysis Facility, about 12 miles away; WAHIAWA, HI)
Colleges/universities with over 2000 students nearest to Makakilo City:
- Leeward Community College (about 8 miles; Pearl City, HI; Full-time enrollment: 4,589)
- Honolulu Community College (about 15 miles; Honolulu, HI; FT enrollment: 2,538)
- Hawaii Pacific University (about 16 miles; Honolulu, HI; FT enrollment: 5,506)
- University of Hawaii at Manoa (about 19 miles; Honolulu, HI; FT enrollment: 16,461)
- Chaminade University of Honolulu (about 19 miles; Honolulu, HI; FT enrollment: 2,610)
- Kapiolani Community College (about 20 miles; Honolulu, HI; FT enrollment: 5,069)
- Brigham Young University-Hawaii (about 23 miles; Laie, HI; FT enrollment: 3,527)
Points of interest:
Notable location: Honolulu Fire Department Station 35 Makakilo (A). Display/hide its location on the map
Church in Makakilo City: Saint Nicholas Episcopal Church (A). Display/hide its location on the map
Parks in Makakilo City include: Makakilo Heights Neighborhood Park (1), Makakilo Community Park (2), Maukalani Neighborhood Park (3), Makakilo Neighborhood Park (4), Mauka Lani Neighborhood Park (5). Display/hide their locations on the map
| This place: | 3.4 people |
| Hawaii: | 2.9 people |
| This place: | 82.7% |
| Whole state: | 71.7% |
| This place: | 6.2% |
| Whole state: | 5.8% |
Likely homosexual households (counted as self-reported same-sex unmarried-partner households)
- Lesbian couples: 0.4% of all households
- Gay men: 0.2% of all households
| This place: | 5.1% |
| Whole state: | 10.7% |
| This place: | 2.4% |
| Whole state: | 5.0% |
People in group quarters in Makakilo City in 2000:
- 15 people in other group homes
- 11 people in homes for the physically handicapped
- 6 people in homes for the mentally retarded
For population 15 years and over in Makakilo City:
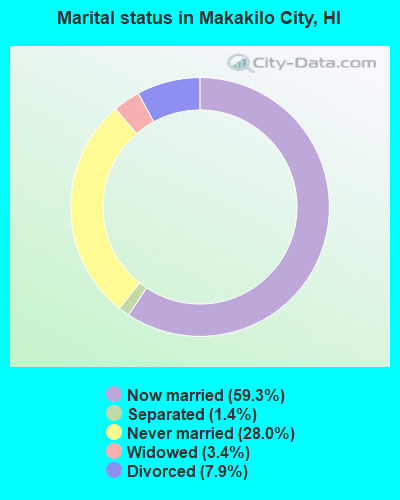
- Never married: 28.0%
- Now married: 59.3%
- Separated: 1.4%
- Widowed: 3.4%
- Divorced: 7.9%
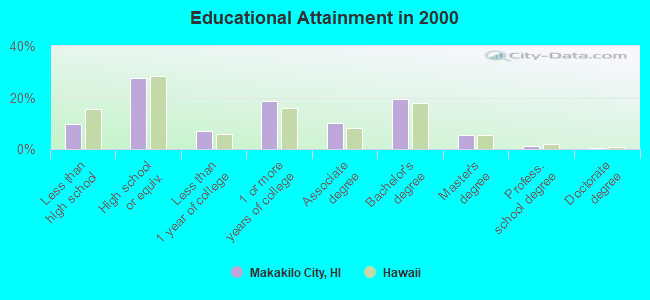
For population 25 years and over in Makakilo City:
- High school or higher: 90.1%
- Bachelor's degree or higher: 26.3%
- Graduate or professional degree: 6.8%
- Unemployed: 5.2%
- Mean travel time to work (commute): 35.3 minutes
| Here: | 9.4 |
| Hawaii average: | 12.8 |
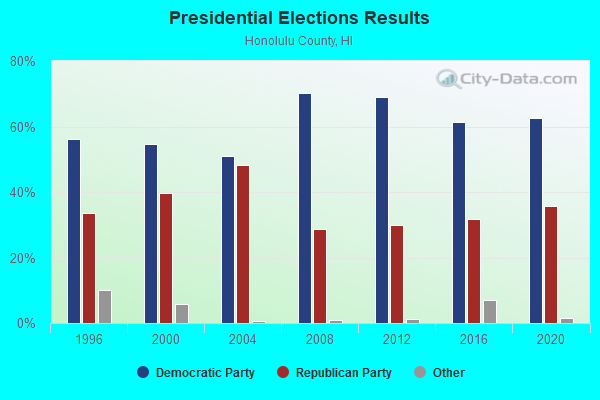
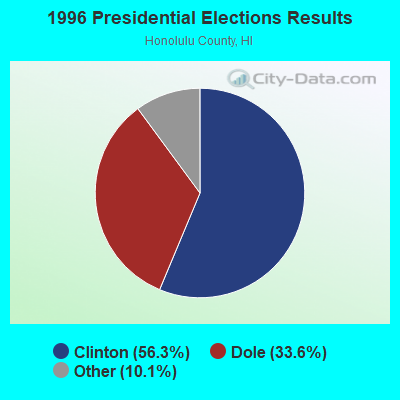
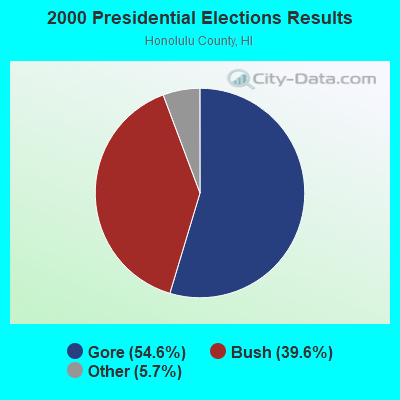
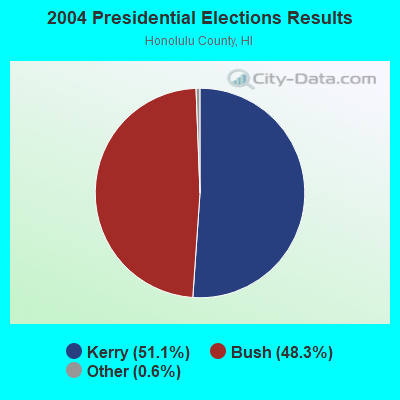
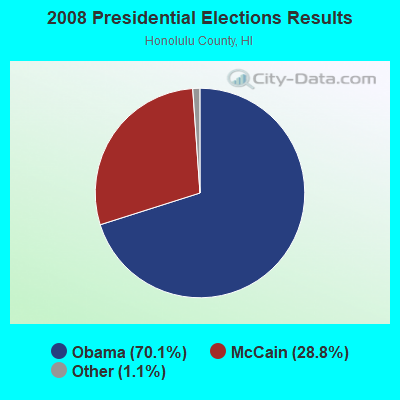
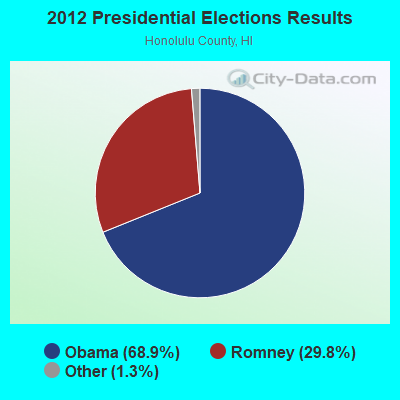
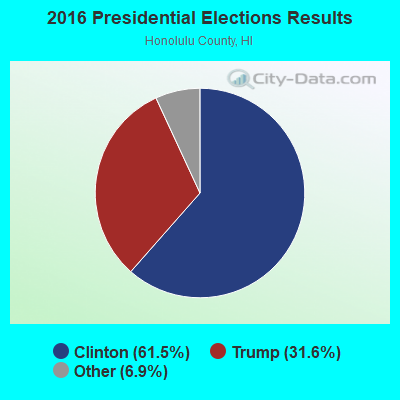
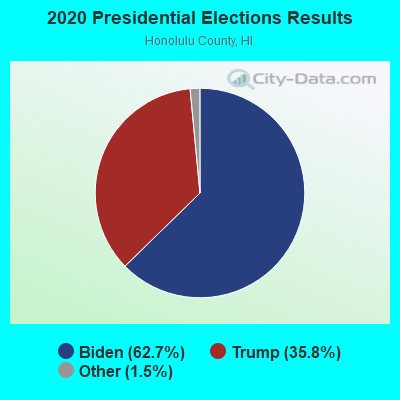
Graphs represent county-level data. Detailed 2008 Election Results
Religion statistics for Makakilo City, HI (based on Honolulu County data)
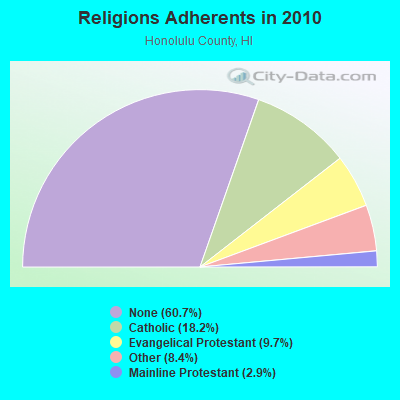
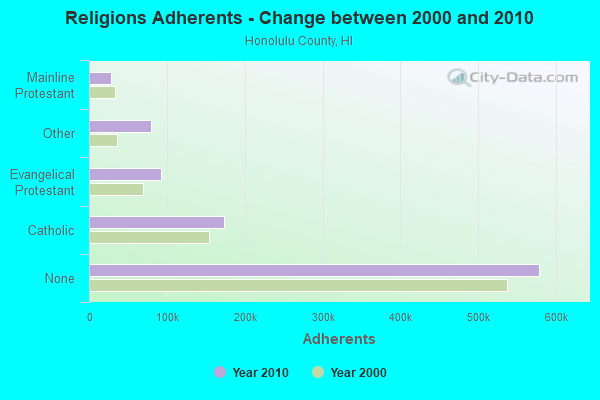
| Religion | Adherents | Congregations |
|---|---|---|
| Catholic | 173,716 | 39 |
| Evangelical Protestant | 92,310 | 382 |
| Other | 80,221 | 204 |
| Mainline Protestant | 28,013 | 115 |
| Orthodox | 300 | 4 |
| None | 578,647 | - |
Food Environment Statistics:
| Honolulu County: | 2.17 / 10,000 pop. |
| Hawaii: | 2.30 / 10,000 pop. |
| Honolulu County: | 0.10 / 10,000 pop. |
| Hawaii: | 0.09 / 10,000 pop. |
| Honolulu County: | 1.40 / 10,000 pop. |
| State: | 1.57 / 10,000 pop. |
| Honolulu County: | 1.57 / 10,000 pop. |
| Hawaii: | 1.72 / 10,000 pop. |
| Here: | 8.15 / 10,000 pop. |
| Hawaii: | 9.00 / 10,000 pop. |
| Honolulu County: | 8.3% |
| Hawaii: | 8.1% |
| This county: | 20.5% |
| Hawaii: | 20.8% |
| Honolulu County: | 8.9% |
| State: | 9.2% |
4.80% of this county's 2021 resident taxpayers lived in other counties in 2020 ($72,704 average adjusted gross income)
| Here: | 4.80% |
| Hawaii average: | 4.91% |
0.27% of residents moved from foreign countries ($4,064 average AGI)
Honolulu County: 0.27% Hawaii average: 0.19%
Top counties from which taxpayers relocated into this county between 2020 and 2021:
| from San Diego County, CA | |
| from Los Angeles County, CA | |
| from Hawaii County, HI |
5.90% of this county's 2020 resident taxpayers moved to other counties in 2021 ($71,643 average adjusted gross income)
| Here: | 5.90% |
| Hawaii average: | 5.53% |
0.21% of residents moved to foreign countries ($2,928 average AGI)
Honolulu County: 0.21% Hawaii average: 0.15%
Top counties to which taxpayers relocated from this county between 2020 and 2021:
| to Clark County, NV | |
| to San Diego County, CA | |
| to Hawaii County, HI |
Strongest AM radio stations in Makakilo City:
- KHNR (650 AM; 10 kW; HONOLULU, HI; Owner: SALEM MEDIA OF HAWAII, INC.)
- KHCM (940 AM; 10 kW; WAIPAHU, HI; Owner: SALEM MEDIA OF HAWAII, INC.)
- KJPN (1370 AM; 6 kW; PEARL CITY, HI; Owner: DIAMOND BROADCASTING CORPORATION)
- KSSK (590 AM; 8 kW; HONOLULU, HI; Owner: CAPSTAR TX LIMITED PARTNERSHIP)
- KORL (690 AM; 10 kW; HONOLULU, HI; Owner: NEW WAVE BROADCASTING, L.P.)
- KHVH (830 AM; 10 kW; HONOLULU, HI; Owner: CAPSTAR TX LIMITED PARTNERSHIP)
- KLHT (1040 AM; 10 kW; HONOLULU, HI; Owner: CALVARY CHAPEL OF HONOLULU, INC.)
- KGU (760 AM; 10 kW; HONOLULU, HI; Owner: SALEM MEDIA OF HAWAII, INC.)
- KUMU (1500 AM; 10 kW; HONOLULU, HI; Owner: MAVERICK MEDIA OF OAHU LICENSE LLC)
- KHBZ (990 AM; 5 kW; HONOLULU, HI; Owner: CAPSTAR TX LIMITED PARTNERSHIP)
- KNDI (1270 AM; 5 kW; HONOLULU, HI; Owner: BROADCAST HOUSE OF THE PACIFIC INC.)
- KWAI (1080 AM; 5 kW; HONOLULU, HI; Owner: RADIO HAWAII, INC.)
- KKEA (1420 AM; 5 kW; HONOLULU, HI; Owner: BLOW UP, LLC)
Strongest FM radio stations in Makakilo City:
- KAIM-FM (95.5 FM; HONOLULU, HI; Owner: SALEM MEDIA OF HAWAII, INC.)
- KSSK-FM (92.3 FM; WAIPAHU, HI; Owner: CAPSTAR TX LIMITED PARTNERSHIP)
- KPOI-FM (97.5 FM; HONOLULU, HI; Owner: NEW WAVE BROADCASTING, L.P.)
- KAHA (105.9 FM; HONOLULU, HI; Owner: KASA MOKU KA PAWA BROADCASTING, INC.)
- KCCN-FM (100.3 FM; HONOLULU, HI; Owner: CXR HOLDINGS, INC.)
- KGMZ-FM (107.9 FM; AIEA, HI; Owner: HONOLULU BROADCASTING, INC.)
- KINE-FM (105.1 FM; HONOLULU, HI; Owner: CXR HOLDINGS, INC.)
- KUCD (101.9 FM; PEARL CITY, HI; Owner: CAPSTAR TX LIMITED PARTNERSHIP)
- KQMQ-FM (93.1 FM; HONOLULU, HI; Owner: NEW WAVE BROADCASTING, L.P.)
- KDDB (102.7 FM; WAIPAHU, HI; Owner: NEW WAVE BROADCASTING, L.P.)
- KIPO (89.3 FM; HONOLULU, HI; Owner: HAWAII PUBLIC RADIO)
- KHUI (99.5 FM; HONOLULU, HI; Owner: NEW WAVE BROADCASTING, L.P.)
- KXME (104.3 FM; KANEOHE, HI; Owner: CXR HOLDINGS, INC.)
- KRTR-FM (96.3 FM; KAILUA, HI; Owner: CXR HOLDINGS, INC.)
- K215EH (90.9 FM; KAILUA, HI; Owner: CALVARY CHAPEL OF TWIN FALLS, INC.)
- K214CY (90.7 FM; MAILI, HI; Owner: EDUCATIONAL MEDIA FOUNDATION)
TV broadcast stations around Makakilo City:
- KWHE (Channel 14; HONOLULU, HI; Owner: LESEA BROADCASTING CORPORATION)
- KIKU (Channel 20; HONOLULU, HI; Owner: KHLS, INC.)
- KHLU-LP (Channel 60; HONOLULU, HI; Owner: HTV/HTN/HAWAIIAN TV NETWORK, LTD.)
- K54EX (Channel 54; HONOLULU, HI; Owner: CRAIG ALLYN JUE)
- KAAH (Channel 26; HONOLULU, HI; Owner: TRINITY BROADCASTING NETWORK)
- KALO (Channel 38; HONOLULU, HI; Owner: PACIFICA BROADCASTING COMPANY)
- KWBN (Channel 44; HONOLULU, HI; Owner: HO'ONA'AUAO COMMUNITY TV, INC.)
- KHON-TV (Channel 2; HONOLULU, HI; Owner: EMMIS TELEVISION LICENSE CORPORATION)
- KHHI-LP (Channel 48; HONOLULU, HI; Owner: EQUITY BROADCASTING CORPORATION)
- KGMB (Channel 9; HONOLULU, HI; Owner: EMMIS TELEVISION LICENSE CORPORATION)
- KITV (Channel 4; HONOLULU, HI; Owner: KITV HEARST-ARGYLE TV, INC. (CA CORP.))
- KHET (Channel 11; HONOLULU, HI; Owner: HAWAII PUBLIC TELEVISION FOUNDATION)
- KBFD (Channel 32; HONOLULU, HI; Owner: THE ALLEN BROADCASTING CORP.)
- KHNL (Channel 13; HONOLULU, HI; Owner: RAYCOM NATIONAL, INC.)
- K56EX (Channel 56; HONOLULU, HI; Owner: VICTOR AGMATA, JR.)
- KFVE (Channel 5; HONOLULU, HI; Owner: RAYCOM NATIONAL, INC.)
- National Bridge Inventory (NBI) Statistics
- 14Number of bridges
- 187ft / 56.8mTotal length
- $10,822,000Total costs
- 713,270Total average daily traffic
- 28,837Total average daily truck traffic
- 792,649Total future (year 2025) average daily traffic
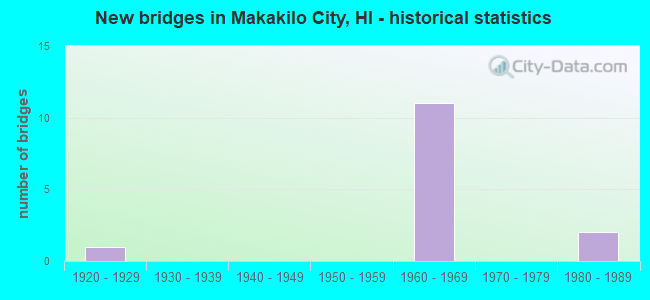
- New bridges - historical statistics
- 11920-1929
- 111960-1969
- 21980-1989
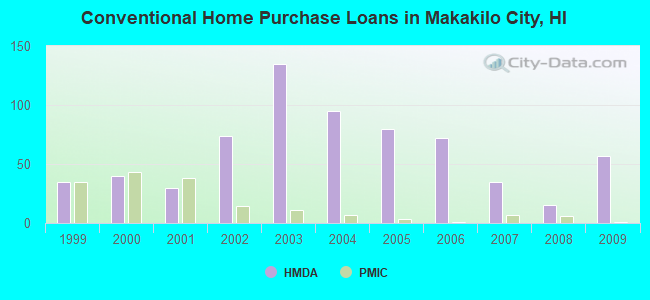
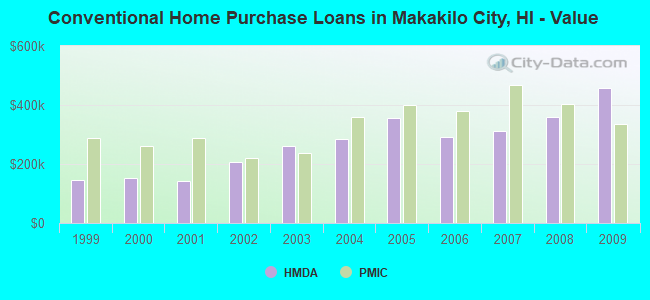
| Home Mortgage Disclosure Act Aggregated Statistics For Year 2009 (Based on 1 partial tract) | ||||||||||
| A) FHA, FSA/RHS & VA Home Purchase Loans | B) Conventional Home Purchase Loans | C) Refinancings | D) Home Improvement Loans | F) Non-occupant Loans on < 5 Family Dwellings (A B C & D) | ||||||
|---|---|---|---|---|---|---|---|---|---|---|
| Number | Average Value | Number | Average Value | Number | Average Value | Number | Average Value | Number | Average Value | |
| LOANS ORIGINATED | 68 | $460,866 | 57 | $456,859 | 204 | $364,338 | 14 | $303,974 | 60 | $475,428 |
| APPLICATIONS APPROVED, NOT ACCEPTED | 8 | $491,716 | 4 | $309,560 | 40 | $384,110 | 0 | $0 | 5 | $390,738 |
| APPLICATIONS DENIED | 14 | $458,696 | 7 | $329,437 | 49 | $382,919 | 2 | $149,430 | 10 | $368,674 |
| APPLICATIONS WITHDRAWN | 7 | $484,571 | 7 | $466,576 | 43 | $392,025 | 2 | $411,650 | 14 | $415,590 |
| FILES CLOSED FOR INCOMPLETENESS | 2 | $463,520 | 1 | $223,940 | 3 | $489,863 | 0 | $0 | 0 | $0 |
Detailed HMDA statistics for the following Tracts: 0086.04
| Private Mortgage Insurance Companies Aggregated Statistics For Year 2009 (Based on 1 partial tract) | ||||
| A) Conventional Home Purchase Loans | B) Refinancings | |||
|---|---|---|---|---|
| Number | Average Value | Number | Average Value | |
| LOANS ORIGINATED | 1 | $335,910 | 0 | $0 |
| APPLICATIONS APPROVED, NOT ACCEPTED | 0 | $0 | 1 | $493,980 |
| APPLICATIONS DENIED | 0 | $0 | 0 | $0 |
| APPLICATIONS WITHDRAWN | 0 | $0 | 0 | $0 |
| FILES CLOSED FOR INCOMPLETENESS | 0 | $0 | 0 | $0 |
Detailed PMIC statistics for the following Tracts: 0086.04
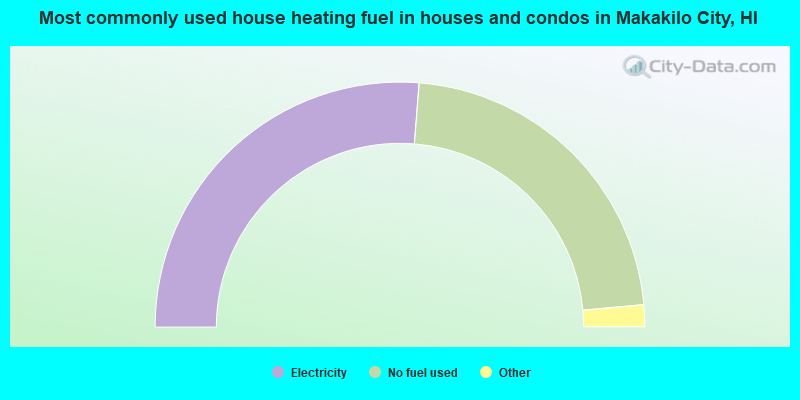
- 52.5%Electricity
- 44.6%No fuel used
- 2.2%Solar energy
- 0.5%Bottled, tank, or LP gas
- 0.2%Utility gas
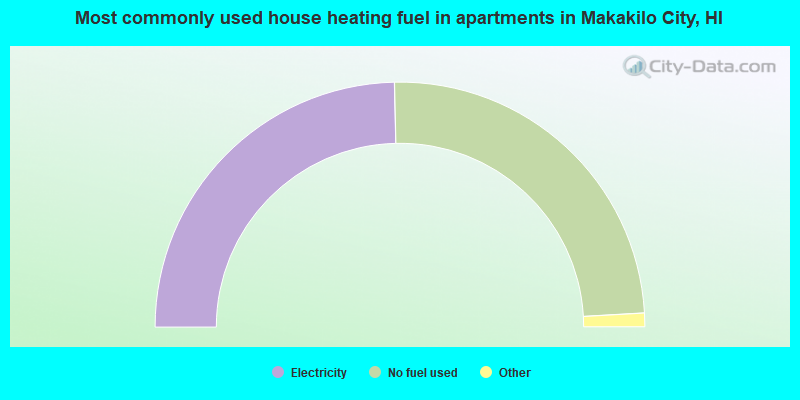
- 49.3%Electricity
- 48.9%No fuel used
- 1.0%Utility gas
- 0.8%Bottled, tank, or LP gas
Makakilo City compared to Hawaii state average:
- Unemployed percentage below state average.
- Median age below state average.
- Renting percentage significantly below state average.
- Length of stay since moving in significantly above state average.
- Number of rooms per house significantly below state average.
- House age significantly below state average.
Makakilo City on our top lists:
- #17 on the list of "Top 101 cities with largest percentage of females in industries: air transportation (population 5,000+)"
- #22 on the list of "Top 101 cities with largest percentage of females in occupations: customer service representatives (population 5,000+)"
- #26 on the list of "Top 101 cities with largest percentage of males in industries: social assistance (population 5,000+)"
- #31 on the list of "Top 101 cities with largest percentage of females in occupations: air transportation workers (population 5,000+)"
- #31 on the list of "Top 101 cities with largest percentage of males in industries: office supplies and stationery stores (population 5,000+)"
- #31 on the list of "Top 101 cities with largest percentage of females in industries: sporting goods, camera, and hobby and toy stores (population 5,000+)"
- #43 on the list of "Top 101 cities with largest percentage of males in occupations: pipelayers, plumbers, pipefitters, and steamfitters (population 5,000+)"
- #45 on the list of "Top 101 cities with largest percentage of females in occupations: vehicle and mobile equipment mechanics, installers, and repairers (population 5,000+)"
- #46 on the list of "Top 101 cities with largest percentage of females in occupations: accountants and auditors (population 5,000+)"
- #48 on the list of "Top 101 cities with largest percentage of females in industries: vending machine operators (population 5,000+)"
- #52 on the list of "Top 101 cities that people commute from (largest negative percentage daily daytime population change due to commuting) (population 5,000+)"
- #52 on the list of "Top 101 cities with largest percentage of males in occupations: electrical equipment mechanics and other installation, maintenance, and repair occupations including supervisors (population 5,000+)"
- #63 on the list of "Top 101 cities with largest percentage of females in industries: jewelry, luggage, and leather goods stores (population 5,000+)"
- #68 on the list of "Top 101 cities with largest percentage of males in industries: metals and minerals, except petroleum, merchant wholesalers (population 5,000+)"
- #70 on the list of "Top 101 cities with largest percentage of females in industries: alcoholic beverages merchant wholesalers (population 5,000+)"
- #79 on the list of "Top 101 cities with largest percentage of males in industries: clothing and accessories, including shoe, stores (population 5,000+)"
- #81 on the list of "Top 101 cities with largest percentage of males in industries: air transportation (population 5,000+)"
- #92 on the list of "Top 101 cities with largest percentage of females in industries: other transportation, and support activities, and couriers (population 5,000+)"
- #93 on the list of "Top 100 low-educated but high-earning cities (pop. 5,000+)"
- #101 (96707) on the list of "Top 101 zip codes with the largest percentage of Portuguese first ancestries (pop 5,000+)"
- #7 on the list of "Top 101 counties with the lowest average weight of females"
- #15 on the list of "Top 101 counties with the highest ground withdrawal of fresh water for public supply"
- #21 on the list of "Top 101 counties with the most Other congregations"
- #25 on the list of "Top 101 counties with the most Other adherents"
- #25 on the list of "Top 101 counties with the highest carbon monoxide air pollution readings in 2012 (ppm)"