Estimated zip code population in 2022: 47,288 Zip code population in 2010: 40,888 Zip code population in 2000: 34,718
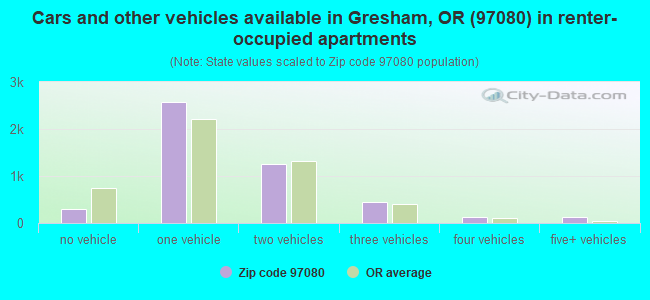
Houses and condos: 17,623 Renter-occupied apartments: 4,834
% of renters here:
28%
State:
37%
March 2022 cost of living index in zip code 97080: 103.4 (near average, U.S. average is 100)
Land area: 21.6 sq. mi. Water area: 0.2 sq. mi.
Population density: 2,193 people per square mile
(low).
OSM Map
General Map
Google Map
MSN Map
OSM Map
General Map
Google Map
MSN Map
OSM Map
General Map
Google Map
MSN Map
OSM Map
General Map
Google Map
MSN Map
Please wait while loading the map...
Real estate property taxes paid for housing units in 2022:
This zip code:
0.9% ($4,476)
Oregon:
0.8% ($3,646)
Median real estate property taxes paid for housing units with mortgages in 2022: $4,471 (0.9%) Median real estate property taxes paid for housing units with no mortgage in 2022: $4,491 (0.9%)
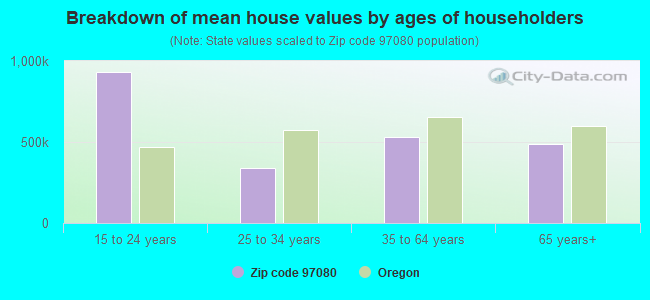
Estimated median house/condo value in 2022: $513,369
97080:
$513,369
Oregon:
$475,600
According to our research of Oregon and other state lists, there were 9 registered sex offenders living in 97080 zip code as of April 26, 2024. The ratio of all residents to sex offenders in zip code 97080 is 4,788 to 1. The ratio of registered sex offenders to all residents in this zip code is lower than the state average.
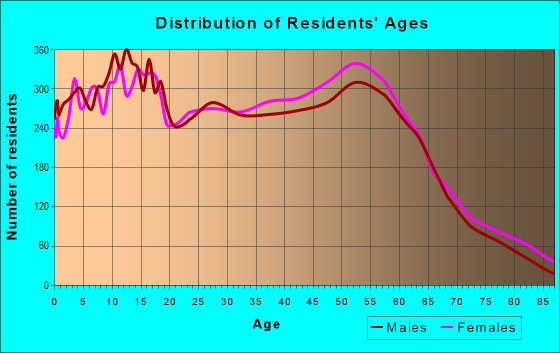
Median resident age:
This zip code:
39.8 years
Oregon median age:
40.5 years
Average household size:
This zip code:
2.7 people
Oregon:
2.4 people
Averages for the 2020 tax year for zip code 97080, filed in 2021:
Average Adjusted Gross Income (AGI) in 2020: $67,932 (Individual Income Tax Returns)
Here:
$67,932
State:
$76,001
Salary/wage: $57,172 (reported on 83.5% of returns)
Here:
$57,172
State:
$61,959
(% of AGI for various income ranges: 1240.6% for AGIs below $25k, 3743.7% for AGIs $25k-50k, 6737.4% for AGIs $50k-75k, 9592.5% for AGIs $75k-100k, 19637.0% for AGIs $100k-200k, 69765.9% for AGIs over 200k)
Taxable interest for individuals: $972 (reported on 31.4% of returns)
This zip code:
$972
Oregon:
$1,628
(% of AGI for various income ranges: 12.2% for AGIs below $25k, 13.5% for AGIs $25k-50k, 28.7% for AGIs $50k-75k, 36.2% for AGIs $75k-100k, 95.1% for AGIs $100k-200k, 1371.8% for AGIs over 200k)
Ordinary dividends: $3,841 (reported on 15.2% of returns)
Here:
$3,841
State:
$7,165
(% of AGI for various income ranges: 18.9% for AGIs below $25k, 28.1% for AGIs $25k-50k, 42.4% for AGIs $50k-75k, 91.2% for AGIs $75k-100k, 196.7% for AGIs $100k-200k, 2467.1% for AGIs over 200k)
Net capital gain/loss in AGI: +$11,310 (reported on 14.7% of returns)
Here:
+$11,310
State:
+$23,403
(% of AGI for various income ranges: 7.5% for AGIs below $25k, 17.1% for AGIs $25k-50k, 62.6% for AGIs $50k-75k, 131.0% for AGIs $75k-100k, 430.8% for AGIs $100k-200k, 13124.7% for AGIs over 200k)
Profit/loss from business: +$14,531 (reported on 14.0% of returns)
Here:
+$14,531
State:
+$16,511
(% of AGI for various income ranges: 120.4% for AGIs below $25k, 185.2% for AGIs $25k-50k, 262.1% for AGIs $50k-75k, 303.2% for AGIs $75k-100k, 531.1% for AGIs $100k-200k, 5568.2% for AGIs over 200k)
Taxable individual retirement arrangement distribution: $19,331 (reported on 8.7% of returns)
97080:
$19,331
Oregon:
$20,730
(% of AGI for various income ranges: 48.3% for AGIs below $25k, 90.4% for AGIs $25k-50k, 208.9% for AGIs $50k-75k, 373.5% for AGIs $75k-100k, 691.8% for AGIs $100k-200k, 3327.6% for AGIs over 200k)
Self-employed (Keogh) retirement plans: $18,250 (reported on 0.3% of returns)
97080:
$18,250
Oregon:
$22,884
(% of AGI for various income ranges: 27.8% for AGIs $100k-200k, 324.7% for AGIs over 200k)
Total itemized deductions: $28,216 (reported on 14.1% of returns)
Here:
$28,216
State:
$31,050
(% of AGI for various income ranges: 70.6% for AGIs below $25k, 179.9% for AGIs $25k-50k, 541.3% for AGIs $50k-75k, 1015.1% for AGIs $75k-100k, 1631.1% for AGIs $100k-200k, 8211.2% for AGIs over 200k)
Charity contributions: $7,283 (reported on 10.7% of returns)
Here:
$7,283
State:
$8,791
(% of AGI for various income ranges: 5.1% for AGIs below $25k, 22.8% for AGIs $25k-50k, 57.9% for AGIs $50k-75k, 140.5% for AGIs $75k-100k, 319.4% for AGIs $100k-200k, 3288.8% for AGIs over 200k)
Taxes paid: $8,536 (reported on 14.1% of returns)
97080:
$8,536
State:
$8,487
(% of AGI for various income ranges: 16.1% for AGIs below $25k, 49.2% for AGIs $25k-50k, 183.5% for AGIs $50k-75k, 339.3% for AGIs $75k-100k, 534.9% for AGIs $100k-200k, 1651.2% for AGIs over 200k)
Earned income credit: $2,144 (reported on 11.7% of returns)
Here:
$2,144
State:
$1,977
(% of AGI for various income ranges: 72.1% for AGIs below $25k, 57.0% for AGIs $25k-50k, 1.4% for AGIs $50k-75k)
Percentage of individuals using paid preparers for their 2020 taxes: 92.4%
Here:
92%
State:
93%
(% for various income ranges: 91.4% for AGIs below $25k, 92.6% for AGIs $25k-50k, 93.3% for AGIs $50k-75k, 92.8% for AGIs $75k-100k, 92.4% for AGIs $100k-200k, 94.2% for AGIs over 200k)
Averages for the 2012 tax year for zip code 97080, filed in 2013:
Average Adjusted Gross Income (AGI) in 2012: $56,378 (Individual Income Tax Returns)
Here:
$56,378
State:
$57,845
Salary/wage: $47,802 (reported on 85.6% of returns)
Here:
$47,802
State:
$47,723
(% of AGI for various income ranges: 77.0% for AGIs below $25k, 80.1% for AGIs $25k-50k, 76.4% for AGIs $50k-75k, 76.7% for AGIs $75k-100k, 76.3% for AGIs $100k-200k, 40.9% for AGIs over 200k)
Taxable interest for individuals: $1,213 (reported on 29.4% of returns)
This zip code:
$1,213
Oregon:
$1,848
(% of AGI for various income ranges: 0.9% for AGIs below $25k, 0.3% for AGIs $25k-50k, 0.5% for AGIs $50k-75k, 0.5% for AGIs $75k-100k, 0.6% for AGIs $100k-200k, 1.4% for AGIs over 200k)
Ordinary dividends: $3,567 (reported on 16.4% of returns)
Here:
$3,567
State:
$5,987
(% of AGI for various income ranges: 1.2% for AGIs below $25k, 0.6% for AGIs $25k-50k, 0.6% for AGIs $50k-75k, 0.6% for AGIs $75k-100k, 0.7% for AGIs $100k-200k, 3.2% for AGIs over 200k)
Net capital gain/loss in AGI: +$7,856 (reported on 13.6% of returns)
Here:
+$7,856
State:
+$13,095
(% of AGI for various income ranges: 0.2% for AGIs $25k-50k, 0.2% for AGIs $50k-75k, 0.5% for AGIs $75k-100k, 0.9% for AGIs $100k-200k, 11.6% for AGIs over 200k)
Profit/loss from business: +$11,468 (reported on 13.1% of returns)
Here:
+$11,468
State:
+$13,871
(% of AGI for various income ranges: 6.2% for AGIs below $25k, 3.4% for AGIs $25k-50k, 2.2% for AGIs $50k-75k, 2.2% for AGIs $75k-100k, 1.7% for AGIs $100k-200k, 3.2% for AGIs over 200k)
Taxable individual retirement arrangement distribution: $15,710 (reported on 9.9% of returns)
97080:
$15,710
Oregon:
$16,036
(% of AGI for various income ranges: 2.9% for AGIs below $25k, 2.2% for AGIs $25k-50k, 2.7% for AGIs $50k-75k, 2.7% for AGIs $75k-100k, 2.9% for AGIs $100k-200k, 3.1% for AGIs over 200k)
Self-employment retirement plans: $11,050 (reported on 0.3% of returns)
97080:
$11,050
Oregon:
$19,462
Total itemized deductions: $22,775 (25% of AGI, reported on 43.4% of returns)
Here:
$22,775
State:
$24,430
Here:
24.5% of AGI
State:
23.2% of AGI
(% of AGI for various income ranges: 12.9% for AGIs below $25k, 12.6% for AGIs $25k-50k, 18.9% for AGIs $50k-75k, 20.0% for AGIs $75k-100k, 19.9% for AGIs $100k-200k, 15.8% for AGIs over 200k)
Charity contributions: $3,423 (reported on 36.2% of returns)
Here:
$3,423
State:
$3,648
(% of AGI for various income ranges: 1.0% for AGIs below $25k, 1.5% for AGIs $25k-50k, 2.1% for AGIs $50k-75k, 2.4% for AGIs $75k-100k, 2.5% for AGIs $100k-200k, 2.8% for AGIs over 200k)
Taxes paid: $9,128 (reported on 43.0% of returns)
97080:
$9,128
State:
$10,269
(% of AGI for various income ranges: 2.5% for AGIs below $25k, 3.6% for AGIs $25k-50k, 6.4% for AGIs $50k-75k, 7.7% for AGIs $75k-100k, 8.9% for AGIs $100k-200k, 9.1% for AGIs over 200k)
Earned income credit: $2,148 (reported on 15.3% of returns)
Here:
$2,148
State:
$2,021
(% of AGI for various income ranges: 5.2% for AGIs below $25k, 1.2% for AGIs $25k-50k)
Percentage of individuals using paid preparers for their 2012 taxes: 47.5%
Here:
48%
State:
47%
(% for various income ranges: 39.6% for AGIs below $25k, 46.7% for AGIs $25k-50k, 51.4% for AGIs $50k-75k, 52.2% for AGIs $75k-100k, 57.1% for AGIs $100k-200k, 78.1% for AGIs over 200k)
Averages for the 2004 tax year for zip code 97080, filed in 2005:
Average Adjusted Gross Income (AGI) in 2004: $49,296 (Individual Income Tax Returns)
Here:
$49,296
State:
$46,788
Salary/wage: $44,089 (reported on 86.7% of returns)
Here:
$44,089
State:
$39,788
(% of AGI for various income ranges: 141.4% for AGIs below $10k, 76.3% for AGIs $10k-25k, 81.3% for AGIs $25k-50k, 80.9% for AGIs $50k-75k, 83.6% for AGIs $75k-100k, 68.1% for AGIs over 100k)
Taxable interest for individuals: $1,543 (reported on 44.0% of returns)
This zip code:
$1,543
Oregon:
$2,126
(% of AGI for various income ranges: 8.1% for AGIs below $10k, 2.3% for AGIs $10k-25k, 1.1% for AGIs $25k-50k, 1.0% for AGIs $50k-75k, 0.8% for AGIs $75k-100k, 1.7% for AGIs over 100k)
Taxable dividends: $1,924 (reported on 22.8% of returns)
Here:
$1,924
State:
$3,427
(% of AGI for various income ranges: 4.2% for AGIs below $10k, 1.2% for AGIs $10k-25k, 0.7% for AGIs $25k-50k, 0.6% for AGIs $50k-75k, 0.7% for AGIs $75k-100k, 1.2% for AGIs over 100k)
Net capital gain/loss: +$8,418 (reported on 19.6% of returns)
Here:
+$8,418
State:
+$12,447
(% of AGI for various income ranges: -1.0% for AGIs below $10k, 0.7% for AGIs $10k-25k, 0.6% for AGIs $25k-50k, 0.8% for AGIs $50k-75k, 1.1% for AGIs $75k-100k, 8.4% for AGIs over 100k)
Profit/loss from business: +$10,308 (reported on 13.7% of returns)
Here:
+$10,308
State:
+$11,682
(% of AGI for various income ranges: -15.1% for AGIs below $10k, 4.8% for AGIs $10k-25k, 3.4% for AGIs $25k-50k, 2.6% for AGIs $50k-75k, 2.3% for AGIs $75k-100k, 3.2% for AGIs over 100k)
IRA payment deduction: $3,087 (reported on 2.8% of returns)
97080:
$3,087
Oregon:
$3,035
(% of AGI for various income ranges: 0.3% for AGIs $10k-25k, 0.2% for AGIs $25k-50k, 0.2% for AGIs $50k-75k, 0.1% for AGIs $75k-100k, 0.1% for AGIs over 100k)
Self-employed pension: $9,447 (reported on 1.0% of returns)
Here:
$9,447
Oregon:
$14,224
(% of AGI for various income ranges: 0.2% for AGIs $25k-50k, 0.1% for AGIs $50k-75k, 0.1% for AGIs $75k-100k, 0.3% for AGIs over 100k)
Total itemized deductions: $20,559 (27% of AGI, reported on 51.3% of returns)
Here:
$20,559
State:
$20,209
Here:
26.8% of AGI
State:
24.7% of AGI
(% of AGI for various income ranges: 28.0% for AGIs below $10k, 15.2% for AGIs $10k-25k, 19.6% for AGIs $25k-50k, 24.1% for AGIs $50k-75k, 24.0% for AGIs $75k-100k, 20.1% for AGIs over 100k)
Charity contributions deductions: $2,978 (4% of AGI, reported on 45.4% of returns)
Here:
$2,978
State:
$3,145
Here:
3.7% of AGI
State:
3.6% of AGI
(% of AGI for various income ranges: 2.0% for AGIs below $10k, 1.5% for AGIs $10k-25k, 2.2% for AGIs $25k-50k, 2.8% for AGIs $50k-75k, 2.8% for AGIs $75k-100k, 3.2% for AGIs over 100k)
Total tax: $6,216 (reported on 77.8% of returns)
97080:
$6,216
State:
$7,148
(% of AGI for various income ranges: 4.1% for AGIs below $10k, 4.3% for AGIs $10k-25k, 6.3% for AGIs $25k-50k, 7.4% for AGIs $50k-75k, 8.9% for AGIs $75k-100k, 15.1% for AGIs over 100k)
Earned income credit: $1,694 (reported on 11.1% of returns)
Here:
$1,694
State:
$1,605
Percentage of individuals using paid preparers for their 2004 taxes: 52.7%
Here:
53%
State:
53%
(% for various income ranges: 40.3% for AGIs below $10k, 51.2% for AGIs $10k-25k, 53.2% for AGIs $25k-50k, 58.0% for AGIs $50k-75k, 55.7% for AGIs $75k-100k, 63.5% for AGIs over 100k)
Likely homosexual households (counted as self-reported same-sex unmarried-partner households)
Lesbian couples: 0.3% of all households
Gay men: 0.5% of all households
Household received Food Stamps/SNAP in the past 12 months: 1,910 Household did not receive Food Stamps/SNAP in the past 12 months: 15,100
Women who had a birth in the past 12 months: 574 (464 now married, 110 unmarried) Women who did not have a birth in the past 12 months: 10,423 (4,517 now married, 5,890 unmarried)
Housing units in zip code 97080 with a mortgage: 9,047 (953 second mortgage, 32 home equity loan, 795 both second mortgage and home equity loan) Houses without a mortgage: 174
Median monthly owner costs for units with a mortgage: $2,186 Median monthly owner costs for units without a mortgage: $725
Residents with income below the poverty level in 2022:
This zip code:
6.9%
Whole state:
12.1%
Residents with income below 50% of the poverty level in 2022:
This zip code:
3.1%
Whole state:
6.2%
Median number of rooms in houses and condos:
Here:
6.7
State:
6.2
Median number of rooms in apartments:
Here:
4.2
State:
4.0
Notable locations in this zip code not listed on our city pages
Notable locations in zip code 97080: Hogan (A), Camp Collins (B), Oxbow Park Boat Ramp (C), Linnemann (D), Department of Motor Vehicles Gresham (E), Gresham Fire and Emergency Services Station 76 (F), Gresham Fire and Emergency Services Station 73 (G), Gresham Public Works Department Operations and Maintenance (H), Gresham Little Theatre (I). Display/hide their locations on the map
Churches in zip code 97080 include: Mount Hood Christian Center (A), Powell Valley Covenant Church (B), Pleasant Valley Community Baptist Church (C), River Hills Church (D), Free Methodist Church (E), Lighthouse Community Church (F). Display/hide their locations on the map
Lakes and reservoirs: Glendale Ponds (A), Binford Reservoir (B), Butler Creek Reservoir (C), Sesters Reservoirs (D), Lusted Reservoir (E), Sester Reservoir Number 1 (F). Display/hide their locations on the map
Creeks: North Fork Johnson Creek (A), Mitchell Creek (B), Butler Creek (C), Middle Fork Beaver Creek (D), Lusted Creek (E). Display/hide their locations on the map
Parks in zip code 97080 include: Springwater Trail (1), Butler Creek Park (2), Maple Park (3), Oxbow Regional Park (4), Hollybrook Park (5), Jenne Butte Park (6), Kane Road Park (7), Main City Park (8), Southeast Community Park (9). Display/hide their locations on the map
7,464 married couples with children.
2,487 single-parent households (863 men, 1,624 women).
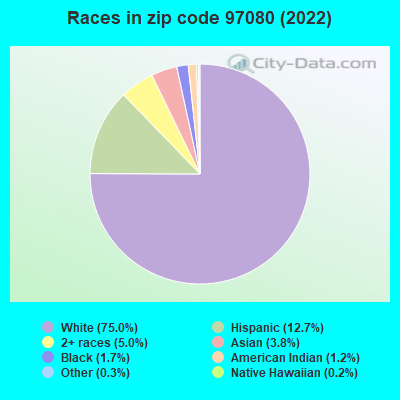
81.9% of residents of 97080 zip code speak English at home.
7.1% of residents speak Spanish at home (66% very well, 14% well, 7% not well, 13% not at all).
4.7% of residents speak other Indo-European language at home (58% very well, 21% well, 18% not well, 2% not at all).
3.2% of residents speak Asian or Pacific Island language at home (59% very well, 24% well, 14% not well, 4% not at all).
3.4% of residents speak other language at home (55% very well, 42% well, 1% not well, 2% not at all).
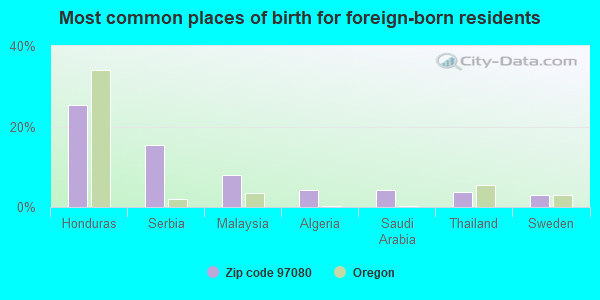
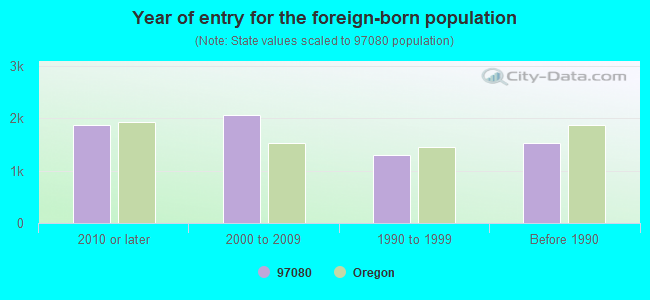
Foreign born population: 5,728 (12.1%) (59.2% of them are naturalized citizens)
Facilities with environmental interests located in this zip code:
GRESHAM FORD (1940 EAST POWELL BOULEVARD in GRESHAM, OR)
STATE MASTER (Oregon inspections and permits database) - OR-HWMS-321, CESQG Conditionally Exempt Small Quantity Generators, less than 100 kg/month of hazardous waste (Resource Conservation and Recovery Act (tracking hazardous waste)) - notification Business SIC classification: MOTOR VEHICLE DEALERS (NEW AND USED) Business NAICS classification: GENERAL AUTOMOTIVE REPAIR.; AUTOMOTIVE BODY, PAINT, AND INTERIOR REPAIR AND MAINTENANCE. Organizations: FORD MOTOR COMPANY (CONTACT/OWNER)
, FORD MOTOR COMPANY (HAZARDOUS WASTE LEGAL OWNER)
, GRESHAM FORD DBA BRYAN BICKMORE S (HAZARDOUS WASTE OPERATOR)
Alternative names: MCROBERT MOTOR CO., INC. - DBA
GLENDALE FARMS INC (32801 SE LUSTED RD in GRESHAM, OR)
STATE MASTER (Oregon inspections and permits database) - OR-HWMS-737, SQG (Resource Conservation and Recovery Act (tracking hazardous waste)) Business SIC classification: GENERAL FARMS, PRIMARILY LIVESTOCK AND ANIMAL SPECIALTIES
GRESHAM CITY OF OPERATIONS CENTER (2123 SE HOGAN RD in GRESHAM, OR)
STATE MASTER (Oregon inspections and permits database) - HWMS-2355-, CESQG Conditionally Exempt Small Quantity Generators, less than 100 kg/month of hazardous waste (Resource Conservation and Recovery Act (tracking hazardous waste)) - notification Business SIC classification: AIR AND WATER RESOURCE AND SOLID WASTE MANAGEMENT Organizations: CITY OF GRESHAM OPERATIONS CENTER (CONTACT/ HAZARDOUS WASTE)
, CITY OF GRESHAM OPERATIONS CENTER (HAZARDOUS WASTE SITE CONTACT)
HIGHLAND CLEANERS (901 E SW HIGHLAND DRIVE in GRESHAM, OR)
CRITERIA AND HAZARDOUS AIR POLLUTANT INVENTORY (Inventory of air pollution sources) STATE MASTER (Oregon inspections and permits database) - OR-HWMS-1183, CESQG Conditionally Exempt Small Quantity Generators, less than 100 kg/month of hazardous waste (Resource Conservation and Recovery Act (tracking hazardous waste)) - notification Business SIC classification: POWER LAUNDRIES, FAMILY AND COMMERCIAL; DRYCLEANING PLANTS, EXCEPT RUG CLEANING Business NAICS classification: DRYCLEANING AND LAUNDRY SERVICES (EXCEPT COIN-OPERATED). Organizations: JONG BAE KO (CONTACT/OPERATOR)
GRESHAM SANITARY SERVICE INC (2131 NW BIRDSDALE AVE in GRESHAM, OR)
STATE MASTER (Oregon inspections and permits database) - OR-HWMS-3050, CESQG Conditionally Exempt Small Quantity Generators, less than 100 kg/month of hazardous waste (Resource Conservation and Recovery Act (tracking hazardous waste)) - notification Business SIC classification: REFUSE SYSTEMS Business NAICS classification: HAZARDOUS WASTE TREATMENT AND DISPOSAL.; SOLID WASTE LANDFILL.; SOLID WASTE COMBUSTORS AND INCINERATORS.; OTHER NONHAZARDOUS WASTE TREATMENT AND DISPOSAL. Organizations: GRESHAM SANITARY SERVICE, INC. (CONTACT/ HAZARDOUS WASTE)
, BECKY J LEHL (CONTACT/OWNER)
BUD BELLAMY AND SON, INC (2053 SE 1ST ST in GRESHAM, OR)
ENFORCEMENT/COMPLIANCE ACTIVITY (Integrated Compliance Information System) STATE MASTER (Oregon inspections and permits database) - OR-LUST-26-92-0357, LEAKING STORAGE TANK, OR-UST-BCDFA, OR-UST-BCDFB, Organizations: O.B. BLAKELY CONSTRUCTION CO., INC. (CONTACT/GENERAL)
DEXTER D MCCARTY MIDLLE (1400 SE 5TH ST in GRESHAM, OR)
(National Center for Education Statistics) - STATE ID-932 Organizations: GRESHAM-BARLOW SCH DIST 10J (SCHOOL DISTRICT)
EAST ORIENT ELEM. SCHOOL (7431 SE 302ND AVE in GRESHAM, OR)
(National Center for Education Statistics) - STATE ID-941 Organizations: GRESHAM-BARLOW SCH DIST 10J (SCHOOL DISTRICT)
GORDON RUSSELL MIDDLE SCHOOL (3625 E POWELL VALLEY RD in GRESHAM, OR)
(National Center for Education Statistics) - STATE ID-934 Organizations: GRESHAM-BARLOW SCH DIST 10J (SCHOOL DISTRICT)
HOGAN CEDARS ELEM. SCHOOL (1770 SE FLEMING AVE in GRESHAM, OR)
(National Center for Education Statistics) - STATE ID-3543 Organizations: GRESHAM-BARLOW SCH DIST 10J (SCHOOL DISTRICT)
HOLLYDALE ELEM. SCHOOL (505 SW BIRDSDALE AVE in GRESHAM, OR)
(National Center for Education Statistics) - STATE ID-937 Organizations: GRESHAM-BARLOW SCH DIST 10J (SCHOOL DISTRICT)
CHEVRON FOOD MART (28210 ORIENT DR. SE in GRESHAM, OR)
ENFORCEMENT/COMPLIANCE ACTIVITY (Integrated Compliance Information System)
Housing units lacking complete plumbing facilities: 0.2% Housing units lacking complete kitchen facilities: 0.5%
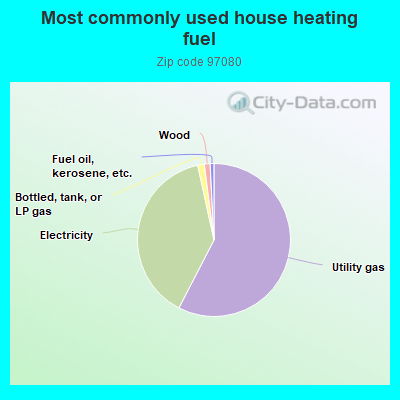
57.3%Utility gas
38.8%Electricity
1.4%Bottled, tank, or LP gas
1.2%Wood
0.8%Fuel oil, kerosene, etc.
Population in 1990: 25,232. Population change in the 1990s: +9,486 (+37.6%).
Place of birth for U.S.-born residents:
This state: 25,797
Northeast: 984
Midwest: 2,613
South: 1,722
West: 9,382
48% of the 97080 zip code residents lived in the same house 5 years ago. Out of people who lived in different houses, 62% lived in this county. Out of people who lived in different counties, 50% lived in Oregon.
91% of the 97080 zip code residents lived in the same house 1 year ago. Out of people who lived in different houses, 54% moved from this county. Out of people who lived in different houses, 31% moved from different county within same state. Out of people who lived in different houses, 15% moved from different state. Out of people who lived in different houses, 3% moved from abroad.
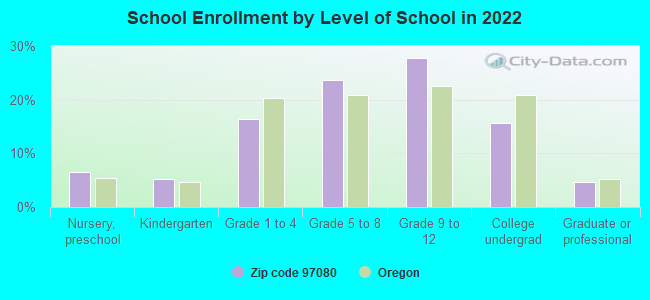
Private vs. public school enrollment:
Students in private schools in grades 1 to 8 (elementary and middle school): 273
Here:
6.3%
Oregon:
13.7%
Students in private schools in grades 9 to 12 (high school): 297
Here:
9.7%
Oregon:
8.8%
Students in private undergraduate colleges: 305
Here:
17.7%
Oregon:
17.7%
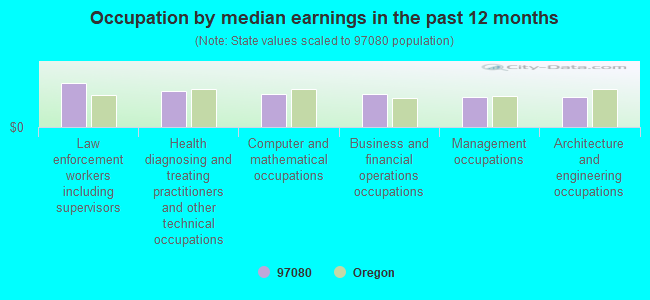
Occupation by median earnings in the past 12 months ($)
110,456Law enforcement workers including supervisors
90,137Health diagnosing and treating practitioners and other technical occupations
83,985Computer and mathematical occupations
81,855Business and financial operations occupations
75,868Management occupations
74,336Architecture and engineering occupations
Companies with federal contracts located in this zip code:
r. gordon schmidt (4153 SE Augusta Loop in Gresham, OR; small business)
$27,433 with Offices, Boards and Divisions (includes Attorney General, Deputy Attorney General, etc.) for Expert Witness. Taking place in MT. Signed on 2004-11-22. Completion date: 2005-11-21.
ARDEN OLSON BUILDING, INC (28930 SE POWELL VALLEY RD in GRESHAM, OR; small business)
$15,378 with Army for Maintenance, Repair and Rebuilding of Equipment -- Construction and Building Materials. Signed on 2004-09-09. Completion date: 2004-09-30.
ANDERSEN DATA SOLUTIONS (800 SE GREENWAY DRIVE in GRESHAM, OR; small business) : $14,100 in 2 contractsin 2002
$14,100 with Army for Court Reporting Services. Taking place in WA. Signed on 2002-04-26. Completion date: 2004-02-07.
$0, same as above.Signed on 2002-04-26. Completion date: 2004-02-07.
RUTHERFORD, ROBERT S (2313 SOUTHWEST 24TH ST in GRESHAM, OR; small business) : $14,091 in 10 contractsfrom 2005 to 2006
Contracts for Other Professional Services by Army Signed by year:2000: $0; 2001: $0; 2002: $0; 2003: $0; 2004: $0; 2005: $6,386; 2006: $7,705.
Biggest contracts:
$2,335 with Army for Other Professional Services. Signed on 2006-07-09. Completion date: 2006-06-30.
$1,739, same as above.Signed on 2005-09-23. Completion date: 2005-08-31.
$1,480, same as above.Signed on 2006-06-08. Completion date: 2006-05-31.
$1,345, same as above.Signed on 2006-05-07. Completion date: 2006-04-30.
Top industries in this zip code by the number of employees in 2005:
2002 - 2018 National Fire Incident Reporting System (NFIRS) incidents
According to the data from the years 2002 - 2018 the average number of fires per year is 36. The highest number of fire incidents - 102 took place in 2003, and the least - 6 in 2017. The data has a decreasing trend.
When looking into fire subcategories, the most incidents belonged to: Outside Fires (49.5%), and Structure Fires (32.2%).
Fire incident types reported to NFIRS in Zip Code 97080


 Nearest zip codes: 97030, 97060, 97089, 97009, 97024, 97233.
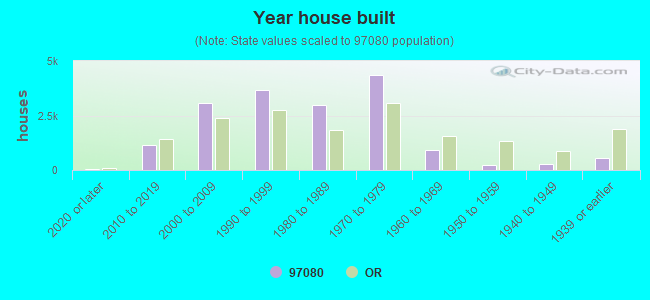


 According to the data from the years 2002 - 2018 the average number of fires per year is 36. The highest number of fire incidents - 102 took place in 2003, and the least - 6 in 2017. The data has a decreasing trend.
 When looking into fire subcategories, the most incidents belonged to: Outside Fires (49.5%), and Structure Fires (32.2%).