Estimated zip code population in 2022: 22,201 Zip code population in 2010: 21,226 Zip code population in 2000: 17,910
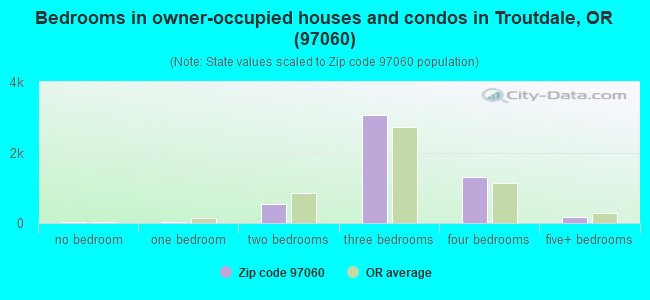
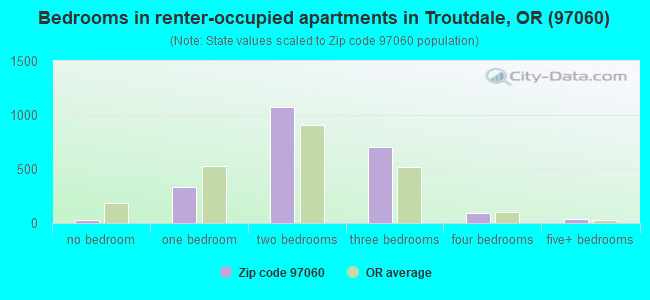
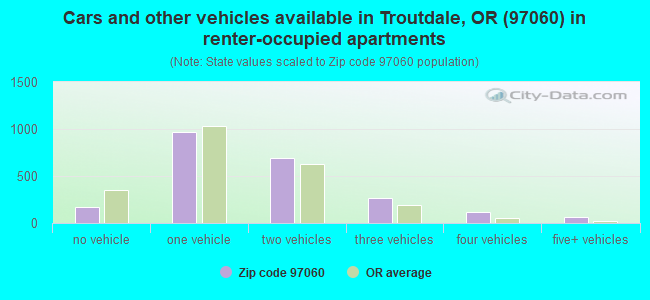
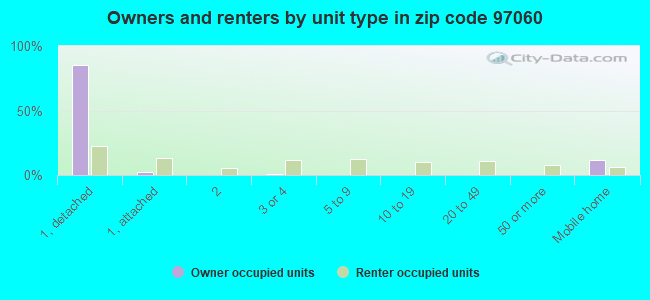
Houses and condos: 7,760 Renter-occupied apartments: 2,289
% of renters here:
31%
State:
37%
March 2022 cost of living index in zip code 97060: 102.8 (near average, U.S. average is 100)
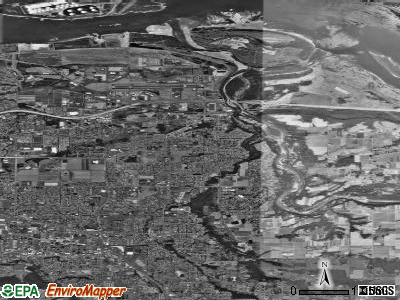
Land area: 17.6 sq. mi. Water area: 3.7 sq. mi.
Population density: 1,261 people per square mile
(low).
OSM Map
General Map
Google Map
MSN Map
OSM Map
General Map
Google Map
MSN Map
OSM Map
General Map
Google Map
MSN Map
OSM Map
General Map
Google Map
MSN Map
Please wait while loading the map...
Real estate property taxes paid for housing units in 2022:
This zip code:
0.9% ($4,166)
Oregon:
0.8% ($3,646)
Median real estate property taxes paid for housing units with mortgages in 2022: $4,248 (0.9%) Median real estate property taxes paid for housing units with no mortgage in 2022: $3,851 (1.0%)
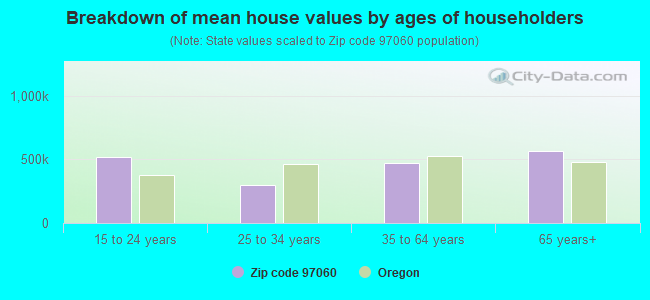
Estimated median house/condo value in 2022: $448,622
97060:
$448,622
Oregon:
$475,600
According to our research of Oregon and other state lists, there were 7 registered sex offenders living in 97060 zip code as of April 27, 2024. The ratio of all residents to sex offenders in zip code 97060 is 3,284 to 1. The ratio of registered sex offenders to all residents in this zip code is lower than the state average.
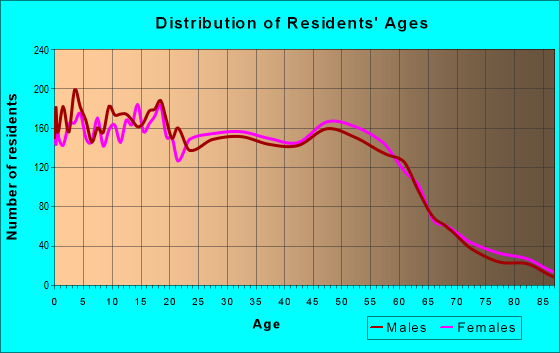
Median resident age:
This zip code:
35.1 years
Oregon median age:
40.5 years
Average household size:
This zip code:
2.9 people
Oregon:
2.4 people
Averages for the 2020 tax year for zip code 97060, filed in 2021:
Average Adjusted Gross Income (AGI) in 2020: $64,333 (Individual Income Tax Returns)
Here:
$64,333
State:
$76,001
Salary/wage: $54,923 (reported on 83.9% of returns)
Here:
$54,923
State:
$61,959
(% of AGI for various income ranges: 1207.3% for AGIs below $25k, 3815.7% for AGIs $25k-50k, 6974.1% for AGIs $50k-75k, 9736.3% for AGIs $75k-100k, 19038.7% for AGIs $100k-200k, 101664.0% for AGIs over 200k)
Taxable interest for individuals: $913 (reported on 27.9% of returns)
This zip code:
$913
Oregon:
$1,628
(% of AGI for various income ranges: 13.4% for AGIs below $25k, 11.4% for AGIs $25k-50k, 32.2% for AGIs $50k-75k, 24.8% for AGIs $75k-100k, 86.0% for AGIs $100k-200k, 1620.0% for AGIs over 200k)
Ordinary dividends: $3,476 (reported on 12.5% of returns)
Here:
$3,476
State:
$7,165
(% of AGI for various income ranges: 15.3% for AGIs below $25k, 25.3% for AGIs $25k-50k, 40.2% for AGIs $50k-75k, 71.6% for AGIs $75k-100k, 155.6% for AGIs $100k-200k, 2584.0% for AGIs over 200k)
Net capital gain/loss in AGI: +$14,556 (reported on 12.6% of returns)
Here:
+$14,556
State:
+$23,403
(% of AGI for various income ranges: 6.2% for AGIs below $25k, 35.3% for AGIs $25k-50k, 47.7% for AGIs $50k-75k, 99.3% for AGIs $75k-100k, 364.5% for AGIs $100k-200k, 27442.0% for AGIs over 200k)
Profit/loss from business: +$13,596 (reported on 13.1% of returns)
Here:
+$13,596
State:
+$16,511
(% of AGI for various income ranges: 114.1% for AGIs below $25k, 186.5% for AGIs $25k-50k, 300.3% for AGIs $50k-75k, 406.7% for AGIs $75k-100k, 465.9% for AGIs $100k-200k, 3010.0% for AGIs over 200k)
Taxable individual retirement arrangement distribution: $17,304 (reported on 7.4% of returns)
97060:
$17,304
Oregon:
$20,730
(% of AGI for various income ranges: 51.5% for AGIs below $25k, 80.7% for AGIs $25k-50k, 112.2% for AGIs $50k-75k, 293.7% for AGIs $75k-100k, 590.6% for AGIs $100k-200k, 3774.0% for AGIs over 200k)
Self-employed (Keogh) retirement plans: $14,950 (reported on 0.4% of returns)
97060:
$14,950
Oregon:
$22,884
(% of AGI for various income ranges: 69.5% for AGIs $100k-200k)
Total itemized deductions: $27,102 (reported on 11.6% of returns)
Here:
$27,102
State:
$31,050
(% of AGI for various income ranges: 68.9% for AGIs below $25k, 135.9% for AGIs $25k-50k, 439.4% for AGIs $50k-75k, 840.4% for AGIs $75k-100k, 1310.1% for AGIs $100k-200k, 11122.0% for AGIs over 200k)
Charity contributions: $7,965 (reported on 8.2% of returns)
Here:
$7,965
State:
$8,791
(% of AGI for various income ranges: 2.7% for AGIs below $25k, 18.2% for AGIs $25k-50k, 42.3% for AGIs $50k-75k, 89.9% for AGIs $75k-100k, 264.4% for AGIs $100k-200k, 5732.0% for AGIs over 200k)
Taxes paid: $8,262 (reported on 11.5% of returns)
97060:
$8,262
State:
$8,487
(% of AGI for various income ranges: 10.0% for AGIs below $25k, 36.8% for AGIs $25k-50k, 156.0% for AGIs $50k-75k, 305.9% for AGIs $75k-100k, 449.0% for AGIs $100k-200k, 1760.0% for AGIs over 200k)
Earned income credit: $2,121 (reported on 13.1% of returns)
Here:
$2,121
State:
$1,977
(% of AGI for various income ranges: 76.9% for AGIs below $25k, 58.3% for AGIs $25k-50k, 1.5% for AGIs $50k-75k)
Percentage of individuals using paid preparers for their 2020 taxes: 92.6%
Here:
93%
State:
93%
(% for various income ranges: 91.2% for AGIs below $25k, 92.6% for AGIs $25k-50k, 93.9% for AGIs $50k-75k, 92.7% for AGIs $75k-100k, 93.3% for AGIs $100k-200k, 95.5% for AGIs over 200k)
Averages for the 2012 tax year for zip code 97060, filed in 2013:
Average Adjusted Gross Income (AGI) in 2012: $50,505 (Individual Income Tax Returns)
Here:
$50,505
State:
$57,845
Salary/wage: $44,893 (reported on 86.4% of returns)
Here:
$44,893
State:
$47,723
(% of AGI for various income ranges: 76.7% for AGIs below $25k, 81.1% for AGIs $25k-50k, 81.0% for AGIs $50k-75k, 79.7% for AGIs $75k-100k, 80.8% for AGIs $100k-200k, 41.7% for AGIs over 200k)
Taxable interest for individuals: $1,024 (reported on 25.4% of returns)
This zip code:
$1,024
Oregon:
$1,848
(% of AGI for various income ranges: 0.8% for AGIs below $25k, 0.3% for AGIs $25k-50k, 0.4% for AGIs $50k-75k, 0.4% for AGIs $75k-100k, 0.5% for AGIs $100k-200k, 1.3% for AGIs over 200k)
Ordinary dividends: $2,612 (reported on 12.9% of returns)
Here:
$2,612
State:
$5,987
(% of AGI for various income ranges: 0.9% for AGIs below $25k, 0.5% for AGIs $25k-50k, 0.5% for AGIs $50k-75k, 0.5% for AGIs $75k-100k, 0.4% for AGIs $100k-200k, 2.1% for AGIs over 200k)
Net capital gain/loss in AGI: +$6,789 (reported on 9.5% of returns)
Here:
+$6,789
State:
+$13,095
(% of AGI for various income ranges: 0.3% for AGIs $50k-75k, 0.6% for AGIs $75k-100k, 1.0% for AGIs $100k-200k, 9.4% for AGIs over 200k)
Profit/loss from business: +$11,183 (reported on 12.3% of returns)
Here:
+$11,183
State:
+$13,871
(% of AGI for various income ranges: 5.9% for AGIs below $25k, 4.2% for AGIs $25k-50k, 2.2% for AGIs $50k-75k, 1.8% for AGIs $75k-100k, 1.4% for AGIs $100k-200k, 3.1% for AGIs over 200k)
Taxable individual retirement arrangement distribution: $13,493 (reported on 7.7% of returns)
97060:
$13,493
Oregon:
$16,036
(% of AGI for various income ranges: 2.5% for AGIs below $25k, 1.9% for AGIs $25k-50k, 1.9% for AGIs $50k-75k, 2.1% for AGIs $75k-100k, 2.7% for AGIs $100k-200k)
Self-employment retirement plans: $17,633 (reported on 0.3% of returns)
97060:
$17,633
Oregon:
$19,462
Total itemized deductions: $21,345 (25% of AGI, reported on 39.6% of returns)
Here:
$21,345
State:
$24,430
Here:
25.0% of AGI
State:
23.2% of AGI
(% of AGI for various income ranges: 11.1% for AGIs below $25k, 12.5% for AGIs $25k-50k, 17.7% for AGIs $50k-75k, 19.2% for AGIs $75k-100k, 19.4% for AGIs $100k-200k, 16.3% for AGIs over 200k)
Charity contributions: $2,890 (reported on 32.3% of returns)
Here:
$2,890
State:
$3,648
(% of AGI for various income ranges: 0.7% for AGIs below $25k, 1.2% for AGIs $25k-50k, 1.7% for AGIs $50k-75k, 2.2% for AGIs $75k-100k, 2.3% for AGIs $100k-200k, 2.9% for AGIs over 200k)
Taxes paid: $8,436 (reported on 39.2% of returns)
97060:
$8,436
State:
$10,269
(% of AGI for various income ranges: 2.1% for AGIs below $25k, 3.7% for AGIs $25k-50k, 6.3% for AGIs $50k-75k, 7.6% for AGIs $75k-100k, 8.9% for AGIs $100k-200k, 8.4% for AGIs over 200k)
Earned income credit: $2,282 (reported on 16.6% of returns)
Here:
$2,282
State:
$2,021
(% of AGI for various income ranges: 5.6% for AGIs below $25k, 1.2% for AGIs $25k-50k)
Percentage of individuals using paid preparers for their 2012 taxes: 45.6%
Here:
46%
State:
47%
(% for various income ranges: 40.3% for AGIs below $25k, 45.3% for AGIs $25k-50k, 46.5% for AGIs $50k-75k, 50.5% for AGIs $75k-100k, 54.5% for AGIs $100k-200k, 81.8% for AGIs over 200k)
Averages for the 2004 tax year for zip code 97060, filed in 2005:
Average Adjusted Gross Income (AGI) in 2004: $43,967 (Individual Income Tax Returns)
Here:
$43,967
State:
$46,788
Salary/wage: $40,989 (reported on 88.6% of returns)
Here:
$40,989
State:
$39,788
(% of AGI for various income ranges: 165.1% for AGIs below $10k, 80.5% for AGIs $10k-25k, 85.2% for AGIs $25k-50k, 85.1% for AGIs $50k-75k, 87.9% for AGIs $75k-100k, 70.3% for AGIs over 100k)
Taxable interest for individuals: $1,078 (reported on 35.8% of returns)
This zip code:
$1,078
Oregon:
$2,126
(% of AGI for various income ranges: 5.8% for AGIs below $10k, 1.9% for AGIs $10k-25k, 0.8% for AGIs $25k-50k, 0.6% for AGIs $50k-75k, 0.5% for AGIs $75k-100k, 1.0% for AGIs over 100k)
Taxable dividends: $1,451 (reported on 17.8% of returns)
Here:
$1,451
State:
$3,427
(% of AGI for various income ranges: 3.9% for AGIs below $10k, 0.8% for AGIs $10k-25k, 0.4% for AGIs $25k-50k, 0.5% for AGIs $50k-75k, 0.4% for AGIs $75k-100k, 0.8% for AGIs over 100k)
Net capital gain/loss: +$6,405 (reported on 14.5% of returns)
Here:
+$6,405
State:
+$12,447
(% of AGI for various income ranges: -1.7% for AGIs below $10k, 0.2% for AGIs $10k-25k, 0.2% for AGIs $25k-50k, 0.7% for AGIs $50k-75k, 0.6% for AGIs $75k-100k, 7.4% for AGIs over 100k)
Profit/loss from business: +$8,730 (reported on 13.2% of returns)
Here:
+$8,730
State:
+$11,682
(% of AGI for various income ranges: 4.0% for AGIs below $10k, 4.0% for AGIs $10k-25k, 2.9% for AGIs $25k-50k, 1.8% for AGIs $50k-75k, 1.8% for AGIs $75k-100k, 3.3% for AGIs over 100k)
IRA payment deduction: $2,572 (reported on 2.6% of returns)
97060:
$2,572
Oregon:
$3,035
(% of AGI for various income ranges: 0.2% for AGIs $10k-25k, 0.2% for AGIs $25k-50k, 0.2% for AGIs $50k-75k, 0.1% for AGIs $75k-100k, 0.1% for AGIs over 100k)
Self-employed pension: $8,500 (reported on 0.5% of returns)
Here:
$8,500
Oregon:
$14,224
Total itemized deductions: $19,057 (27% of AGI, reported on 46.9% of returns)
Here:
$19,057
State:
$20,209
Here:
27.3% of AGI
State:
24.7% of AGI
(% of AGI for various income ranges: 31.5% for AGIs below $10k, 11.0% for AGIs $10k-25k, 17.9% for AGIs $25k-50k, 22.5% for AGIs $50k-75k, 23.5% for AGIs $75k-100k, 20.6% for AGIs over 100k)
Charity contributions deductions: $2,572 (4% of AGI, reported on 40.1% of returns)
Here:
$2,572
State:
$3,145
Here:
3.5% of AGI
State:
3.6% of AGI
(% of AGI for various income ranges: 1.7% for AGIs below $10k, 1.0% for AGIs $10k-25k, 1.8% for AGIs $25k-50k, 2.4% for AGIs $50k-75k, 2.4% for AGIs $75k-100k, 3.3% for AGIs over 100k)
Total tax: $5,145 (reported on 76.1% of returns)
97060:
$5,145
State:
$7,148
(% of AGI for various income ranges: 4.6% for AGIs below $10k, 3.8% for AGIs $10k-25k, 6.2% for AGIs $25k-50k, 7.6% for AGIs $50k-75k, 8.8% for AGIs $75k-100k, 14.8% for AGIs over 100k)
Earned income credit: $1,735 (reported on 13.7% of returns)
Here:
$1,735
State:
$1,605
Percentage of individuals using paid preparers for their 2004 taxes: 51.0%
Here:
51%
State:
53%
(% for various income ranges: 38.7% for AGIs below $10k, 49.2% for AGIs $10k-25k, 51.4% for AGIs $25k-50k, 55.5% for AGIs $50k-75k, 56.8% for AGIs $75k-100k, 66.1% for AGIs over 100k)
Likely homosexual households (counted as self-reported same-sex unmarried-partner households)
Lesbian couples: 0.3% of all households
Gay men: 0.1% of all households
Household received Food Stamps/SNAP in the past 12 months: 1,004 Household did not receive Food Stamps/SNAP in the past 12 months: 6,424
Women who had a birth in the past 12 months: 111 (85 now married, 26 unmarried) Women who did not have a birth in the past 12 months: 5,085 (2,367 now married, 2,699 unmarried)
Housing units in zip code 97060 with a mortgage: 3,576 (434 second mortgage, 426 both second mortgage and home equity loan) Houses without a mortgage: 54
Median monthly owner costs for units with a mortgage: $1,936 Median monthly owner costs for units without a mortgage: $657
Residents with income below the poverty level in 2022:
This zip code:
10.5%
Whole state:
12.1%
Residents with income below 50% of the poverty level in 2022:
This zip code:
4.8%
Whole state:
6.2%
Median number of rooms in houses and condos:
Here:
6.4
State:
6.2
Median number of rooms in apartments:
Here:
4.2
State:
4.0
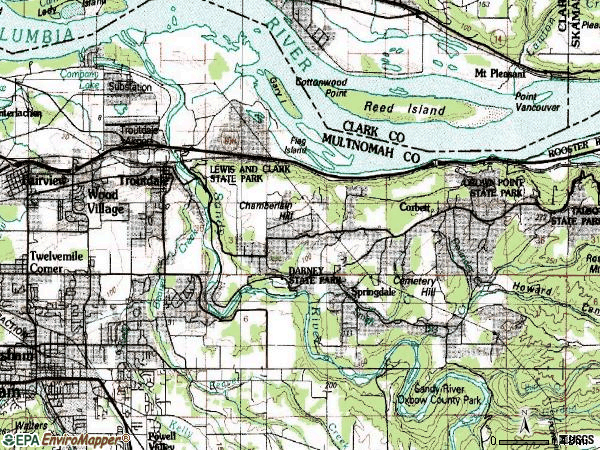
Notable locations in this zip code not listed on our city pages
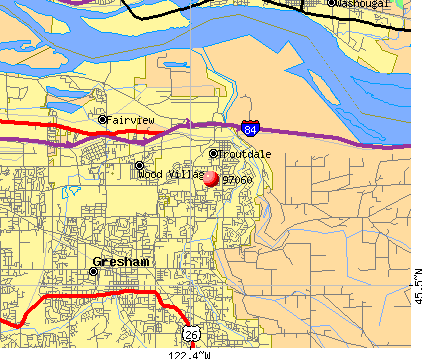
Notable locations in zip code 97060: McMenamins Edgefield Red Shed Amphitheater (A), Dabney State Park Boat Ramp (B), Lewis and Clark State Park Boat Ramp (C), Troutdale Substation (D), Troutdale Sewage Treatment Plant (E), Sandy (F), Barn Museum (G), Wood Village City Hall (H), Wood Village Public Works Department Office (I), Rail Depot Museum (J), Troutdale Public Works Department (K), Troutdale Municipal Court (L), Troutdale City Hall (M), Gresham Fire and Emergency Services Station 75 (N), Multnomah County Rural Fire Protection District 14 Station 61 Springdale (O), Harlow House Museum (P). Display/hide their locations on the map
Churches in zip code 97060 include: East County Church of Christ (A), Church of Jesus Christ of Latter Day Saints (B). Display/hide their locations on the map
Streams, rivers, and creeks: Sandy River (A), Salmon Creek (B), Beaver Creek (C), Harlow Creek (D), Bonnie Brook (E), Keanes Creek (F), Smith Creek (G). Display/hide their locations on the map
Parks in zip code 97060 include: Dabney State Park (1), Flagg Island Park (2), Gary Island Park (3), Flagg Island (4), Lewis and Clark State Park (5), Depot City Park (6), Columbia City Park (7), C P City Park (8), Glen Otto City Park (9). Display/hide their locations on the map
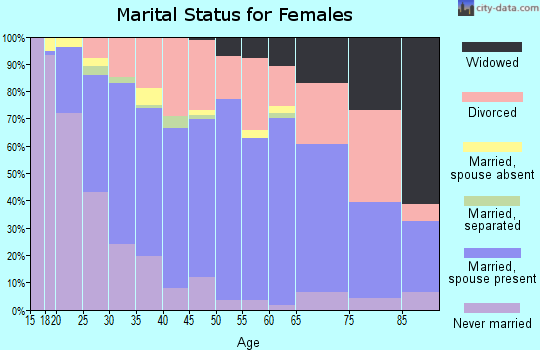
4,211 married couples with children.
1,095 single-parent households (465 men, 630 women).
73.2% of residents of 97060 zip code speak English at home.
16.4% of residents speak Spanish at home (57% very well, 16% well, 21% not well, 7% not at all).
5.1% of residents speak other Indo-European language at home (47% very well, 23% well, 23% not well, 8% not at all).
2.9% of residents speak Asian or Pacific Island language at home (47% very well, 24% well, 21% not well, 7% not at all).
2.2% of residents speak other language at home (48% very well, 23% well, 28% not well, 1% not at all).
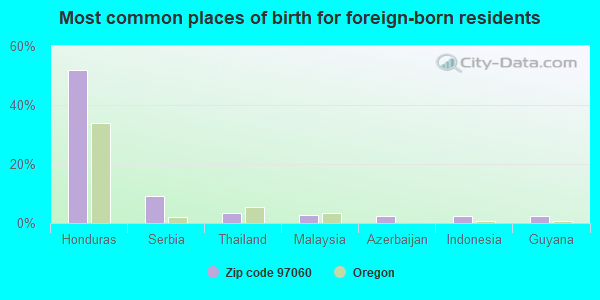
Foreign born population: 3,481 (15.7%) (39.2% of them are naturalized citizens)
This zip code:
15.7%
Whole state:
9.9%
52%Honduras
9%Serbia
3%Thailand
3%Malaysia
2%Azerbaijan
2%Indonesia
2%Guyana
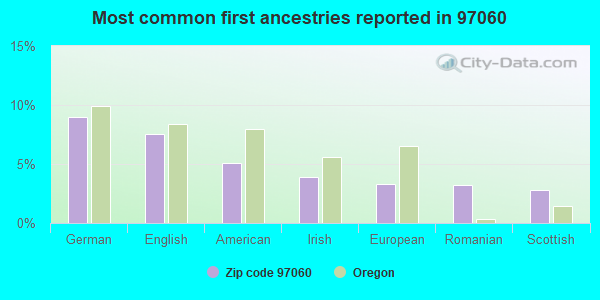
9%German
8%English
5%American
4%Irish
3%European
3%Romanian
3%Scottish
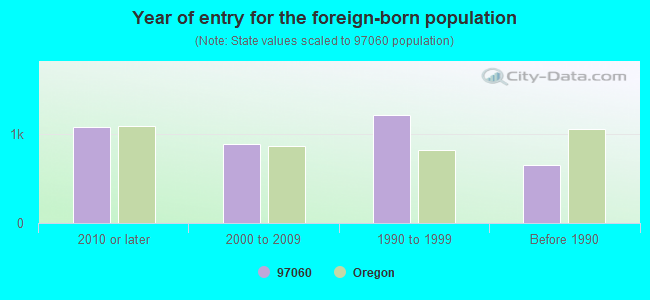
Year of entry for the foreign-born population
1,0752010 or later
8922000 to 2009
1,2121990 to 1999
652Before 1990
Major facilities with environmental interests located in this zip code:
ARCO PRODUCTS COMPANY 6503 (2550 NORTHEAST 238TH DRIVE in WOOD VILLAGE, OR)
STATE MASTER (Oregon inspections and permits database) - OR-HWMS-959, CESQG STATE MASTER (Oregon inspections and permits database) - OR-LUST-26-91-0178, LEAKING STORAGE TANK, OR-UST-BBDCB, OR-UST-BBDCC, OR-UST-BBDCD, OR-UST-BBDCE, OR-HWMS-270, CESQG Small Quantity Generators, between 100 kg and 1000 kg of hazardous waste/month (Resource Conservation and Recovery Act (tracking hazardous waste)) (Resource Conservation and Recovery Act (tracking hazardous waste)) Business SIC classification: GASOLINE SERVICE STATIONS Organizations: ARCO PRODUCTS CO. (CONTACT/ HAZARDOUS WASTE)
, BP WEST COAST PRODUCTS LLC (CONTACT/ HAZARDOUS WASTE)
, AM/PM MINI MARKET 5448 (CONTACT/ HAZARDOUS WASTE)
, ARCO PRODUCTS CO. (CONTACT/GENERAL)
, PSI (PRESTIGE STATIONS, INC.) ATTN: ENVI (CONTACT/OPERATOR)
, BP WEST COAST PRODUCTS LLC (CONTACT/OWNER)
, ARCO PRODUCTS CO. (HAZARDOUS WASTE OPERATOR)
, PSI (PRESTIGE STATIONS, INC.) ATTN: ENVI (HAZARDOUS WASTE OPERATOR)
, PRESTIGE STATIONS INC (HAZARDOUS WASTE OPERATOR)
, BP WEST COAST PRODUCTS (HAZARDOUS WASTE OPERATOR)
, BP WEST COAST PRODUCTS LLC (HAZARDOUS WASTE SITE CONTACT)
, ARCO PRODUCTS CO. (HAZARDOUS WASTE SITE CONTACT)
, ARCO PRODUCTS CO. ATTN: ENVIRONMENTAL (HAZARDOUS WASTE SITE CONTACT)
Alternative names: ARCO PRODUCTS CO 6503 PSI, ARCO PRODUCTS CO 6503 PSI 5448, ARCO PRODUCTS CO PSI 5448, ARCO PRODUCTS CO 6503, ARCO PRODUCTS CO 6503 PSI
AMERIFLIGHT INCORPORATED (911 NORTH WEST GRAHAM in TROUTDALE, OR)
STATE MASTER (Oregon inspections and permits database) - OR-HWMS-3161, SQG STATE MASTER (Oregon inspections and permits database) - OR-UST-AAECE, LEAKING STORAGE TANK (Resource Conservation and Recovery Act (tracking hazardous waste)) Business SIC classification: AIR TRANSPORTATION, NONSCHEDULED Business NAICS classification: NONSCHEDULED CHARTERED PASSENGER AIR TRANSPORTATION.; NONSCHEDULED CHARTERED FREIGHT AIR TRANSPORTATION. Organizations: PORT OF PORTLAND (CONTACT/OWNER)
, AMERIFLIGHT, INC. (CONTACT/OWNER)
, EAGLE FLIGHT CENTER, INC. (CONTACT/PERMIT)
, PORT OF PORTLAND ENVIRONMENTAL SERVICES (HAZARDOUS WASTE LAND OWNER)
CHEVRON USA INC SS 98295 (2555 NE 238TH in TROUTDALE, OR)
STATE MASTER (Oregon inspections and permits database) - OR-LUST-26-90-0104, LEAKING STORAGE TANK, OR-LUST-26-92-0275, OR-UST-BAFJG, OR-UST-BAFJH, OR-UST-BAFJJ, OR-HWMS-3566, CESQG (Resource Conservation and Recovery Act (tracking hazardous waste)) Business SIC classification: GASOLINE SERVICE STATIONS Organizations: CHEVRON USA INC SS 98295 TROUTWOOD INC (CONTACT/ HAZARDOUS WASTE)
, CHEVRON PRODUCTS INC. (CONTACT/GENERAL)
, CHEVRON USA INC SS 98295 TROUTWOOD INC (CONTACT/OPERATOR)
, TROUTWOOD INC. (CONTACT/OWNER)
, TROUTWOOD, INC. (CONTACT/PERMIT)
, CHEVRON USA INC SS 98295 TROUTWOOD INC (HAZARDOUS WASTE OPERATOR)
, CHEVRON USA INC SS 95314 (HAZARDOUS WASTE SITE CONTACT)
GRESHAM TRANSFER INC (24001 NE SANDY BLVD in WOOD VILLAGE, OR)
STATE MASTER (Oregon inspections and permits database) - SIS-109238-15239, NPDES STORMWATER PERMIT, SIS-109238-15240, HWMS-1465-, CESQG STATE MASTER (Oregon inspections and permits database) - OR-SIS-109238-15239, NPDES STORMWATER PERMIT, OR-SIS-109238-15240, Conditionally Exempt Small Quantity Generators, less than 100 kg/month of hazardous waste (Resource Conservation and Recovery Act (tracking hazardous waste)) - notification Business SIC classification: LOCAL TRUCKING WITHOUT STORAGE; GENERAL AUTOMOTIVE REPAIR SHOPS Business NAICS classification: SOLID WASTE COLLECTION.; HAZARDOUS WASTE COLLECTION.; OTHER WASTE COLLECTION.; GENERAL AUTOMOTIVE REPAIR. Organizations: GRESHAM TRANSFER, INC. (CONTACT/ HAZARDOUS WASTE)
, GRESHAM TRANSFER INC. (CONTACT/ HAZARDOUS WASTE)
, WOOD VILLAGE LAND COMPANY (HAZARDOUS WASTE LAND OWNER)
, GRESHAM TRANSFER INC. (HAZARDOUS WASTE SITE CONTACT)
Alternative names: WOOD VILLAGE SITE
BLUE LAKE PARK (20500 NE MARINE DR in TROUTDALE, OR)
STATE MASTER (Oregon inspections and permits database) - OR-LUST-26-94-0169, LEAKING STORAGE TANK, OR-HWMS-2235, CESQG Conditionally Exempt Small Quantity Generators, less than 100 kg/month of hazardous waste (Resource Conservation and Recovery Act (tracking hazardous waste)) - notification Business SIC classification: LAND, MINERAL, WILDLIFE, AND FOREST CONSERVATION Organizations: METRO SOLID WASTE DEPARTMENT (CONTACT/ HAZARDOUS WASTE)
, MULTNOMAH COUNTY FACILITIES MANAGEMENT (CONTACT/GENERAL)
, METRO (CONTACT/OPERATOR)
, MULTNOMAH COUNTY PROPERTY MANAGEMENT (HAZARDOUS WASTE LAND OWNER)
, METRO PLANNING AND DEVELOPMENT (HAZARDOUS WASTE OPERATOR)
D AND D MANUFACTURING INCORPORATED (302 NORTHWEST 257TH WAY in TROUTDALE, OR)
STATE MASTER (Oregon inspections and permits database) - OR-HWMS-2786, CESQG (Resource Conservation and Recovery Act (tracking hazardous waste)) Business SIC classification: WOOD TELEVISION, RADIO, PHONOGRAPH, AND SEWING MACHINE CABINETS Business NAICS classification: WOOD TELEVISION, RADIO, AND SEWING MACHINE CABINET MANUFACTURING.; WOOD TELEVISION, RADIO, AND SEWING MACHINE CABINET MANUFACTURING. Organizations: THIRD DIMENSION INC (CONTACT/OPERATOR)
, D & D MANUFACTURING, INC (HAZARDOUS WASTE OPERATOR)
Alternative names: THIRD DIMENSION INC
ENGINE COMPONENTS NORTHWEST INCORPORATED (1230 NW PERIMETER WAY in TROUTDALE, OR)
STATE MASTER (Oregon inspections and permits database) - OR-HWMS-5037, SQG Conditionally Exempt Small Quantity Generators, less than 100 kg/month of hazardous waste (Resource Conservation and Recovery Act (tracking hazardous waste)) Business SIC classification: AIRCRAFT ENGINES AND ENGINE PARTS Business NAICS classification: AIRCRAFT ENGINE AND ENGINE PARTS MANUFACTURING.; AIRCRAFT ENGINE AND ENGINE PARTS MANUFACTURING. Organizations: ENGINE COMPONENTS OREGON (CONTACT/ HAZARDOUS WASTE)
, ENGINE COMPONENTS INC (CONTACT/OWNER)
, PORT OF PORTLAND (HAZARDOUS WASTE LAND OWNER)
, ENGINE COMPONENTS OREGON (HAZARDOUS WASTE OPERATOR)
, ENGINE COMPONENTS NORTHWEST, INC. (HAZARDOUS WASTE OPERATOR)
Alternative names: ENGINE COMPONENTS OREGON
GLACIER NORTHWEST INC TROUTDALE RDY MX (2176 NW MARINE DR SPACE C in TROUTDALE, OR)
CRITERIA AND HAZARDOUS AIR POLLUTANT INVENTORY (Inventory of air pollution sources) STATE MASTER (Oregon inspections and permits database) - OR-SIS-110372-16236, NPDES STORMWATER PERMIT, OR-HWMS-1397, CESQG Conditionally Exempt Small Quantity Generators, less than 100 kg/month of hazardous waste (Resource Conservation and Recovery Act (tracking hazardous waste)) - notification TRI REPORTER (Tracking of toxic chemicals releasing facilities) Business SIC classification: READY-MIXED CONCRETE Alternative names: GLACIER NORTHWEST, INC., GLACIER NORTHWEST INC. TROUTDALE READY-MIX PLANT
ALLIED DEMOLITION CO (940 NW DUNBAR AVE in TROUTDALE, OR)
STATE MASTER (Oregon inspections and permits database) - OR-HWMS-4735, CESQG (Resource Conservation and Recovery Act (tracking hazardous waste)) Business SIC classification: WRECKING AND DEMOLITION WORK Organizations: SHELDON & NANCY ORTON (CONTACT/OPERATOR)
, DEMOLITION AND EXCAVATION CONRACTOR (CONTACT/OWNER)
CHELSEA GCA REALTY INCORPORATED DBA COLUMBIA GORGE FACTORY STORES (450 NORTHWEST 257TH AVENUE in TROUTDALE, OR)
STATE MASTER (Oregon inspections and permits database) - OR-HWMS-5812, CESQG (Resource Conservation and Recovery Act (tracking hazardous waste)) Business SIC classification: MISCELLANEOUS APPAREL AND ACCESSORY STORES Business NAICS classification: MEN'S AND BOYS' CUT AND SEW SUIT, COAT, AND OVERCOAT MANUFACTURING.; MEN'S AND BOYS' CUT AND SEW SHIRT (EXCEPT WORK SHIRT) MANUFACTURING.; WOMEN'S AND GIRLS' CUT AND SEW DRESS MANUFACTURING. Organizations: CHELSEA GCA REALTY PARTNERSHIP, LP (CONTACT/OWNER)
Alternative names: CHELSEA GCA REALTY INC DBA COLUMBIA GORG
BP OIL COMPANY (2225 NORTH EAST 238TH in WOOD VILLAGE, OR)
STATE MASTER (Oregon inspections and permits database) - OR-LUST-26-90-0016, LEAKING STORAGE TANK, OR-LUST-26-96-0007, (Resource Conservation and Recovery Act (tracking hazardous waste)) Organizations: TOSCO MARKETING COMPANY (CONTACT/OWNER)
Alternative names: CIRCLE K STORE, CIRCLE K STORE DBA BP SS 11031
EASTSIDE DENTAL CLINIC (1540 SW 257TH AVE in TROUTDALE, OR)
STATE MASTER (Oregon inspections and permits database) - HWMS-6599-, CESQG Conditionally Exempt Small Quantity Generators, less than 100 kg/month of hazardous waste (Resource Conservation and Recovery Act (tracking hazardous waste)) Business SIC classification: OFFICES AND CLINICS OF DENTISTS Organizations: JOHN KILIAN (CONTACT/OPERATOR)
DIRT & AGGREGATE INTERCHANGE INC (20905 NE SANDY BLVD in TROUTDALE, OR)
STATE MASTER (Oregon inspections and permits database) - OR-ECSI-874, SUPERFUND (Resource Conservation and Recovery Act (tracking hazardous waste)) Business SIC classification: EXCAVATION WORK; BRICK, STONE, AND RELATED CONSTRUCTION MATERIALS Organizations: DIRT & AGGREGATE INTERCHANGE, INC. (CONTACT/OWNER)
Housing units lacking complete plumbing facilities: 0.3% Housing units lacking complete kitchen facilities: 0.6%
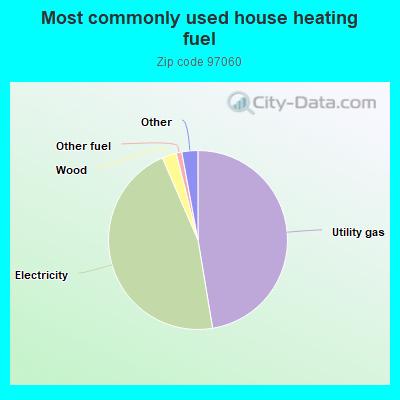
47.4%Utility gas
46.1%Electricity
2.6%Wood
1.0%Other fuel
0.9%Fuel oil, kerosene, etc.
0.9%Bottled, tank, or LP gas
Population in 1990: 4,849. Population change in the 1990s: +13,061 (+269.4%).
Place of birth for U.S.-born residents:
This state: 12,061
Northeast: 363
Midwest: 1,194
South: 692
West: 4,041
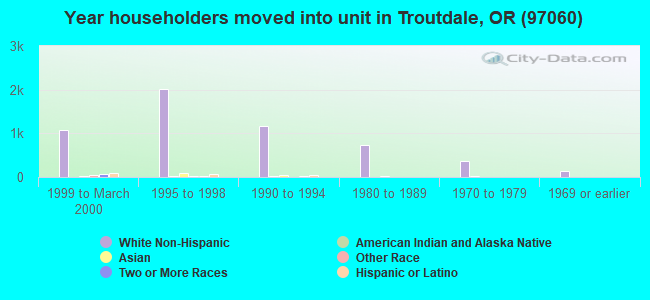
49% of the 97060 zip code residents lived in the same house 5 years ago. Out of people who lived in different houses, 65% lived in this county. Out of people who lived in different counties, 50% lived in Oregon.
90% of the 97060 zip code residents lived in the same house 1 year ago. Out of people who lived in different houses, 76% moved from this county. Out of people who lived in different houses, 10% moved from different county within same state. Out of people who lived in different houses, 10% moved from different state. Out of people who lived in different houses, 2% moved from abroad.
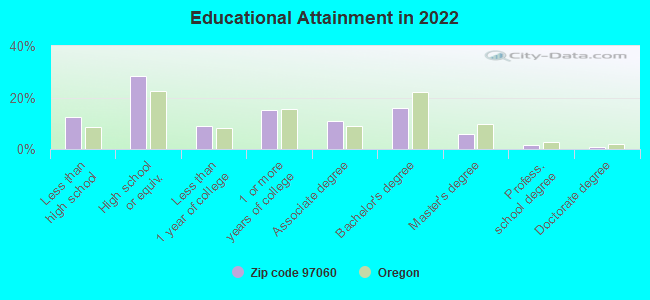
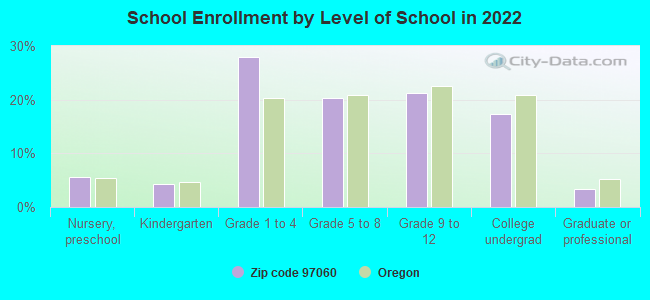
Private vs. public school enrollment:
Students in private schools in grades 1 to 8 (elementary and middle school): 600
Here:
22.6%
Oregon:
13.7%
Students in private schools in grades 9 to 12 (high school): 51
Here:
4.5%
Oregon:
8.8%
Students in private undergraduate colleges: 124
Here:
13.1%
Oregon:
17.7%
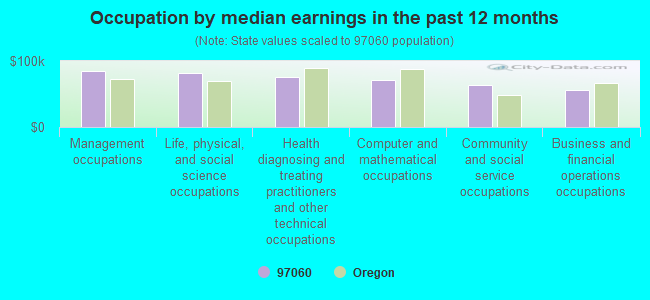
Occupation by median earnings in the past 12 months ($)
85,039Management occupations
82,476Life, physical, and social science occupations
76,468Health diagnosing and treating practitioners and other technical occupations
70,548Computer and mathematical occupations
63,426Community and social service occupations
55,442Business and financial operations occupations
Companies with federal contracts located in this zip code (TROUTDALE, OR):
SUNDIAL MARINE TUG & BARGE WOR (5605 NE SUNDIAL RD; small business) 750 employees, $0 revenue: $28,436,106 in 123 contractsfrom 1999 to 2006
Contracts for Barges And Lighters, Cargo, Non-nuclear Ship Repair (West) Ship repair (including overhauls and conversions) performed on. non-nuclear propelled and nonpropelled ships west of the 108th meridian, Modification of Equipment -- Ship and Marine Equipment, Maintenance, Repair and Rebuilding of Equipment -- Ships, Small Craft, Pontoons, and Floating Docks by Navy, U.S. Army Corps of Engineers - civil program financing only, Army, United States Coast Guard (disused code: now 7008), and others Signed by year:2000: $1,959,202; 2001: $2,683,410; 2002: $1,576,374; 2003: $11,024,176; 2004: $4,082,173; 2005: $6,018,012; 2006: -$12,063.
Biggest contracts:
$6,913,986 with Navy for Barges And Lighters, Cargo. Signed on 2003-07-23. Completion date: 2004-10-23.
$3,481,137, same as above.Signed on 2005-05-18. Completion date: 2008-12-31.
$2,622,070, same as above.Signed on 2003-12-19. Completion date: 2004-10-23.
$2,350,361, same as above.Signed on 2004-06-22. Completion date: 2005-03-22.
PACIFIC SALES & SERVICE INC (935 NW CORPORATE DR; small business) : $34,398 in 3 contractsfrom 2003 to 2004
$15,020 with Army for Motor Vehicle Maintenance and Repair Shop Specialized Equipment. Signed on 2004-08-31. Completion date: 2004-10-12.
$15,020, same as above.Signed on 2004-09-08. Completion date: 2004-10-12.
$4,358 with U.S. Army Corps of Engineers - civil program financing only for Refrigeration and Air Conditioning Components. Signed on 2003-03-13. Completion date: 2003-03-30.
PHOENIX FIRE SYSTEMS, INC. (1401 SE 29TH CT; small business)
$14,130 with Navy for Maintenance, Repair or Alteration of Real Property -- Other Administrative Facilities and Service Buildings. Taking place in WA. Signed on 2000-03-14. Completion date: 2000-04-29.
TERRY L STANTON (663 SE 18TH ST; small business)
$5,000 with Army for Engineering and Technical Services. Signed on 2006-01-31. Completion date: 2006-09-30.
Top industries in this zip code by the number of employees in 2005:
2002 - 2018 National Fire Incident Reporting System (NFIRS) incidents
Based on the data from the years 2002 - 2018 the average number of fire incidents per year is 45. The highest number of fires - 77 took place in 2007, and the least - 9 in 2009. The data has a dropping trend.
When looking into fire subcategories, the most incidents belonged to: Outside Fires (46.9%), and Structure Fires (31.4%).
Fire incident types reported to NFIRS in Zip Code 97060


 Nearest zip codes: 97080, 97030, 97024, 98607, 97009, 97019.


 Based on the data from the years 2002 - 2018 the average number of fire incidents per year is 45. The highest number of fires - 77 took place in 2007, and the least - 9 in 2009. The data has a dropping trend.
 When looking into fire subcategories, the most incidents belonged to: Outside Fires (46.9%), and Structure Fires (31.4%).