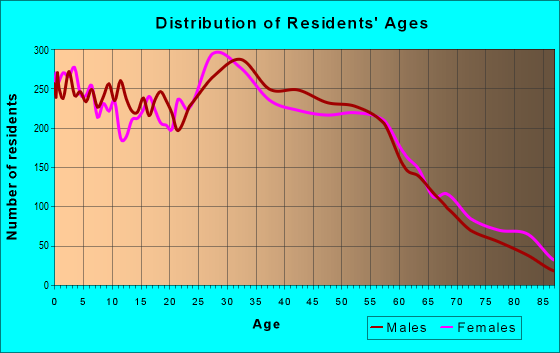
Estimated zip code population in 2022: 35,809 Zip code population in 2010: 33,300 Zip code population in 2000: 38,069
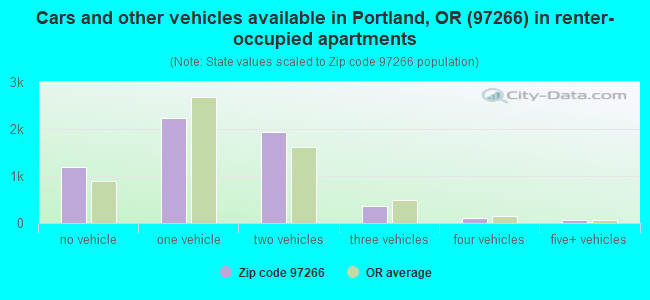
Houses and condos: 13,987 Renter-occupied apartments: 5,915
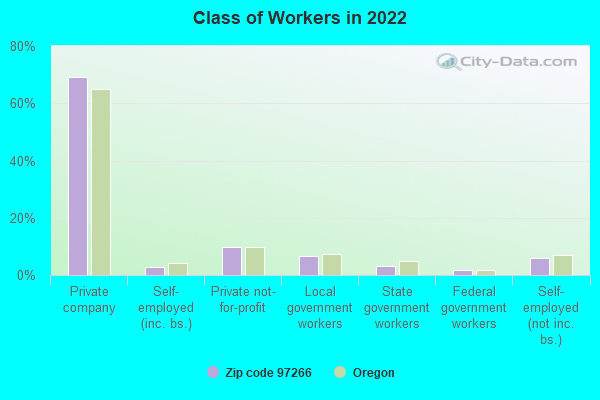
% of renters here:
44%
State:
37%
March 2022 cost of living index in zip code 97266: 104.1 (near average, U.S. average is 100)
Land area: 6.0 sq. mi. Water area: 0.0 sq. mi.
Population density: 5,924 people per square mile
(average).
OSM Map
General Map
Google Map
MSN Map
OSM Map
General Map
Google Map
MSN Map
OSM Map
General Map
Google Map
MSN Map
OSM Map
General Map
Google Map
MSN Map
Please wait while loading the map...
Real estate property taxes paid for housing units in 2022:
This zip code:
0.9% ($3,947)
Oregon:
0.8% ($3,646)
Median real estate property taxes paid for housing units with mortgages in 2022: $3,890 (0.9%) Median real estate property taxes paid for housing units with no mortgage in 2022: $4,148 (1.1%)
Averages for the 2020 tax year for zip code 97266, filed in 2021:
Average Adjusted Gross Income (AGI) in 2020: $48,034 (Individual Income Tax Returns)
Here:
$48,034
State:
$76,001
Salary/wage: $42,634 (reported on 86.8% of returns)
Here:
$42,634
State:
$61,959
(% of AGI for various income ranges: 1218.3% for AGIs below $25k, 3768.6% for AGIs $25k-50k, 7144.0% for AGIs $50k-75k, 10981.0% for AGIs $75k-100k, 18786.5% for AGIs $100k-200k, 60324.0% for AGIs over 200k)
Taxable interest for individuals: $564 (reported on 22.0% of returns)
This zip code:
$564
Oregon:
$1,628
(% of AGI for various income ranges: 5.4% for AGIs below $25k, 9.5% for AGIs $25k-50k, 18.4% for AGIs $50k-75k, 22.9% for AGIs $75k-100k, 84.6% for AGIs $100k-200k, 478.0% for AGIs over 200k)
Ordinary dividends: $5,352 (reported on 9.3% of returns)
Here:
$5,352
State:
$7,165
(% of AGI for various income ranges: 8.8% for AGIs below $25k, 8.9% for AGIs $25k-50k, 22.7% for AGIs $50k-75k, 30.3% for AGIs $75k-100k, 108.9% for AGIs $100k-200k, 11728.0% for AGIs over 200k)
Net capital gain/loss in AGI: +$10,000 (reported on 9.7% of returns)
Here:
+$10,000
State:
+$23,403
(% of AGI for various income ranges: 7.0% for AGIs below $25k, 21.8% for AGIs $25k-50k, 56.3% for AGIs $50k-75k, 124.6% for AGIs $75k-100k, 320.9% for AGIs $100k-200k, 20000.0% for AGIs over 200k)
Profit/loss from business: +$11,006 (reported on 15.2% of returns)
Here:
+$11,006
State:
+$16,511
(% of AGI for various income ranges: 136.8% for AGIs below $25k, 189.8% for AGIs $25k-50k, 265.8% for AGIs $50k-75k, 357.3% for AGIs $75k-100k, 609.5% for AGIs $100k-200k, 2528.0% for AGIs over 200k)
Taxable individual retirement arrangement distribution: $13,479 (reported on 3.8% of returns)
97266:
$13,479
Oregon:
$20,730
(% of AGI for various income ranges: 27.5% for AGIs below $25k, 37.2% for AGIs $25k-50k, 73.7% for AGIs $50k-75k, 134.3% for AGIs $75k-100k, 427.0% for AGIs $100k-200k)
Self-employed (Keogh) retirement plans: $4,200 (reported on 0.2% of returns)
97266:
$4,200
Oregon:
$22,884
(% of AGI for various income ranges: 3.1% for AGIs $25k-50k)
Total itemized deductions: $24,208 (reported on 8.7% of returns)
Here:
$24,208
State:
$31,050
(% of AGI for various income ranges: 37.7% for AGIs below $25k, 123.6% for AGIs $25k-50k, 434.5% for AGIs $50k-75k, 833.9% for AGIs $75k-100k, 1078.6% for AGIs $100k-200k, 8776.0% for AGIs over 200k)
Charity contributions: $4,360 (reported on 5.6% of returns)
Here:
$4,360
State:
$8,791
(% of AGI for various income ranges: 2.9% for AGIs below $25k, 8.9% for AGIs $25k-50k, 35.2% for AGIs $50k-75k, 84.1% for AGIs $75k-100k, 164.2% for AGIs $100k-200k, 1748.0% for AGIs over 200k)
Taxes paid: $7,954 (reported on 8.7% of returns)
97266:
$7,954
State:
$8,487
(% of AGI for various income ranges: 9.3% for AGIs below $25k, 37.3% for AGIs $25k-50k, 161.2% for AGIs $50k-75k, 322.8% for AGIs $75k-100k, 387.3% for AGIs $100k-200k, 1216.0% for AGIs over 200k)
Earned income credit: $2,115 (reported on 19.6% of returns)
Here:
$2,115
State:
$1,977
(% of AGI for various income ranges: 98.9% for AGIs below $25k, 64.8% for AGIs $25k-50k, 1.6% for AGIs $50k-75k)
Percentage of individuals using paid preparers for their 2020 taxes: 93.7%
Here:
94%
State:
93%
(% for various income ranges: 93.1% for AGIs below $25k, 94.0% for AGIs $25k-50k, 93.8% for AGIs $50k-75k, 94.2% for AGIs $75k-100k, 94.7% for AGIs $100k-200k, 94.1% for AGIs over 200k)
Averages for the 2012 tax year for zip code 97266, filed in 2013:
Average Adjusted Gross Income (AGI) in 2012: $35,220 (Individual Income Tax Returns)
Here:
$35,220
State:
$57,845
Salary/wage: $32,727 (reported on 87.2% of returns)
Here:
$32,727
State:
$47,723
(% of AGI for various income ranges: 78.2% for AGIs below $25k, 85.7% for AGIs $25k-50k, 85.0% for AGIs $50k-75k, 84.1% for AGIs $75k-100k, 73.5% for AGIs $100k-200k, 42.8% for AGIs over 200k)
Taxable interest for individuals: $837 (reported on 17.2% of returns)
This zip code:
$837
Oregon:
$1,848
(% of AGI for various income ranges: 0.4% for AGIs below $25k, 0.2% for AGIs $25k-50k, 0.2% for AGIs $50k-75k, 0.3% for AGIs $75k-100k, 0.8% for AGIs $100k-200k, 1.6% for AGIs over 200k)
Ordinary dividends: $1,832 (reported on 7.7% of returns)
Here:
$1,832
State:
$5,987
(% of AGI for various income ranges: 0.4% for AGIs below $25k, 0.3% for AGIs $25k-50k, 0.4% for AGIs $50k-75k, 0.4% for AGIs $75k-100k, 0.7% for AGIs $100k-200k, 0.7% for AGIs over 200k)
Net capital gain/loss in AGI: +$3,792 (reported on 6.2% of returns)
Here:
+$3,792
State:
+$13,095
(% of AGI for various income ranges: 0.1% for AGIs $25k-50k, 0.4% for AGIs $50k-75k, 0.6% for AGIs $75k-100k, 1.3% for AGIs $100k-200k, 9.1% for AGIs over 200k)
Profit/loss from business: +$10,564 (reported on 14.7% of returns)
Here:
+$10,564
State:
+$13,871
(% of AGI for various income ranges: 10.6% for AGIs below $25k, 3.9% for AGIs $25k-50k, 2.3% for AGIs $50k-75k, 2.1% for AGIs $75k-100k, 4.2% for AGIs $100k-200k)
Taxable individual retirement arrangement distribution: $10,438 (reported on 4.7% of returns)
97266:
$10,438
Oregon:
$16,036
(% of AGI for various income ranges: 1.5% for AGIs below $25k, 1.2% for AGIs $25k-50k, 1.0% for AGIs $50k-75k, 1.8% for AGIs $75k-100k, 2.3% for AGIs $100k-200k)
Total itemized deductions: $17,293 (27% of AGI, reported on 27.3% of returns)
Here:
$17,293
State:
$24,430
Here:
27.3% of AGI
State:
23.2% of AGI
(% of AGI for various income ranges: 7.1% for AGIs below $25k, 10.8% for AGIs $25k-50k, 15.8% for AGIs $50k-75k, 18.0% for AGIs $75k-100k, 18.1% for AGIs $100k-200k, 17.6% for AGIs over 200k)
Charity contributions: $2,184 (reported on 19.5% of returns)
Here:
$2,184
State:
$3,648
(% of AGI for various income ranges: 0.5% for AGIs below $25k, 0.9% for AGIs $25k-50k, 1.5% for AGIs $50k-75k, 1.7% for AGIs $75k-100k, 2.1% for AGIs $100k-200k, 1.1% for AGIs over 200k)
Taxes paid: $6,225 (reported on 27.0% of returns)
97266:
$6,225
State:
$10,269
(% of AGI for various income ranges: 1.5% for AGIs below $25k, 3.2% for AGIs $25k-50k, 5.5% for AGIs $50k-75k, 7.5% for AGIs $75k-100k, 8.1% for AGIs $100k-200k, 8.2% for AGIs over 200k)
Earned income credit: $2,246 (reported on 28.5% of returns)
Here:
$2,246
State:
$2,021
(% of AGI for various income ranges: 7.8% for AGIs below $25k, 1.4% for AGIs $25k-50k)
Percentage of individuals using paid preparers for their 2012 taxes: 46.9%
Here:
47%
State:
47%
(% for various income ranges: 44.8% for AGIs below $25k, 47.3% for AGIs $25k-50k, 49.2% for AGIs $50k-75k, 51.3% for AGIs $75k-100k, 55.8% for AGIs $100k-200k, 75.0% for AGIs over 200k)
Averages for the 2004 tax year for zip code 97266, filed in 2005:
Average Adjusted Gross Income (AGI) in 2004: $36,215 (Individual Income Tax Returns)
Here:
$36,215
State:
$46,788
Salary/wage: $32,370 (reported on 86.2% of returns)
Here:
$32,370
State:
$39,788
(% of AGI for various income ranges: 105.1% for AGIs below $10k, 81.8% for AGIs $10k-25k, 86.8% for AGIs $25k-50k, 82.8% for AGIs $50k-75k, 75.6% for AGIs $75k-100k, 56.6% for AGIs over 100k)
Taxable interest for individuals: $1,698 (reported on 30.3% of returns)
This zip code:
$1,698
Oregon:
$2,126
(% of AGI for various income ranges: 4.9% for AGIs below $10k, 1.3% for AGIs $10k-25k, 1.0% for AGIs $25k-50k, 1.0% for AGIs $50k-75k, 1.4% for AGIs $75k-100k, 2.0% for AGIs over 100k)
Taxable dividends: $1,926 (reported on 14.5% of returns)
Here:
$1,926
State:
$3,427
(% of AGI for various income ranges: 2.1% for AGIs below $10k, 0.7% for AGIs $10k-25k, 0.6% for AGIs $25k-50k, 0.7% for AGIs $50k-75k, 1.1% for AGIs $75k-100k, 0.9% for AGIs over 100k)
Net capital gain/loss: +$12,294 (reported on 12.7% of returns)
Here:
+$12,294
State:
+$12,447
(% of AGI for various income ranges: -2.2% for AGIs below $10k, 0.2% for AGIs $10k-25k, 0.4% for AGIs $25k-50k, 0.9% for AGIs $50k-75k, 2.1% for AGIs $75k-100k, 15.6% for AGIs over 100k)
Profit/loss from business: +$8,608 (reported on 14.0% of returns)
Here:
+$8,608
State:
+$11,682
(% of AGI for various income ranges: 4.7% for AGIs below $10k, 5.3% for AGIs $10k-25k, 2.6% for AGIs $25k-50k, 2.3% for AGIs $50k-75k, 3.5% for AGIs $75k-100k, 3.6% for AGIs over 100k)
IRA payment deduction: $2,923 (reported on 2.3% of returns)
97266:
$2,923
Oregon:
$3,035
(% of AGI for various income ranges: 0.3% for AGIs below $10k, 0.2% for AGIs $10k-25k, 0.2% for AGIs $25k-50k, 0.2% for AGIs $50k-75k, 0.2% for AGIs $75k-100k, 0.2% for AGIs over 100k)
Self-employed pension: $12,254 (reported on 0.4% of returns)
Here:
$12,254
Oregon:
$14,224
(% of AGI for various income ranges: 0.1% for AGIs $10k-25k, 0.1% for AGIs $50k-75k, 0.2% for AGIs $75k-100k, 0.4% for AGIs over 100k)
Total itemized deductions: $17,963 (28% of AGI, reported on 35.7% of returns)
Here:
$17,963
State:
$20,209
Here:
27.5% of AGI
State:
24.7% of AGI
(% of AGI for various income ranges: 17.4% for AGIs below $10k, 11.0% for AGIs $10k-25k, 16.5% for AGIs $25k-50k, 21.3% for AGIs $50k-75k, 21.9% for AGIs $75k-100k, 18.1% for AGIs over 100k)
Charity contributions deductions: $2,529 (4% of AGI, reported on 28.9% of returns)
Here:
$2,529
State:
$3,145
Here:
3.6% of AGI
State:
3.6% of AGI
(% of AGI for various income ranges: 0.9% for AGIs below $10k, 1.1% for AGIs $10k-25k, 1.5% for AGIs $25k-50k, 2.3% for AGIs $50k-75k, 2.6% for AGIs $75k-100k, 2.7% for AGIs over 100k)
Total tax: $4,821 (reported on 70.0% of returns)
97266:
$4,821
State:
$7,148
(% of AGI for various income ranges: 3.6% for AGIs below $10k, 4.0% for AGIs $10k-25k, 6.3% for AGIs $25k-50k, 8.2% for AGIs $50k-75k, 9.8% for AGIs $75k-100k, 17.0% for AGIs over 100k)
Earned income credit: $1,768 (reported on 21.5% of returns)
Here:
$1,768
State:
$1,605
Percentage of individuals using paid preparers for their 2004 taxes: 56.0%
Here:
56%
State:
53%
(% for various income ranges: 51.6% for AGIs below $10k, 55.8% for AGIs $10k-25k, 56.3% for AGIs $25k-50k, 57.7% for AGIs $50k-75k, 60.6% for AGIs $75k-100k, 66.3% for AGIs over 100k)
Likely homosexual households (counted as self-reported same-sex unmarried-partner households)
Lesbian couples: 0.1% of all households
Gay men: 0.4% of all households
Household received Food Stamps/SNAP in the past 12 months: 3,385 Household did not receive Food Stamps/SNAP in the past 12 months: 10,206
Women who had a birth in the past 12 months: 339 (225 now married, 113 unmarried) Women who did not have a birth in the past 12 months: 8,647 (3,254 now married, 5,412 unmarried)
Housing units in zip code 97266 with a mortgage: 5,545 (502 second mortgage, 411 both second mortgage and home equity loan) Houses without a mortgage: 27
Median monthly owner costs for units with a mortgage: $1,876 Median monthly owner costs for units without a mortgage: $653
Residents with income below the poverty level in 2022:
This zip code:
17.2%
Whole state:
12.1%
Residents with income below 50% of the poverty level in 2022:
This zip code:
9.8%
Whole state:
6.2%
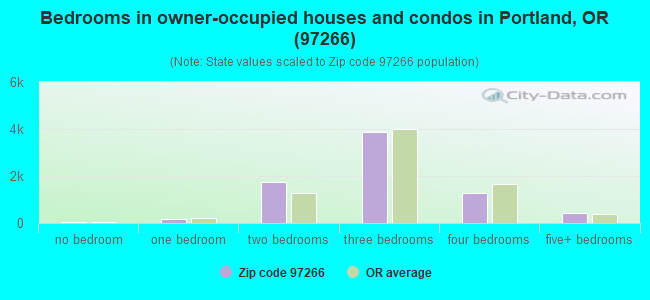
Median number of rooms in houses and condos:
Here:
5.7
State:
6.2
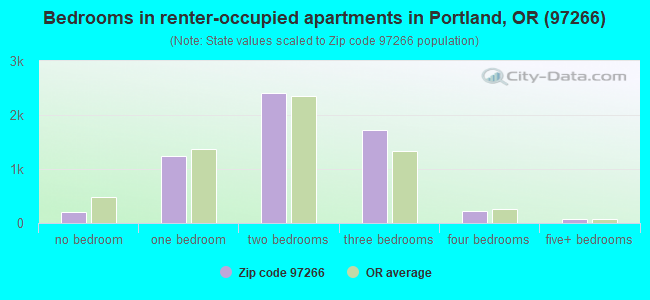
Median number of rooms in apartments:
Here:
4.1
State:
4.0
Notable locations in this zip code not listed on our city pages
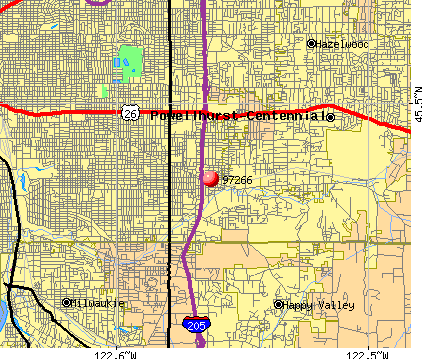
Notable locations in zip code 97266: Walker Stadium (A), Kirkpatrick (B), Pilgrim Lutheran Church Park and Ride (C), Portland Fire and Rescue Station 11 Lents (D), Department of Motor Vehicles Portland Drive Test Center (E). Display/hide their locations on the map
Churches in zip code 97266 include: Tongan Fellowship of the United Methodists (A), Church of Korean Martyrs (B), Mount Scott Church of God (C), Multnomah Holiness Association (D), New Life Missionary Church (E), Pilgrim Lutheran Church (F), Portland Pentecostal Church (G), Powellhurst Baptist Church (H), Open Bible Church (I). Display/hide their locations on the map
Parks in zip code 97266 include: Lents City Park (1), Division-Powell Park (2), Earl Boyles City Park (3), Bloomington City Park (4), Glenwood City Park (5), West Powellhurst City Park (6), Beggars Tick Wildlife Refuge (7), Brookside Park (8), Ed Benedict City Park (9). Display/hide their locations on the map
3,804 married couples with children.
1,857 single-parent households (629 men, 1,228 women).
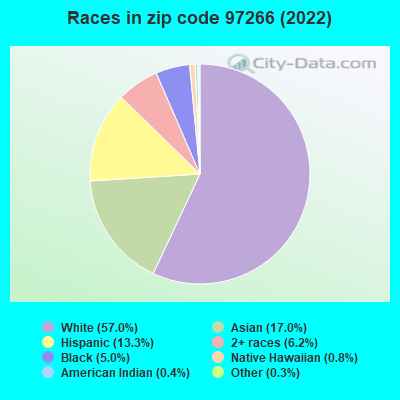
70.3% of residents of 97266 zip code speak English at home.
7.8% of residents speak Spanish at home (60% very well, 17% well, 16% not well, 7% not at all).
6.1% of residents speak other Indo-European language at home (53% very well, 14% well, 30% not well, 2% not at all).
13.8% of residents speak Asian or Pacific Island language at home (29% very well, 25% well, 31% not well, 16% not at all).
1.7% of residents speak other language at home (61% very well, 20% well, 9% not well, 10% not at all).
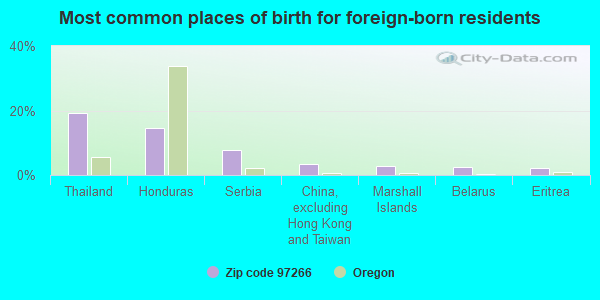
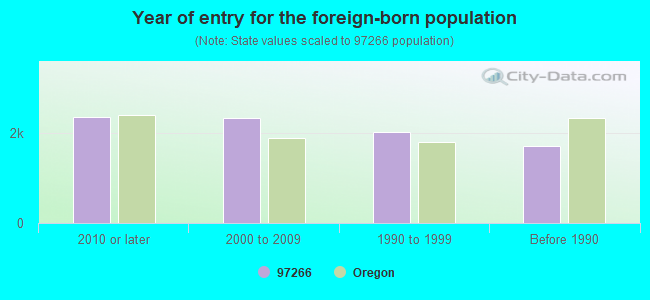
Foreign born population: 7,615 (21.3%) (59.2% of them are naturalized citizens)
Major facilities with environmental interests located in this zip code:
ARCO PRODUCTS CO 5874 (9220 SE HOLGATE BLVD in PORTLAND, OR)
STATE MASTER (Oregon inspections and permits database) - OR-LUST-26-91-0491, LEAKING STORAGE TANK, OR-LUST-26-92-0126, OR-UST-BBGDB, OR-UST-BBGDC, OR-UST-BBGDD, OR-UST-BBGDE, OR-HWMS-6398, CESQG Large Quantity Generators, more that 1000 kg of hazardous waste/month (Resource Conservation and Recovery Act (tracking hazardous waste)) Business SIC classification: GASOLINE SERVICE STATIONS Organizations: BP WEST COAST PRODUCTS LLC (CONTACT/ HAZARDOUS WASTE)
, ARCO PRODUCTS CO. (CONTACT/ HAZARDOUS WASTE)
, TRUAX CORPORATION (CONTACT/GENERAL)
, EUREKA MANAGEMENT GROUP (CONTACT/GENERAL)
, BLUE CHIP PROPERTIES (CONTACT/GENERAL)
, ATLANTIC RICHFIELD CO. (CONTACT/GENERAL)
, MASAD NICOLA (CONTACT/OPERATOR)
, BP WEST COAST PRODUCTS LLC (CONTACT/OWNER)
, PRESTIGE STATIONS INC (HAZARDOUS WASTE OPERATOR)
, ARCO PRODUCTS CO. (HAZARDOUS WASTE SITE CONTACT)
, BP WEST COAST PRODUCTS LLC (HAZARDOUS WASTE SITE CONTACT)
, ATLANTIC RICHFIELD CO (HAZARDOUS WASTE SITE CONTACT)
CHEVRON USA INC SS 93760 (9150 SE DIVISION in PORTLAND, OR)
STATE MASTER (Oregon inspections and permits database) - OR-UST-BCEJD, LEAKING STORAGE TANK, OR-UST-BCEJE, OR-UST-BCEJF, OR-HWMS-6550, CESQG Conditionally Exempt Small Quantity Generators, less than 100 kg/month of hazardous waste (Resource Conservation and Recovery Act (tracking hazardous waste)) - notification Business SIC classification: GENERAL AUTOMOTIVE REPAIR SHOPS Business NAICS classification: GENERAL AUTOMOTIVE REPAIR.; GENERAL AUTOMOTIVE REPAIR. Organizations: CHEVRON PRODUCTS CO (CONTACT/ HAZARDOUS WASTE)
, CHEVRON 92232 (CONTACT/ HAZARDOUS WASTE)
, MANHATTAN INVESTMENT COMPANY (CONTACT/GENERAL)
, DIVISION PETROLEUM INC. (CONTACT/GENERAL)
, CHEVRON 92232 (CONTACT/OPERATOR)
, MANHATTAN INVESTMENT COMPANY (CONTACT/OWNER)
, DIVISION PETROLEUM INC. (CONTACT/OWNER)
, DIVISION PETROLEUM, INC. (CONTACT/PERMIT)
, MAHATTEN INVESTMENTS C/O WP HUTCHISON TO (HAZARDOUS WASTE LAND OWNER)
, CHEVRON 92232 (HAZARDOUS WASTE LEGAL OWNER)
, CHEVRON USA INC SS 93760 BILLS 205 CHEVR (HAZARDOUS WASTE OPERATOR)
FOSTER AUTO PARTS (10355 SE FOSTER RD in PORTLAND, OR)
STATE MASTER (Oregon inspections and permits database) - OR-HWMS-479, CESQG STATE MASTER (Oregon inspections and permits database) - OR-LUST-34-99-0910, LEAKING STORAGE TANK Conditionally Exempt Small Quantity Generators, less than 100 kg/month of hazardous waste (Resource Conservation and Recovery Act (tracking hazardous waste)) - notification Business SIC classification: MOTOR VEHICLE PARTS, USED; GENERAL AUTOMOTIVE REPAIR SHOPS Business NAICS classification: GENERAL AUTOMOTIVE REPAIR.; GENERAL AUTOMOTIVE REPAIR. Organizations: U-PULL-IT AUTO WRECKING (CONTACT/ HAZARDOUS WASTE)
CONOCOPHILLIPS SS 255449 (5322 SE 82ND AVE in PORTLAND, OR)
STATE MASTER (Oregon inspections and permits database) - OR-LUST-26-94-0049, LEAKING STORAGE TANK, OR-UST-AJDEG, OR-UST-AJDEH, Conditionally Exempt Small Quantity Generators, less than 100 kg/month of hazardous waste (Resource Conservation and Recovery Act (tracking hazardous waste)) Business SIC classification: GASOLINE SERVICE STATIONS Organizations: CONOCOPHILLIPS COMPANY (CONTACT/ HAZARDOUS WASTE)
, PHILLIPS 66 COMPANY (CONTACT/GENERAL)
, CIRCLE K INC. (CONTACT/GENERAL)
, CONOCOPHILLIPS COMPANY (CONTACT/OPERATOR)
, CONOCOPHILLIPSCOMPANY (CONTACT/OWNER)
, UNOCAL ENVIRONMENTAL ENGINEERING DEPT (CONTACT/PERMIT)
, CONOCOPHILLIPS COMPANY (HAZARDOUS WASTE LAND OWNER)
Alternative names: TOSCO 5449, UNOCAL 5449
H2O BOAT BARN (9001 SOUTHEAST POWELL BOULEVARD in PORTLAND, OR)
STATE MASTER (Oregon inspections and permits database) - OR-LUST-26-94-0102, LEAKING STORAGE TANK STATE MASTER (Oregon inspections and permits database) - OR-ECSI-1502, SUPERFUND (Resource Conservation and Recovery Act (tracking hazardous waste)) Business SIC classification: BOAT BUILDING AND REPAIRING Business NAICS classification: BOAT BUILDING. Organizations: FRANK A BITAR& ASSOC. A LIMITED PARTNER (CONTACT/GENERAL)
, WILLIAM F BITAR (CONTACT/OWNER)
Alternative names: BITAR H2O BOAT BARN, FRANK BITAR& ASSOCIATES
FUNTASTIC TRAVELING SHOWS (3407 SE 108TH AVE in PORTLAND, OR)
STATE MASTER (Oregon inspections and permits database) - OR-HWMS-4863, CESQG (Resource Conservation and Recovery Act (tracking hazardous waste)) Business SIC classification: AMUSEMENT AND RECREATION SERVICES Business NAICS classification: RECREATIONAL GOODS RENTAL.; ALL OTHER TRAVEL ARRANGEMENT AND RESERVATION SERVICES.; ALL OTHER MISCELLANEOUS SCHOOLS AND INSTRUCTION.; OTHER SPECTATOR SPORTS. Organizations: FUNTASTIC RIDES (CONTACT/ HAZARDOUS WASTE)
, FUNTASTIC RIDES (HAZARDOUS WASTE OPERATOR)
20TH CENTURY LANES (3550 SE 92ND AVE in PORTLAND, OR)
STATE MASTER (Oregon inspections and permits database) - OR-HWMS-1783, CESQG Conditionally Exempt Small Quantity Generators, less than 100 kg/month of hazardous waste (Resource Conservation and Recovery Act (tracking hazardous waste)) - notification Business SIC classification: BOWLING CENTERS Organizations: AMF BOWLING WORLDWIDE (CONTACT/OWNER)
, BITAR BROS / ROBERT A BITAR CORP (HAZARDOUS WASTE LAND OWNER)
FRED MEYER SOUTHEAST (5253 SE 82ND AVE in PORTLAND, OR)
STATE MASTER (Oregon inspections and permits database) - OR-HWMS-166, CESQG (Resource Conservation and Recovery Act (tracking hazardous waste)) Business SIC classification: DEPARTMENT STORES; GROCERY STORES Organizations: FRED MEYER STORES INC (CONTACT/ HAZARDOUS WASTE)
, SOUTHEAST CO (HAZARDOUS WASTE LAND OWNER)
, FRED MEYER INC (HAZARDOUS WASTE SITE CONTACT)
Alternative names: FRED MEYER INC
FRED MEYER PDX JOHNSON CREEK (8955 SOUTHEAST 82ND AVENUE in PORTLAND, OR)
STATE MASTER (Oregon inspections and permits database) - OR-HWMS-3620, CESQG (Resource Conservation and Recovery Act (tracking hazardous waste)) Business SIC classification: DEPARTMENT STORES Organizations: FRED MEYER STORES INC (CONTACT/ HAZARDOUS WASTE)
, RONALD BENDERSON 1995 TRUST (HAZARDOUS WASTE LAND OWNER)
Alternative names: FRED MEYER JOHNSON CREEK
DAVID DOUGLAS SD 40 AIM SCHOOL (3955 SE 112TH AVE in PORTLAND, OR)
STATE MASTER (Oregon inspections and permits database) - HWMS-3019-, CESQG (Resource Conservation and Recovery Act (tracking hazardous waste)) Business SIC classification: ELEMENTARY AND SECONDARY SCHOOLS Organizations: MULTNOMAH CO SD AKA DAVID DOUGLAS SD 40 (CONTACT/ HAZARDOUS WASTE)
DAVID DOUGLAS SD 40 W POWELLHURST ELEM (2921 SE 116TH AVE in PORTLAND, OR)
STATE MASTER (Oregon inspections and permits database) - OR-HWMS-1848, CESQG Conditionally Exempt Small Quantity Generators, less than 100 kg/month of hazardous waste (Resource Conservation and Recovery Act (tracking hazardous waste)) - notification Business SIC classification: ELEMENTARY AND SECONDARY SCHOOLS Organizations: MULTNOMAH CO SD AKA DAVID DOUGLAS SD 40 (CONTACT/ HAZARDOUS WASTE)
Alternative names: WEST POWELLHURST ELEM SCHOOL, WEST POWELLHURST SCHOOL
DAVID DOUGLAS SCHOOL DISTRICT (10822 SE BUSH ST in PORTLAND, OR)
STATE MASTER (Oregon inspections and permits database) - OR-HWMS-1677, CESQG Conditionally Exempt Small Quantity Generators, less than 100 kg/month of hazardous waste (Resource Conservation and Recovery Act (tracking hazardous waste)) - notification Business SIC classification: ELEMENTARY AND SECONDARY SCHOOLS Organizations: DAVID DOUGLAS SD 40 (CONTACT/ HAZARDOUS WASTE)
, MULTNOMAH CO SD AKA DAVID DOUGLAS SD 40 (CONTACT/ HAZARDOUS WASTE)
, DAVID DOUGLAS SD 40 (HAZARDOUS WASTE SITE CONTACT)
Alternative names: DAVID DOUGLAS SD 40 EARL BOYLES ELEMENT
APPLY A LINE INC (5946 SE 111TH AVE in PORTLAND, OR)
STATE MASTER (Oregon inspections and permits database) - OR-HWMS-1957, CESQG (Resource Conservation and Recovery Act (tracking hazardous waste)) Business SIC classification: SPECIAL TRADE CONTRACTORS
Housing units lacking complete plumbing facilities: 0.5% Housing units lacking complete kitchen facilities: 0.7%
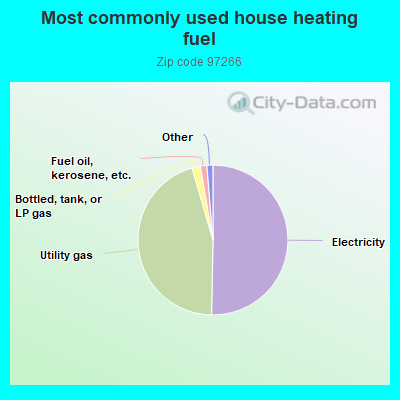
50.3%Electricity
45.2%Utility gas
1.8%Bottled, tank, or LP gas
1.4%Fuel oil, kerosene, etc.
0.6%No fuel used
0.6%Wood
Population in 1990: 29,648. Population change in the 1990s: +8,421 (+28.4%).
Place of birth for U.S.-born residents:
This state: 14,853
Northeast: 1,254
Midwest: 2,684
South: 2,260
West: 6,408
44% of the 97266 zip code residents lived in the same house 5 years ago. Out of people who lived in different houses, 56% lived in this county. Out of people who lived in different counties, 50% lived in Oregon.
88% of the 97266 zip code residents lived in the same house 1 year ago. Out of people who lived in different houses, 52% moved from this county. Out of people who lived in different houses, 29% moved from different county within same state. Out of people who lived in different houses, 16% moved from different state. Out of people who lived in different houses, 3% moved from abroad.
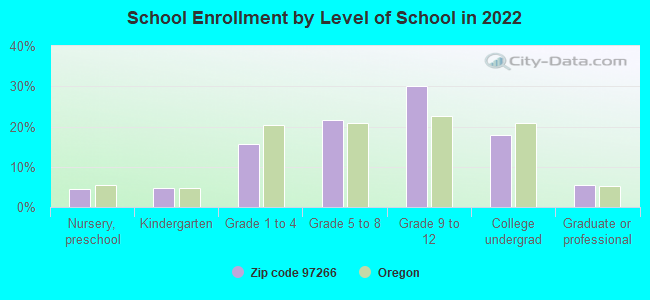
Private vs. public school enrollment:
Students in private schools in grades 1 to 8 (elementary and middle school): 173
Here:
6.7%
Oregon:
13.7%
Students in private schools in grades 9 to 12 (high school): 95
Here:
4.5%
Oregon:
8.8%
Students in private undergraduate colleges: 282
Here:
22.6%
Oregon:
17.7%
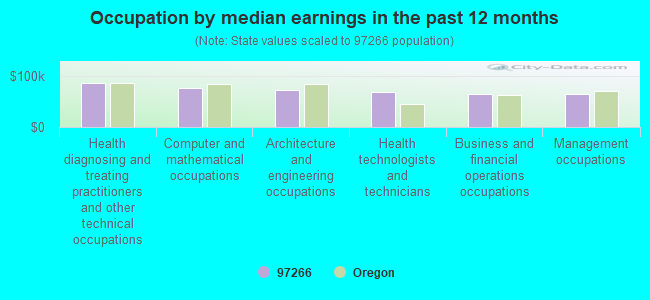
Occupation by median earnings in the past 12 months ($)
87,059Health diagnosing and treating practitioners and other technical occupations
76,895Computer and mathematical occupations
72,576Architecture and engineering occupations
68,937Health technologists and technicians
66,049Business and financial operations occupations
64,391Management occupations
Companies with federal contracts located in this zip code:
RALPH STROM (9474 SE CARNABY WAY in PORTLAND, OR; small business) : $205,135 in 14 contractsfrom 2000 to 2006
Contracts for Architect - Engineer Services (including landscaping, interior layout, and designing), Other Research and Development -- Applied Research and Exploratory Development (R&D), Seismological Studies by U.S. Army Corps of Engineers - civil program financing only, Army Signed by year:2000: $82,848; 2001: $55,948; 2002: $2,700; 2003: $10,550; 2004: $19,975; 2005: $28,350; 2006: $4,764.
Biggest contracts:
$51,588 with U.S. Army Corps of Engineers - civil program financing only for Architect - Engineer Services (including landscaping, interior layout, and designing). Signed on 2000-07-27. Completion date: 2001-10-31.
$33,600 with U.S. Army Corps of Engineers - civil program financing only for Other Research and Development -- Applied Research and Exploratory Development (R&D). Signed on 2001-11-21. Completion date: 2002-11-20.
$31,260, same as above.Signed on 2000-05-31. Completion date: 2000-12-30.
$30,600, same as above.Signed on 2001-01-19. Completion date: 2001-09-30.
RMS PUMPS, LLC (3026 SE 85TH AVE in PORTLAND, OR; small business)
$102,311 with Army for Centrifugals, Separators, and Pressure and Vacuum Filters. Signed on 2004-05-25. Completion date: 2004-09-15.
SPENCER ENVIRONMENTAL INC (6400 SE 101ST AVE in PORTLAND, OR; small business) : $18,060 in 3 contractsin 2002
$14,893 with U.S. Army Corps of Engineers - civil program financing only for Hazardous Substance Removal, Cleanup, and Disposal Services and Operational Support. Signed on 2002-02-13. Completion date: 2002-02-14.
$3,515, same as above.Signed on 2002-02-14. Completion date: 2002-03-29.
-$348 with U.S. Army Corps of Engineers - civil program financing only for Hazardous Substance Removal, Cleanup, and Disposal Services and Operational Support. Taking place in WA. Signed on 2002-11-01. Completion date: 2002-09-17.
Top industries in this zip code by the number of employees in 2005:
2002 - 2018 National Fire Incident Reporting System (NFIRS) incidents
Based on the data from the years 2002 - 2018 the average number of fire incidents per year is 150. The highest number of reported fires - 300 took place in 2003, and the least - 29 in 2010. The data has a decreasing trend.
When looking into fire subcategories, the most reports belonged to: Outside Fires (47.4%), and Structure Fires (29.3%).
Fire incident types reported to NFIRS in Zip Code 97266
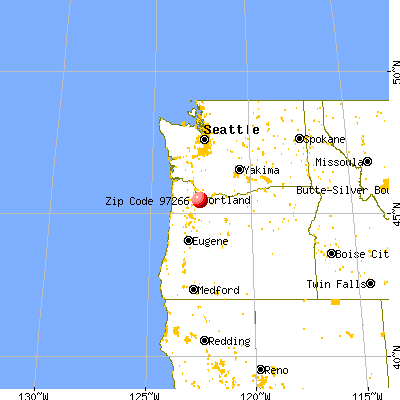


 Nearest zip codes: 97216, 97206, 97236, 97086, 97215, 97233.
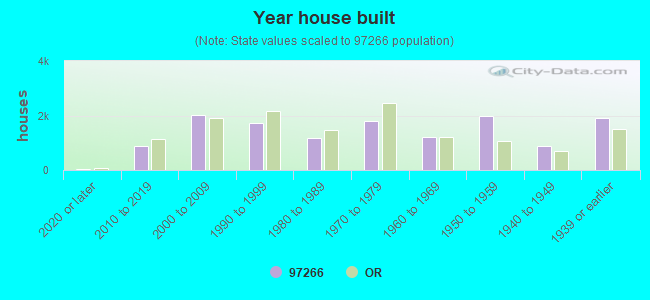


 Based on the data from the years 2002 - 2018 the average number of fire incidents per year is 150. The highest number of reported fires - 300 took place in 2003, and the least - 29 in 2010. The data has a decreasing trend.
 When looking into fire subcategories, the most reports belonged to: Outside Fires (47.4%), and Structure Fires (29.3%).