Estimated zip code population in 2022: 17,825 Zip code population in 2010: 16,375 Zip code population in 2000: 16,707
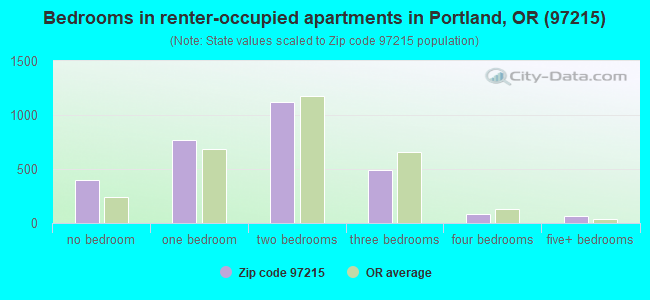
Houses and condos: 8,028 Renter-occupied apartments: 2,905
% of renters here:
37%
State:
37%
March 2022 cost of living index in zip code 97215: 104.7 (near average, U.S. average is 100)
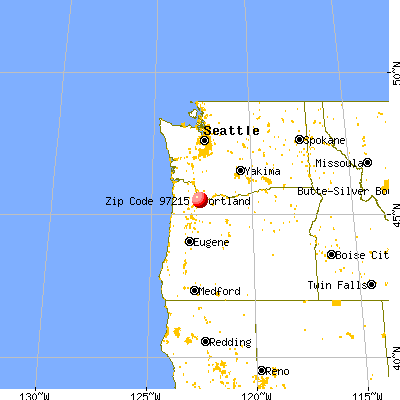
Land area: 2.3 sq. mi. Water area: 0.0 sq. mi.
Population density: 7,846 people per square mile
(high).
OSM Map
General Map
Google Map
MSN Map
OSM Map
General Map
Google Map
MSN Map
OSM Map
General Map
Google Map
MSN Map
OSM Map
General Map
Google Map
MSN Map
Please wait while loading the map...
Real estate property taxes paid for housing units in 2022:
This zip code:
0.9% ($6,368)
Oregon:
0.8% ($3,646)
Median real estate property taxes paid for housing units with mortgages in 2022: $6,338 (0.9%) Median real estate property taxes paid for housing units with no mortgage in 2022: $6,380 (0.9%)
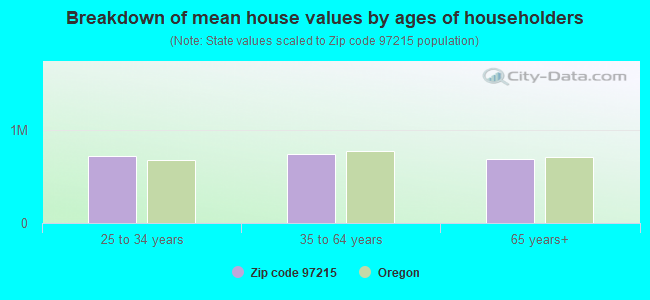
Estimated median house/condo value in 2022: $725,596
97215:
$725,596
Oregon:
$475,600
According to our research of Oregon and other state lists, there was 1 registered sex offender living in 97215 zip code as of April 27, 2024. The ratio of all residents to sex offenders in zip code 97215 is 17,750 to 1. The ratio of registered sex offenders to all residents in this zip code is much lower than the state average.
Median resident age:
This zip code:
41.4 years
Oregon median age:
40.5 years
Average household size:
This zip code:
2.2 people
Oregon:
2.4 people
Averages for the 2020 tax year for zip code 97215, filed in 2021:
Average Adjusted Gross Income (AGI) in 2020: $99,257 (Individual Income Tax Returns)
Here:
$99,257
State:
$76,001
Salary/wage: $83,747 (reported on 80.5% of returns)
Here:
$83,747
State:
$61,959
(% of AGI for various income ranges: 1110.8% for AGIs below $25k, 3645.2% for AGIs $25k-50k, 6821.3% for AGIs $50k-75k, 9540.8% for AGIs $75k-100k, 20907.6% for AGIs $100k-200k, 89336.2% for AGIs over 200k)
Taxable interest for individuals: $1,323 (reported on 48.1% of returns)
This zip code:
$1,323
Oregon:
$1,628
(% of AGI for various income ranges: 24.2% for AGIs below $25k, 38.2% for AGIs $25k-50k, 57.7% for AGIs $50k-75k, 108.3% for AGIs $75k-100k, 168.9% for AGIs $100k-200k, 829.7% for AGIs over 200k)
Ordinary dividends: $6,681 (reported on 32.4% of returns)
Here:
$6,681
State:
$7,165
(% of AGI for various income ranges: 60.6% for AGIs below $25k, 85.7% for AGIs $25k-50k, 140.4% for AGIs $50k-75k, 318.0% for AGIs $75k-100k, 569.8% for AGIs $100k-200k, 3470.7% for AGIs over 200k)
Net capital gain/loss in AGI: +$25,481 (reported on 30.1% of returns)
Here:
+$25,481
State:
+$23,403
(% of AGI for various income ranges: 52.7% for AGIs below $25k, 86.8% for AGIs $25k-50k, 129.3% for AGIs $50k-75k, 422.9% for AGIs $75k-100k, 1068.2% for AGIs $100k-200k, 19939.0% for AGIs over 200k)
Profit/loss from business: +$23,305 (reported on 20.9% of returns)
Here:
+$23,305
State:
+$16,511
(% of AGI for various income ranges: 209.4% for AGIs below $25k, 316.7% for AGIs $25k-50k, 499.8% for AGIs $50k-75k, 629.5% for AGIs $75k-100k, 1175.6% for AGIs $100k-200k, 6677.2% for AGIs over 200k)
Taxable individual retirement arrangement distribution: $21,041 (reported on 10.2% of returns)
97215:
$21,041
Oregon:
$20,730
(% of AGI for various income ranges: 85.7% for AGIs below $25k, 117.4% for AGIs $25k-50k, 210.4% for AGIs $50k-75k, 351.9% for AGIs $75k-100k, 836.9% for AGIs $100k-200k, 1966.2% for AGIs over 200k)
Self-employed (Keogh) retirement plans: $22,655 (reported on 2.1% of returns)
97215:
$22,655
Oregon:
$22,884
(% of AGI for various income ranges: 13.9% for AGIs below $25k, 54.8% for AGIs $50k-75k, 99.1% for AGIs $100k-200k, 997.9% for AGIs over 200k)
Total itemized deductions: $29,677 (reported on 19.1% of returns)
Here:
$29,677
State:
$31,050
(% of AGI for various income ranges: 116.1% for AGIs below $25k, 206.7% for AGIs $25k-50k, 500.8% for AGIs $50k-75k, 1042.9% for AGIs $75k-100k, 1848.2% for AGIs $100k-200k, 7355.2% for AGIs over 200k)
Charity contributions: $7,371 (reported on 15.1% of returns)
Here:
$7,371
State:
$8,791
(% of AGI for various income ranges: 8.1% for AGIs below $25k, 15.7% for AGIs $25k-50k, 39.3% for AGIs $50k-75k, 111.4% for AGIs $75k-100k, 266.8% for AGIs $100k-200k, 2345.9% for AGIs over 200k)
Taxes paid: $9,302 (reported on 19.0% of returns)
97215:
$9,302
State:
$8,487
(% of AGI for various income ranges: 33.4% for AGIs below $25k, 62.8% for AGIs $25k-50k, 177.1% for AGIs $50k-75k, 384.2% for AGIs $75k-100k, 652.0% for AGIs $100k-200k, 1882.4% for AGIs over 200k)
Earned income credit: $1,085 (reported on 6.9% of returns)
Here:
$1,085
State:
$1,977
(% of AGI for various income ranges: 32.8% for AGIs below $25k, 15.8% for AGIs $25k-50k)
Percentage of individuals using paid preparers for their 2020 taxes: 93.3%
Here:
93%
State:
93%
(% for various income ranges: 89.6% for AGIs below $25k, 93.9% for AGIs $25k-50k, 94.2% for AGIs $50k-75k, 93.5% for AGIs $75k-100k, 94.3% for AGIs $100k-200k, 97.0% for AGIs over 200k)
Averages for the 2012 tax year for zip code 97215, filed in 2013:
Average Adjusted Gross Income (AGI) in 2012: $63,612 (Individual Income Tax Returns)
Here:
$63,612
State:
$57,845
Salary/wage: $55,462 (reported on 83.2% of returns)
Here:
$55,462
State:
$47,723
(% of AGI for various income ranges: 74.0% for AGIs below $25k, 76.5% for AGIs $25k-50k, 77.1% for AGIs $50k-75k, 76.6% for AGIs $75k-100k, 77.6% for AGIs $100k-200k, 56.8% for AGIs over 200k)
Taxable interest for individuals: $1,314 (reported on 41.9% of returns)
This zip code:
$1,314
Oregon:
$1,848
(% of AGI for various income ranges: 1.7% for AGIs below $25k, 1.2% for AGIs $25k-50k, 0.7% for AGIs $50k-75k, 0.8% for AGIs $75k-100k, 0.6% for AGIs $100k-200k, 0.9% for AGIs over 200k)
Ordinary dividends: $5,142 (reported on 28.3% of returns)
Here:
$5,142
State:
$5,987
(% of AGI for various income ranges: 2.7% for AGIs below $25k, 1.9% for AGIs $25k-50k, 1.6% for AGIs $50k-75k, 1.6% for AGIs $75k-100k, 2.0% for AGIs $100k-200k, 3.7% for AGIs over 200k)
Net capital gain/loss in AGI: +$10,052 (reported on 23.0% of returns)
Here:
+$10,052
State:
+$13,095
(% of AGI for various income ranges: 0.8% for AGIs $25k-50k, 0.9% for AGIs $50k-75k, 1.1% for AGIs $75k-100k, 2.0% for AGIs $100k-200k, 12.4% for AGIs over 200k)
Profit/loss from business: +$16,240 (reported on 19.5% of returns)
Here:
+$16,240
State:
+$13,871
(% of AGI for various income ranges: 10.9% for AGIs below $25k, 5.9% for AGIs $25k-50k, 4.6% for AGIs $50k-75k, 5.2% for AGIs $75k-100k, 3.8% for AGIs $100k-200k, 4.3% for AGIs over 200k)
Taxable individual retirement arrangement distribution: $13,745 (reported on 10.2% of returns)
97215:
$13,745
Oregon:
$16,036
(% of AGI for various income ranges: 3.1% for AGIs below $25k, 2.7% for AGIs $25k-50k, 2.3% for AGIs $50k-75k, 2.4% for AGIs $75k-100k, 1.9% for AGIs $100k-200k, 1.9% for AGIs over 200k)
Self-employment retirement plans: $14,586 (reported on 1.6% of returns)
97215:
$14,586
Oregon:
$19,462
(% of AGI for various income ranges: 0.4% for AGIs $25k-50k, 0.4% for AGIs $75k-100k, 0.3% for AGIs $100k-200k, 0.8% for AGIs over 200k)
Total itemized deductions: $23,646 (22% of AGI, reported on 45.0% of returns)
Here:
$23,646
State:
$24,430
Here:
22.3% of AGI
State:
23.2% of AGI
(% of AGI for various income ranges: 13.9% for AGIs below $25k, 12.7% for AGIs $25k-50k, 17.0% for AGIs $50k-75k, 19.7% for AGIs $75k-100k, 18.5% for AGIs $100k-200k, 15.5% for AGIs over 200k)
Charity contributions: $2,658 (reported on 37.3% of returns)
Here:
$2,658
State:
$3,648
(% of AGI for various income ranges: 0.7% for AGIs below $25k, 1.0% for AGIs $25k-50k, 1.3% for AGIs $50k-75k, 1.6% for AGIs $75k-100k, 1.7% for AGIs $100k-200k, 2.1% for AGIs over 200k)
Taxes paid: $11,248 (reported on 44.8% of returns)
97215:
$11,248
State:
$10,269
(% of AGI for various income ranges: 3.3% for AGIs below $25k, 4.3% for AGIs $25k-50k, 7.0% for AGIs $50k-75k, 8.8% for AGIs $75k-100k, 9.4% for AGIs $100k-200k, 9.4% for AGIs over 200k)
Earned income credit: $1,204 (reported on 11.0% of returns)
Here:
$1,204
State:
$2,021
(% of AGI for various income ranges: 2.3% for AGIs below $25k, 0.4% for AGIs $25k-50k)
Percentage of individuals using paid preparers for their 2012 taxes: 42.3%
Here:
42%
State:
47%
(% for various income ranges: 32.9% for AGIs below $25k, 38.1% for AGIs $25k-50k, 47.2% for AGIs $50k-75k, 49.5% for AGIs $75k-100k, 52.0% for AGIs $100k-200k, 77.1% for AGIs over 200k)
Averages for the 2004 tax year for zip code 97215, filed in 2005:
Average Adjusted Gross Income (AGI) in 2004: $47,097 (Individual Income Tax Returns)
Here:
$47,097
State:
$46,788
Salary/wage: $41,721 (reported on 84.3% of returns)
Here:
$41,721
State:
$39,788
(% of AGI for various income ranges: 146.1% for AGIs below $10k, 77.6% for AGIs $10k-25k, 80.7% for AGIs $25k-50k, 79.4% for AGIs $50k-75k, 78.7% for AGIs $75k-100k, 64.1% for AGIs over 100k)
Taxable interest for individuals: $1,524 (reported on 49.2% of returns)
This zip code:
$1,524
Oregon:
$2,126
(% of AGI for various income ranges: 15.8% for AGIs below $10k, 1.7% for AGIs $10k-25k, 1.4% for AGIs $25k-50k, 1.3% for AGIs $50k-75k, 1.3% for AGIs $75k-100k, 1.5% for AGIs over 100k)
Taxable dividends: $2,942 (reported on 29.9% of returns)
Here:
$2,942
State:
$3,427
(% of AGI for various income ranges: 10.0% for AGIs below $10k, 1.7% for AGIs $10k-25k, 1.3% for AGIs $25k-50k, 1.3% for AGIs $50k-75k, 1.8% for AGIs $75k-100k, 2.3% for AGIs over 100k)
Net capital gain/loss: +$8,520 (reported on 24.5% of returns)
Here:
+$8,520
State:
+$12,447
(% of AGI for various income ranges: -3.5% for AGIs below $10k, 0.2% for AGIs $10k-25k, 0.9% for AGIs $25k-50k, 1.1% for AGIs $50k-75k, 2.5% for AGIs $75k-100k, 10.4% for AGIs over 100k)
Profit/loss from business: +$14,314 (reported on 17.8% of returns)
Here:
+$14,314
State:
+$11,682
(% of AGI for various income ranges: 12.0% for AGIs below $10k, 7.0% for AGIs $10k-25k, 4.8% for AGIs $25k-50k, 4.2% for AGIs $50k-75k, 4.7% for AGIs $75k-100k, 6.2% for AGIs over 100k)
IRA payment deduction: $2,843 (reported on 3.8% of returns)
97215:
$2,843
Oregon:
$3,035
(% of AGI for various income ranges: 0.3% for AGIs $10k-25k, 0.4% for AGIs $25k-50k, 0.3% for AGIs $50k-75k, 0.2% for AGIs $75k-100k, 0.1% for AGIs over 100k)
Self-employed pension: $13,405 (reported on 2.0% of returns)
Here:
$13,405
Oregon:
$14,224
(% of AGI for various income ranges: 0.3% for AGIs $10k-25k, 0.1% for AGIs $25k-50k, 0.2% for AGIs $50k-75k, 0.4% for AGIs $75k-100k, 1.2% for AGIs over 100k)
Total itemized deductions: $19,468 (25% of AGI, reported on 46.8% of returns)
Here:
$19,468
State:
$20,209
Here:
25.5% of AGI
State:
24.7% of AGI
(% of AGI for various income ranges: 39.6% for AGIs below $10k, 12.7% for AGIs $10k-25k, 19.0% for AGIs $25k-50k, 22.4% for AGIs $50k-75k, 22.1% for AGIs $75k-100k, 17.6% for AGIs over 100k)
Charity contributions deductions: $2,236 (3% of AGI, reported on 40.7% of returns)
Here:
$2,236
State:
$3,145
Here:
2.8% of AGI
State:
3.6% of AGI
(% of AGI for various income ranges: 1.7% for AGIs below $10k, 1.1% for AGIs $10k-25k, 1.4% for AGIs $25k-50k, 2.1% for AGIs $50k-75k, 2.0% for AGIs $75k-100k, 2.3% for AGIs over 100k)
Total tax: $6,864 (reported on 80.9% of returns)
97215:
$6,864
State:
$7,148
(% of AGI for various income ranges: 4.9% for AGIs below $10k, 5.2% for AGIs $10k-25k, 7.9% for AGIs $25k-50k, 9.7% for AGIs $50k-75k, 10.8% for AGIs $75k-100k, 17.4% for AGIs over 100k)
Earned income credit: $1,145 (reported on 10.4% of returns)
Here:
$1,145
State:
$1,605
Percentage of individuals using paid preparers for their 2004 taxes: 45.7%
Here:
46%
State:
53%
(% for various income ranges: 37.8% for AGIs below $10k, 40.1% for AGIs $10k-25k, 45.1% for AGIs $25k-50k, 50.5% for AGIs $50k-75k, 51.5% for AGIs $75k-100k, 62.3% for AGIs over 100k)
Likely homosexual households (counted as self-reported same-sex unmarried-partner households)
Lesbian couples: 0.2% of all households
Gay men: 0.5% of all households
Household received Food Stamps/SNAP in the past 12 months: 897 Household did not receive Food Stamps/SNAP in the past 12 months: 6,868
Women who had a birth in the past 12 months: 137 (137 now married, 0 unmarried) Women who did not have a birth in the past 12 months: 4,568 (1,823 now married, 2,748 unmarried)
Housing units in zip code 97215 with a mortgage: 3,104 (396 second mortgage, 32 home equity loan, 366 both second mortgage and home equity loan) Houses without a mortgage: 44
Median monthly owner costs for units with a mortgage: $2,652 Median monthly owner costs for units without a mortgage: $878
Residents with income below the poverty level in 2022:
This zip code:
7.4%
Whole state:
12.1%
Residents with income below 50% of the poverty level in 2022:
This zip code:
3.5%
Whole state:
6.2%
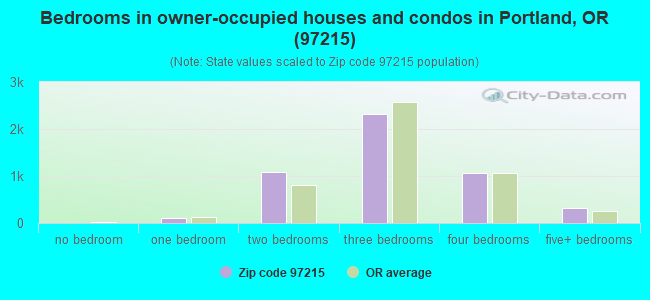
Median number of rooms in houses and condos:
Here:
6.7
State:
6.2
Median number of rooms in apartments:
Here:
3.8
State:
4.0
Notable locations in this zip code not listed on our city pages
Churches in zip code 97215 include: United Methodist Church of Tabor Heights (A), Unity Church of Portland (B), Worldview Center (C), Montavilla United Methodist Church (D), Mount Tabor Presbyterian Church (E), Grace Baptist Church (F), Lincoln Street Methodist Church (G), Metropolitan Vineyard Christian Fellowship (H), Saint Stephens Catholic Church (I). Display/hide their locations on the map
Reservoirs: City of Portland Reservoir Number 1 (A), City of Portland Reservoir Number 5 (B), City of Portland Reservoir Number 6 (C). Display/hide their locations on the map
2,076 married couples with children.
649 single-parent households (91 men, 558 women).
88.1% of residents of 97215 zip code speak English at home.
3.1% of residents speak Spanish at home (87% very well, 3% well, 9% not well).
2.9% of residents speak other Indo-European language at home (93% very well, 3% well, 4% not well).
5.0% of residents speak Asian or Pacific Island language at home (78% very well, 9% well, 13% not well).
0.2% of residents speak other language at home (19% very well, 30% well, 52% not well).
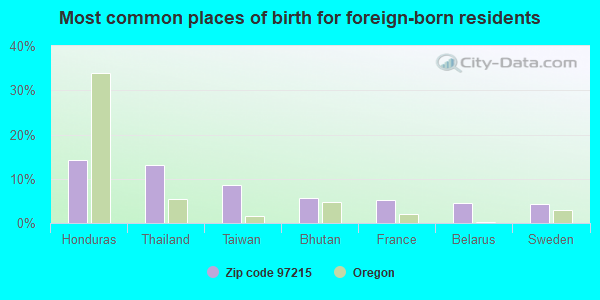
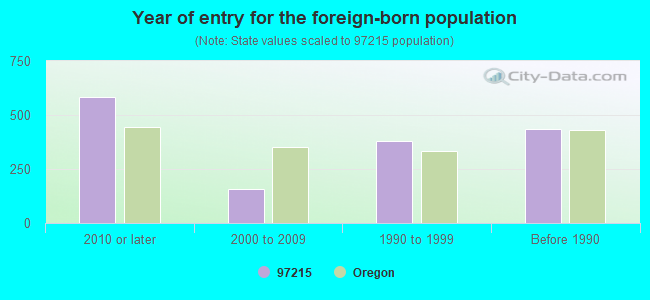
Foreign born population: 1,190 (6.7%) (61.0% of them are naturalized citizens)
Facilities with environmental interests located in this zip code:
BLACKS DRY CLEANERS AND LAUNDRY (4615 SOUTHEAST HAWTHORNE BOULEVARD in PORTLAND, OR)
CRITERIA AND HAZARDOUS AIR POLLUTANT INVENTORY (Inventory of air pollution sources) STATE MASTER (Oregon inspections and permits database) - OR-LUST-26-95-0087, LEAKING STORAGE TANK, OR-HWMS-4629, CESQG, OR-ECSI-2458, SUPERFUND Conditionally Exempt Small Quantity Generators, less than 100 kg/month of hazardous waste (Resource Conservation and Recovery Act (tracking hazardous waste)) - notification Conditionally Exempt Small Quantity Generators, less than 100 kg/month of hazardous waste (Resource Conservation and Recovery Act (tracking hazardous waste)) HAZARDOUS WASTE BIENNIAL REPORTER (Resource Conservation and Recovery Act (tracking hazardous waste)) Business SIC classification: DRYCLEANING PLANTS, EXCEPT RUG CLEANING; GENERAL GOVERNMENT Organizations: DEPARTMENT OF ENVIRONMENTAL QUALITY WMC (CONTACT/ HAZARDOUS WASTE)
, BLACKS SUPERIOR DRY CLEANER LAUNDRY (CONTACT/ HAZARDOUS WASTE)
, BLACKS SUPERIOR DRY CLEANER LDRY (CONTACT/ HAZARDOUS WASTE)
, ODEQ DRY CLEANER PROGRAM ATTN: BRUCE GIL (CONTACT/OPERATOR)
, BLACKS SUPERIOR DRY CLEANER LAUNDRY (CONTACT/OPERATOR)
, BLACKS DRY CLEANERS INC (CONTACT/OWNER)
, ODEQ DRY CLEANER PROGRAM ATTN: BRUCE GIL (CONTACT/OWNER)
, BLACKS DRY CLEANERS INC (HAZARDOUS WASTE LEGAL OWNER)
, BLACKS SUPERIOR DRY CLEANER LAUNDRY (HAZARDOUS WASTE OPERATOR)
, DEPARTMENT OF ENVIRONMENTAL QUALITY WMC (HAZARDOUS WASTE SITE CONTACT)
, DEPARTMENT OF ENVIRONMENTAL QUALITY (HAZARDOUS WASTE SITE CONTACT)
, BLACKS SUPERIOR DRY CLEANER LAUNDRY (HAZARDOUS WASTE SITE CONTACT)
Alternative names: BLACKS CLEANERS, BLACKS SUPERIOR DRY CLEANER LDRY, BLACKS SUPERIOR DRY CLEANER LAUNDRY, ODEQ DRY CLEANER BLACKS CLEANERS
CITY OF PORTLAND VEHICLE SERVICES (4735 EAST BURNSIDE STREET in PORTLAND, OR)
STATE MASTER (Oregon inspections and permits database) - OR-UST-GJBA, LEAKING STORAGE TANK, OR-HWMS-2997, CESQG Conditionally Exempt Small Quantity Generators, less than 100 kg/month of hazardous waste (Resource Conservation and Recovery Act (tracking hazardous waste)) - notification Business SIC classification: GENERAL AUTOMOTIVE REPAIR SHOPS Business NAICS classification: GENERAL AUTOMOTIVE REPAIR.; GENERAL AUTOMOTIVE REPAIR. Organizations: PORTLAND CITY OF VEHICLE SERVICES (CONTACT/ HAZARDOUS WASTE)
, PORTLAND, CITY OF (CONTACT/GENERAL)
, KYLE NICKELS (CONTACT/OPERATOR)
, PORTLAND CITY OF EAST PRECINCT GARAGE (CONTACT/OWNER)
, MULTNOMAH COUNTY FACILITIES MANAGEMENT (HAZARDOUS WASTE LAND OWNER)
, PORTLAND CITY OF EAST PRECINCT GARAGE (HAZARDOUS WASTE LEGAL OWNER)
, PORTLAND CITY OF VEHICLE SERVICES (HAZARDOUS WASTE SITE CONTACT)
Alternative names: PORTLAND CITY OF SE PRECINCT GARAGE, PORTLAND CITY OF VEHICLE SVCS 47TH AVE
DAVE BURNETT INSTALLATIONS (364 SE 45TH AVE in PORTLAND, OR)
STATE MASTER (Oregon inspections and permits database) - OR-HWMS-1807, CESQG (Resource Conservation and Recovery Act (tracking hazardous waste)) Business SIC and NAICS classification: SERVICES Organizations: DAVID & DONNA BURNETT (CONTACT/OWNER)
HAWTHORNE AUTO CLINIC INC (4307 SE HAWTHORNE BLVD in PORTLAND, OR)
STATE MASTER (Oregon inspections and permits database) - OR-LUST-26-90-0085, LEAKING STORAGE TANK, OR-HWMS-1766, CESQG Conditionally Exempt Small Quantity Generators, less than 100 kg/month of hazardous waste (Resource Conservation and Recovery Act (tracking hazardous waste)) - notification Business SIC classification: GENERAL AUTOMOTIVE REPAIR SHOPS Business NAICS classification: GENERAL AUTOMOTIVE REPAIR.; GENERAL AUTOMOTIVE REPAIR. Organizations: HAWTHORNE AUTO CLINIC, INC. (CONTACT/ HAZARDOUS WASTE)
BRIDGER ELEM. SCHOOL (7910 SE MARKET ST in PORTLAND, OR)
(National Center for Education Statistics) - STATE ID-834 Organizations: PORTLAND SCH DIST 1J (SCHOOL DISTRICT)
GLENCOE ELEM. SCHOOL (825 SE 51ST AVE in PORTLAND, OR)
(National Center for Education Statistics) - STATE ID-850 Organizations: PORTLAND SCH DIST 1J (SCHOOL DISTRICT)
HOUCKS PROCESS OF PORTLAND INC (2376 SE 47TH AVE in PORTLAND, OR)
(Resource Conservation and Recovery Act (tracking hazardous waste)) Organizations: RONALD & JACKIE BAUER (CONTACT/OPERATOR)
BEETS AUTO BODY (518 SE 76TH AVE in PORTLAND, OR)
(Resource Conservation and Recovery Act (tracking hazardous waste))
FIRST INTERSTATE BANK OF OREGO (4860 SE STARK ST in PORTLAND, OR)
(Resource Conservation and Recovery Act (tracking hazardous waste)) Organizations: FIRST INTERSTATE BANK OF OREGON, N.A. AN (CONTACT/OWNER)
Alternative names: FIRST INTERSTATE BANK OF OREGON
DENNYS DENTAL LABORATORY (316 SE 80TH AVE in PORTLAND, OR)
(Resource Conservation and Recovery Act (tracking hazardous waste)) Business NAICS classification: DENTAL LABORATORIES.
COIN LAUN-DRY (4725 SE BELMONT ST in PORTLAND, OR)
CRITERIA AND HAZARDOUS AIR POLLUTANT INVENTORY (Inventory of air pollution sources) Business SIC classification: POWER LAUNDRIES, FAMILY AND COMMERCIAL Business NAICS classification: DRYCLEANING AND LAUNDRY SERVICES (EXCEPT COIN-OPERATED).
Housing units lacking complete plumbing facilities: 0.1% Housing units lacking complete kitchen facilities: 0.5%
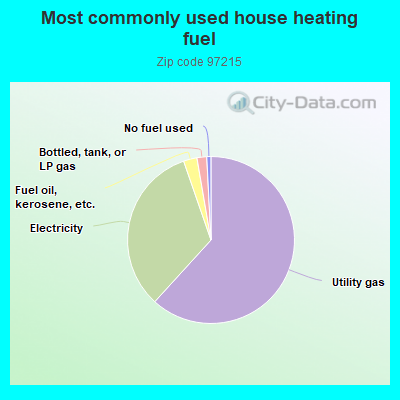
61.7%Utility gas
32.9%Electricity
2.6%Fuel oil, kerosene, etc.
1.9%Bottled, tank, or LP gas
0.8%No fuel used
Population in 1990: 16,563. Population change in the 1990s: +144 (+0.9%).
Place of birth for U.S.-born residents:
This state: 5,998
Northeast: 1,789
Midwest: 2,362
South: 1,333
West: 4,784
52% of the 97215 zip code residents lived in the same house 5 years ago. Out of people who lived in different houses, 57% lived in this county. Out of people who lived in different counties, 50% lived in Oregon.
85% of the 97215 zip code residents lived in the same house 1 year ago. Out of people who lived in different houses, 63% moved from this county. Out of people who lived in different houses, 11% moved from different county within same state. Out of people who lived in different houses, 22% moved from different state. Out of people who lived in different houses, 1% moved from abroad.
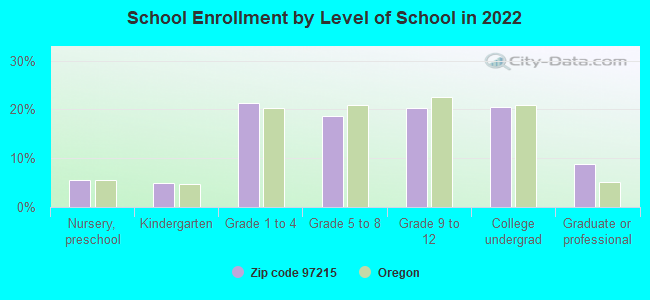
Private vs. public school enrollment:
Students in private schools in grades 1 to 8 (elementary and middle school): 186
Here:
14.6%
Oregon:
13.7%
Students in private schools in grades 9 to 12 (high school): 123
Here:
19.2%
Oregon:
8.8%
Students in private undergraduate colleges: 223
Here:
34.3%
Oregon:
17.7%
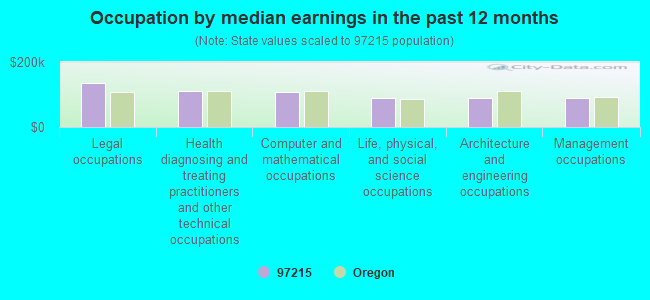
Occupation by median earnings in the past 12 months ($)
135,078Legal occupations
109,281Health diagnosing and treating practitioners and other technical occupations
106,268Computer and mathematical occupations
89,989Life, physical, and social science occupations
88,276Architecture and engineering occupations
87,726Management occupations
Top industries in this zip code by the number of employees in 2005:
Educational Services: Colleges, Universities, and Professional Schools (250-499 employees: 1 establishment, 100-249 employees: 1 establishment)
Health Care and Social Assistance: Nursing Care Facilities (100-249: 1, 50-99: 1, 20-49: 1, 1-4: 1)
Health Care and Social Assistance: Other Individual and Family Services (100-249: 1, 5-9: 1, 1-4: 2)
Health Care and Social Assistance: Vocational Rehabilitation Services (100-249: 1, 1-4: 1)
2002 - 2018 National Fire Incident Reporting System (NFIRS) incidents
Based on the data from the years 2002 - 2018 the average number of fire incidents per year is 30. The highest number of reported fires - 55 took place in 2003, and the least - 7 in 2017. The data has a decreasing trend.
When looking into fire subcategories, the most incidents belonged to: Outside Fires (49.1%), and Structure Fires (36.9%).
Fire incident types reported to NFIRS in Zip Code 97215


 Nearest zip codes: 97213, 97206, 97216, 97214, 97232, 97212.


 Based on the data from the years 2002 - 2018 the average number of fire incidents per year is 30. The highest number of reported fires - 55 took place in 2003, and the least - 7 in 2017. The data has a decreasing trend.
 When looking into fire subcategories, the most incidents belonged to: Outside Fires (49.1%), and Structure Fires (36.9%).