Estimated zip code population in 2022: 17,493 Zip code population in 2010: 15,594 Zip code population in 2000: 13,142
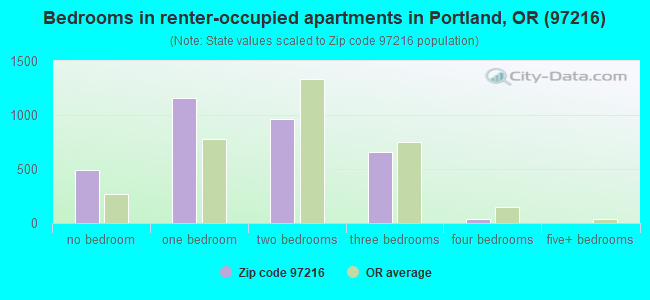
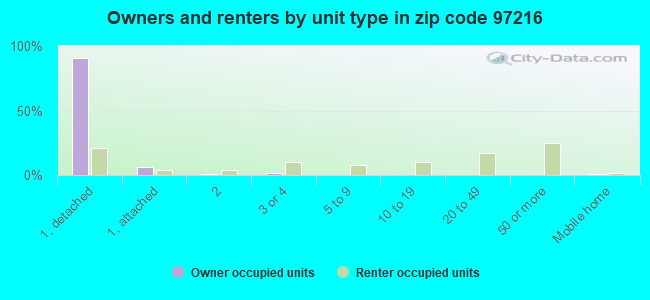
Houses and condos: 7,489 Renter-occupied apartments: 3,287
% of renters here:
45%
State:
37%
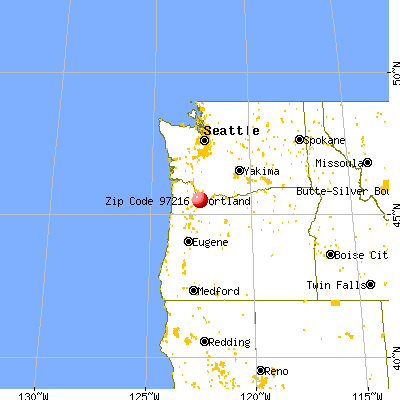
March 2022 cost of living index in zip code 97216: 104.6 (near average, U.S. average is 100)
Land area: 2.5 sq. mi. Water area: 0.0 sq. mi.
Population density: 6,897 people per square mile
(high).
OSM Map
General Map
Google Map
MSN Map
OSM Map
General Map
Google Map
MSN Map
OSM Map
General Map
Google Map
MSN Map
OSM Map
General Map
Google Map
MSN Map
Please wait while loading the map...
Real estate property taxes paid for housing units in 2022:
This zip code:
0.9% ($4,103)
Oregon:
0.8% ($3,646)
Median real estate property taxes paid for housing units with mortgages in 2022: $4,020 (0.9%) Median real estate property taxes paid for housing units with no mortgage in 2022: $4,316 (0.9%)
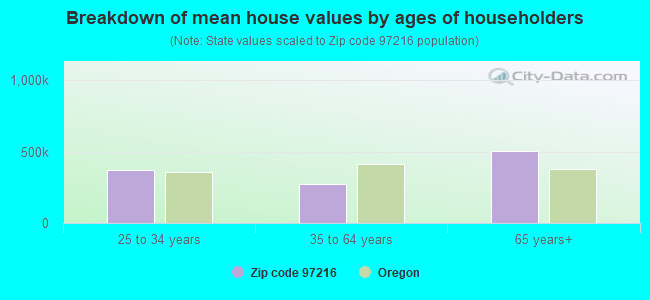
Estimated median house/condo value in 2022: $468,181
97216:
$468,181
Oregon:
$475,600
According to our research of Oregon and other state lists, there were 6 registered sex offenders living in 97216 zip code as of April 27, 2024. The ratio of all residents to sex offenders in zip code 97216 is 2,851 to 1. The ratio of registered sex offenders to all residents in this zip code is lower than the state average.
Median resident age:
This zip code:
40.4 years
Oregon median age:
40.5 years
Average household size:
This zip code:
2.4 people
Oregon:
2.4 people
Averages for the 2020 tax year for zip code 97216, filed in 2021:
Average Adjusted Gross Income (AGI) in 2020: $52,678 (Individual Income Tax Returns)
Here:
$52,678
State:
$76,001
Salary/wage: $46,917 (reported on 81.7% of returns)
Here:
$46,917
State:
$61,959
(% of AGI for various income ranges: 1194.5% for AGIs below $25k, 3674.0% for AGIs $25k-50k, 6777.2% for AGIs $50k-75k, 10150.9% for AGIs $75k-100k, 17850.2% for AGIs $100k-200k)
Taxable interest for individuals: $958 (reported on 29.2% of returns)
This zip code:
$958
Oregon:
$1,628
(% of AGI for various income ranges: 13.2% for AGIs below $25k, 13.8% for AGIs $25k-50k, 44.5% for AGIs $50k-75k, 94.8% for AGIs $75k-100k, 91.4% for AGIs $100k-200k)
Ordinary dividends: $3,793 (reported on 15.1% of returns)
Here:
$3,793
State:
$7,165
(% of AGI for various income ranges: 30.8% for AGIs below $25k, 31.9% for AGIs $25k-50k, 93.2% for AGIs $50k-75k, 160.0% for AGIs $75k-100k, 292.7% for AGIs $100k-200k)
Net capital gain/loss in AGI: +$9,454 (reported on 14.7% of returns)
Here:
+$9,454
State:
+$23,403
(% of AGI for various income ranges: 9.3% for AGIs below $25k, 19.2% for AGIs $25k-50k, 64.6% for AGIs $50k-75k, 185.7% for AGIs $75k-100k, 608.6% for AGIs $100k-200k)
Profit/loss from business: +$11,479 (reported on 16.6% of returns)
Here:
+$11,479
State:
+$16,511
(% of AGI for various income ranges: 180.3% for AGIs below $25k, 198.9% for AGIs $25k-50k, 310.1% for AGIs $50k-75k, 261.7% for AGIs $75k-100k, 854.1% for AGIs $100k-200k)
Taxable individual retirement arrangement distribution: $15,900 (reported on 7.0% of returns)
97216:
$15,900
Oregon:
$20,730
(% of AGI for various income ranges: 45.1% for AGIs below $25k, 65.9% for AGIs $25k-50k, 163.0% for AGIs $50k-75k, 254.1% for AGIs $75k-100k, 833.9% for AGIs $100k-200k)
Total itemized deductions: $24,934 (reported on 11.1% of returns)
Here:
$24,934
State:
$31,050
(% of AGI for various income ranges: 87.9% for AGIs below $25k, 146.8% for AGIs $25k-50k, 500.8% for AGIs $50k-75k, 981.5% for AGIs $75k-100k, 1312.7% for AGIs $100k-200k)
Charity contributions: $5,237 (reported on 7.7% of returns)
Here:
$5,237
State:
$8,791
(% of AGI for various income ranges: 5.2% for AGIs below $25k, 14.8% for AGIs $25k-50k, 54.9% for AGIs $50k-75k, 141.7% for AGIs $75k-100k, 252.4% for AGIs $100k-200k)
Taxes paid: $7,854 (reported on 11.1% of returns)
97216:
$7,854
State:
$8,487
(% of AGI for various income ranges: 11.8% for AGIs below $25k, 36.5% for AGIs $25k-50k, 165.1% for AGIs $50k-75k, 359.1% for AGIs $75k-100k, 452.4% for AGIs $100k-200k)
Earned income credit: $1,902 (reported on 15.7% of returns)
Here:
$1,902
State:
$1,977
(% of AGI for various income ranges: 77.6% for AGIs below $25k, 56.4% for AGIs $25k-50k, 1.2% for AGIs $50k-75k)
Percentage of individuals using paid preparers for their 2020 taxes: 92.9%
Here:
93%
State:
93%
(% for various income ranges: 91.5% for AGIs below $25k, 93.1% for AGIs $25k-50k, 92.1% for AGIs $50k-75k, 95.1% for AGIs $75k-100k, 94.4% for AGIs $100k-200k, 100.0% for AGIs over 200k)
Averages for the 2012 tax year for zip code 97216, filed in 2013:
Average Adjusted Gross Income (AGI) in 2012: $38,856 (Individual Income Tax Returns)
Here:
$38,856
State:
$57,845
Salary/wage: $35,728 (reported on 81.1% of returns)
Here:
$35,728
State:
$47,723
(% of AGI for various income ranges: 73.2% for AGIs below $25k, 80.5% for AGIs $25k-50k, 77.8% for AGIs $50k-75k, 73.5% for AGIs $75k-100k, 80.4% for AGIs $100k-200k)
Taxable interest for individuals: $1,233 (reported on 26.5% of returns)
This zip code:
$1,233
Oregon:
$1,848
(% of AGI for various income ranges: 0.9% for AGIs below $25k, 0.7% for AGIs $25k-50k, 1.0% for AGIs $50k-75k, 0.7% for AGIs $75k-100k, 1.1% for AGIs $100k-200k, 0.3% for AGIs over 200k)
Ordinary dividends: $3,832 (reported on 14.4% of returns)
Here:
$3,832
State:
$5,987
(% of AGI for various income ranges: 1.9% for AGIs below $25k, 1.1% for AGIs $25k-50k, 1.1% for AGIs $50k-75k, 1.5% for AGIs $75k-100k, 2.2% for AGIs $100k-200k)
Net capital gain/loss in AGI: +$5,182 (reported on 11.5% of returns)
Here:
+$5,182
State:
+$13,095
(% of AGI for various income ranges: 0.2% for AGIs $25k-50k, 0.4% for AGIs $50k-75k, 0.9% for AGIs $75k-100k, 8.6% for AGIs $100k-200k)
Profit/loss from business: +$9,376 (reported on 13.0% of returns)
Here:
+$9,376
State:
+$13,871
(% of AGI for various income ranges: 9.4% for AGIs below $25k, 2.5% for AGIs $25k-50k, 1.5% for AGIs $50k-75k, 1.7% for AGIs $75k-100k, 3.1% for AGIs $100k-200k)
Taxable individual retirement arrangement distribution: $9,806 (reported on 9.6% of returns)
97216:
$9,806
Oregon:
$16,036
(% of AGI for various income ranges: 2.8% for AGIs below $25k, 1.9% for AGIs $25k-50k, 2.2% for AGIs $50k-75k, 3.1% for AGIs $75k-100k, 3.3% for AGIs $100k-200k)
Total itemized deductions: $17,488 (27% of AGI, reported on 31.1% of returns)
Here:
$17,488
State:
$24,430
Here:
26.6% of AGI
State:
23.2% of AGI
(% of AGI for various income ranges: 9.8% for AGIs below $25k, 11.5% for AGIs $25k-50k, 14.9% for AGIs $50k-75k, 18.1% for AGIs $75k-100k, 16.6% for AGIs $100k-200k, 13.8% for AGIs over 200k)
Charity contributions: $2,874 (reported on 24.3% of returns)
Here:
$2,874
State:
$3,648
(% of AGI for various income ranges: 1.1% for AGIs below $25k, 1.2% for AGIs $25k-50k, 1.7% for AGIs $50k-75k, 2.6% for AGIs $75k-100k, 2.4% for AGIs $100k-200k, 3.4% for AGIs over 200k)
Taxes paid: $6,427 (reported on 30.4% of returns)
97216:
$6,427
State:
$10,269
(% of AGI for various income ranges: 1.8% for AGIs below $25k, 3.4% for AGIs $25k-50k, 5.3% for AGIs $50k-75k, 7.1% for AGIs $75k-100k, 7.8% for AGIs $100k-200k, 7.5% for AGIs over 200k)
Earned income credit: $2,160 (reported on 21.3% of returns)
Here:
$2,160
State:
$2,021
(% of AGI for various income ranges: 6.4% for AGIs below $25k, 0.9% for AGIs $25k-50k)
Percentage of individuals using paid preparers for their 2012 taxes: 45.3%
Here:
45%
State:
47%
(% for various income ranges: 43.3% for AGIs below $25k, 44.9% for AGIs $25k-50k, 46.8% for AGIs $50k-75k, 47.2% for AGIs $75k-100k, 54.3% for AGIs $100k-200k, 100.0% for AGIs over 200k)
Averages for the 2004 tax year for zip code 97216, filed in 2005:
Average Adjusted Gross Income (AGI) in 2004: $32,573 (Individual Income Tax Returns)
Here:
$32,573
State:
$46,788
Salary/wage: $30,854 (reported on 81.6% of returns)
Here:
$30,854
State:
$39,788
(% of AGI for various income ranges: 90.9% for AGIs below $10k, 75.7% for AGIs $10k-25k, 81.7% for AGIs $25k-50k, 79.5% for AGIs $50k-75k, 78.2% for AGIs $75k-100k, 57.0% for AGIs over 100k)
Taxable interest for individuals: $1,809 (reported on 36.7% of returns)
This zip code:
$1,809
Oregon:
$2,126
(% of AGI for various income ranges: 5.4% for AGIs below $10k, 2.7% for AGIs $10k-25k, 1.7% for AGIs $25k-50k, 1.5% for AGIs $50k-75k, 1.7% for AGIs $75k-100k, 3.2% for AGIs over 100k)
Taxable dividends: $2,672 (reported on 17.6% of returns)
Here:
$2,672
State:
$3,427
(% of AGI for various income ranges: 3.7% for AGIs below $10k, 1.8% for AGIs $10k-25k, 1.0% for AGIs $25k-50k, 1.2% for AGIs $50k-75k, 1.1% for AGIs $75k-100k, 3.0% for AGIs over 100k)
Net capital gain/loss: +$3,477 (reported on 14.2% of returns)
Here:
+$3,477
State:
+$12,447
(% of AGI for various income ranges: -1.5% for AGIs below $10k, 0.2% for AGIs $10k-25k, 0.2% for AGIs $25k-50k, 0.6% for AGIs $50k-75k, 1.5% for AGIs $75k-100k, 9.9% for AGIs over 100k)
Profit/loss from business: +$6,809 (reported on 12.6% of returns)
Here:
+$6,809
State:
+$11,682
(% of AGI for various income ranges: 13.6% for AGIs below $10k, 4.7% for AGIs $10k-25k, 2.4% for AGIs $25k-50k, 2.2% for AGIs $50k-75k, -0.1% for AGIs $75k-100k, 2.1% for AGIs over 100k)
IRA payment deduction: $2,693 (reported on 2.3% of returns)
97216:
$2,693
Oregon:
$3,035
(% of AGI for various income ranges: 0.4% for AGIs $10k-25k, 0.2% for AGIs $25k-50k, 0.1% for AGIs $50k-75k, 0.2% for AGIs $75k-100k)
Total itemized deductions: $15,471 (30% of AGI, reported on 37.9% of returns)
Here:
$15,471
State:
$20,209
Here:
30.2% of AGI
State:
24.7% of AGI
(% of AGI for various income ranges: 18.6% for AGIs below $10k, 14.2% for AGIs $10k-25k, 17.2% for AGIs $25k-50k, 20.6% for AGIs $50k-75k, 19.4% for AGIs $75k-100k, 18.2% for AGIs over 100k)
Charity contributions deductions: $2,352 (4% of AGI, reported on 31.1% of returns)
Here:
$2,352
State:
$3,145
Here:
4.4% of AGI
State:
3.6% of AGI
(% of AGI for various income ranges: 1.5% for AGIs below $10k, 1.8% for AGIs $10k-25k, 1.9% for AGIs $25k-50k, 2.4% for AGIs $50k-75k, 2.8% for AGIs $75k-100k, 2.9% for AGIs over 100k)
Total tax: $3,628 (reported on 70.8% of returns)
97216:
$3,628
State:
$7,148
(% of AGI for various income ranges: 3.3% for AGIs below $10k, 3.9% for AGIs $10k-25k, 6.6% for AGIs $25k-50k, 8.4% for AGIs $50k-75k, 9.8% for AGIs $75k-100k, 15.3% for AGIs over 100k)
Earned income credit: $1,767 (reported on 18.6% of returns)
Here:
$1,767
State:
$1,605
Percentage of individuals using paid preparers for their 2004 taxes: 54.7%
Here:
55%
State:
53%
(% for various income ranges: 48.1% for AGIs below $10k, 57.0% for AGIs $10k-25k, 54.5% for AGIs $25k-50k, 58.3% for AGIs $50k-75k, 51.2% for AGIs $75k-100k, 69.8% for AGIs over 100k)
Likely homosexual households (counted as self-reported same-sex unmarried-partner households)
Lesbian couples: 0.0% of all households
Gay men: 0.6% of all households
Household received Food Stamps/SNAP in the past 12 months: 1,220 Household did not receive Food Stamps/SNAP in the past 12 months: 6,042
Women who had a birth in the past 12 months: 183 (170 now married, 13 unmarried) Women who did not have a birth in the past 12 months: 4,083 (1,695 now married, 2,386 unmarried)
Housing units in zip code 97216 with a mortgage: 3,179 (279 second mortgage, 5 home equity loan, 220 both second mortgage and home equity loan) Houses without a mortgage: 73
Median monthly owner costs for units with a mortgage: $1,906 Median monthly owner costs for units without a mortgage: $672
Residents with income below the poverty level in 2022:
This zip code:
15.7%
Whole state:
12.1%
Residents with income below 50% of the poverty level in 2022:
This zip code:
11.1%
Whole state:
6.2%
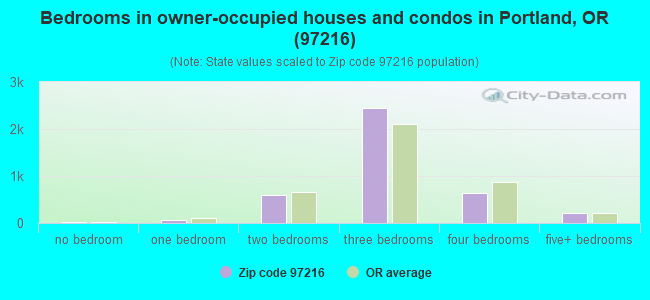
Median number of rooms in houses and condos:
Here:
5.7
State:
6.2
Median number of rooms in apartments:
Here:
3.5
State:
4.0
Notable locations in this zip code not listed on our city pages
Notable locations in zip code 97216: Midland Library (A), Talecris Plasma Resources (B), East Portland Community Center (C). Display/hide their locations on the map
Churches in zip code 97216 include: Cherry Park United Methodist Church (A), Chinese Free Methodist Church of Portland (B), Eastgate Bible Chapel (C), Montavilla Baptist Church (D), Mill Park Baptist Church (E), Hope of Portland Church (F), Seventh Day Adventist Churches of Sunnyside (G), Johrei Fellowship Church (H), Sunnyside Seventh Day Adventist Church (I). Display/hide their locations on the map
Parks in zip code 97216 include: Harrison City Park (1), Cherry City Park (2), Mill City Park (3), Midland City Park (4), Ventura City Park (5), Berrydale City Park (6), Cherry Blossom City Park (7), Floyd Light Property (8), Stark Street Island (9). Display/hide their locations on the map
2,032 married couples with children.
956 single-parent households (426 men, 530 women).
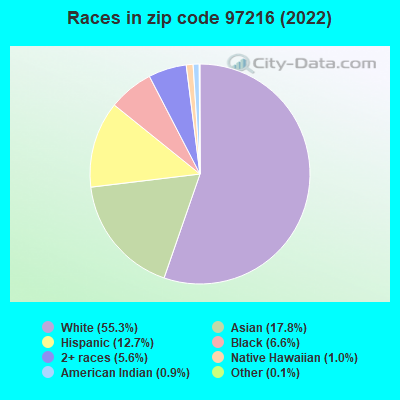
64.8% of residents of 97216 zip code speak English at home.
8.1% of residents speak Spanish at home (63% very well, 15% well, 15% not well, 7% not at all).
9.5% of residents speak other Indo-European language at home (31% very well, 24% well, 31% not well, 14% not at all).
15.9% of residents speak Asian or Pacific Island language at home (44% very well, 17% well, 29% not well, 9% not at all).
1.4% of residents speak other language at home (55% very well, 25% well, 21% not well).
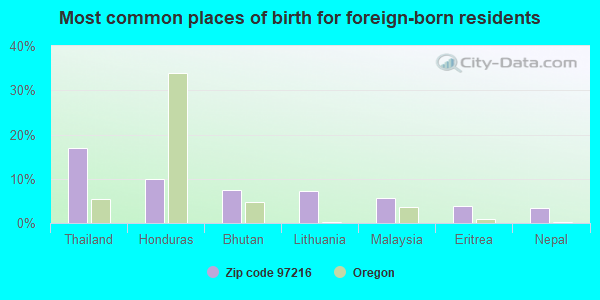
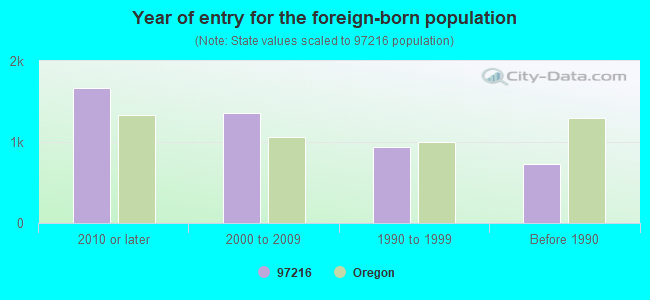
Foreign born population: 4,159 (23.8%) (49.3% of them are naturalized citizens)
Major facilities with environmental interests located in this zip code:
DAVID DOUGLAS SD 40 FLOYD LIGHT MIDDLE SCHOOL (10800 SE WASHINGTON STREET in PORTLAND, OR)
(Geographic Names Information System) (National Center for Education Statistics) - STATE ID-981 STATE MASTER (Oregon inspections and permits database) - HWMS-1221-, CESQG Conditionally Exempt Small Quantity Generators, less than 100 kg/month of hazardous waste (Resource Conservation and Recovery Act (tracking hazardous waste)) - notification Business SIC classification: ELEMENTARY AND SECONDARY SCHOOLS Organizations: MULTNOMAH CO SD AKA DAVID DOUGLAS SD 40 (CONTACT/ HAZARDOUS WASTE)
, DAVID DOUGLAS SCH DIST 40 (SCHOOL DISTRICT)
Alternative names: DAVID DOUGLAS SD 40 FLOYD LIGHT MID SCH
DAVID DOUGLAS SCHOOL DISTRICT 40 MILL PARK ELEMENTARY SCHOOL (1900 SOUTHEAST 117TH AVENUE in PORTLAND, OR)
(National Center for Education Statistics) - STATE ID-977 STATE MASTER (Oregon inspections and permits database) - OR-HWMS-1827, CESQG Conditionally Exempt Small Quantity Generators, less than 100 kg/month of hazardous waste (Resource Conservation and Recovery Act (tracking hazardous waste)) - notification Business SIC classification: ELEMENTARY AND SECONDARY SCHOOLS Organizations: DAVID DOUGLAS SD 40 (CONTACT/ HAZARDOUS WASTE)
, MULTNOMAH CO SD AKA DAVID DOUGLAS SD 40 (CONTACT/ HAZARDOUS WASTE)
, DAVID DOUGLAS SD 40 (HAZARDOUS WASTE SITE CONTACT)
, DAVID DOUGLAS SCH DIST 40 (SCHOOL DISTRICT)
Alternative names: DAVID DOUGLAS SD 40 MILL PARK ELEM SCH, MILL PARK SCHOOL D40
CHEVRON SS 90188 (527 SE 82ND AVE in PORTLAND, OR)
STATE MASTER (Oregon inspections and permits database) - OR-LUST-26-90-0179, LEAKING STORAGE TANK, OR-UST-BBCGJ, OR-UST-BBCHA, OR-UST-BBCHK, OR-HWMS-274, CESQG (Resource Conservation and Recovery Act (tracking hazardous waste)) Business SIC classification: PETROLEUM BULK STATIONS AND TERMINALS Business NAICS classification: HEATING OIL DEALERS.; LIQUEFIED PETROLEUM GAS (BOTTLED GAS) DEALERS. Organizations: CHEVRON PRODUCTS CO (CONTACT/ HAZARDOUS WASTE)
, CHEVRON PRODUCTS INC. (CONTACT/GENERAL)
, CHEVRON USA (CONTACT/GENERAL)
, MONTAVILLA CHEVRON (CONTACT/OPERATOR)
, CHEVRON USA PRODUCTS COMPANY (CONTACT/OWNER)
, CHEVRON USA PRODUCTS COMPANY (HAZARDOUS WASTE LAND OWNER)
, MONTAVILLA CHEVRON (HAZARDOUS WASTE OPERATOR)
, CHEVRON USA PRODUCTS CO (HAZARDOUS WASTE SITE CONTACT)
ADVENTIST MEDICAL CENTER (10123 SE MARKET in PORTLAND, OR)
STATE MASTER (Oregon inspections and permits database) - OR-LUST-26-91-0262, LEAKING STORAGE TANK, OR-UST-BBDDG, OR-UST-BBDDH, OR-UST-BBDDJ, OR-UST-BBDEK, OR-HWMS-6612, CESQG Conditionally Exempt Small Quantity Generators, less than 100 kg/month of hazardous waste (Resource Conservation and Recovery Act (tracking hazardous waste)) - notification Business SIC classification: GENERAL MEDICAL AND SURGICAL HOSPITALS Organizations: PORTLAND ADVENTIST MEDICAL CENTER (CONTACT/GENERAL)
, ADVENTIST MEDICAL CENTER ATTN: DIRECTOR (CONTACT/OWNER)
, ADVENTIST MEDICAL CENTER ATTN: DIRECTOR (HAZARDOUS WASTE LEGAL OWNER)
AUGUST WEST AND COMPANY (12011 SOUTHEAST ANKENY STREET in PORTLAND, OR)
STATE MASTER (Oregon inspections and permits database) - OR-HWMS-3097, CESQG (Resource Conservation and Recovery Act (tracking hazardous waste)) Business SIC classification: PAINTING AND PAPER HANGING Organizations: AUGUST WEST & CO (CONTACT/ HAZARDOUS WASTE)
, AUGUST WEST PAINTING INC (CONTACT/OWNER)
, AUGUST WEST & CO (HAZARDOUS WASTE OPERATOR)
, AUGUST WEST PAINTING INC (HAZARDOUS WASTE SITE CONTACT)
CITY OF PORTLAND VEHICLE SERVICE FACILITY (737 SE 106TH AVENUE in PORTLAND, OR)
STATE MASTER (Oregon inspections and permits database) - OR-HWMS-2614, CESQG Conditionally Exempt Small Quantity Generators, less than 100 kg/month of hazardous waste (Resource Conservation and Recovery Act (tracking hazardous waste)) - notification Business SIC classification: GENERAL AUTOMOTIVE REPAIR SHOPS Business NAICS classification: GENERAL AUTOMOTIVE REPAIR.; GENERAL AUTOMOTIVE REPAIR. Organizations: PORTLAND CITY OF VEHICLE SERVICES (CONTACT/ HAZARDOUS WASTE)
, KYLE NICKELS (CONTACT/OPERATOR)
, PORTLAND CITY OF EAST PRECINCT GARAGE (CONTACT/OWNER)
, PORTLAND, CITY OF FLEET SERVICES (HAZARDOUS WASTE LAND OWNER)
, PORTLAND, CITY OF (HAZARDOUS WASTE LAND OWNER)
, PORTLAND CITY OF EAST PRECINCT GARAGE (HAZARDOUS WASTE LEGAL OWNER)
, PORTLAND CITY OF VEHICLE SERVICES (HAZARDOUS WASTE SITE CONTACT)
Alternative names: PORTLAND CITY OF EAST PRECINCT GARAGE, PORTLAND CITY OF VEHICLE SVC 106TH AVE
DAVID DOUGLAS SD 40 CHERRY PARK ELEM (1930 SOUTHEAST 104TH AVENUE in PORTLAND, OR)
STATE MASTER (Oregon inspections and permits database) - OR-HWMS-6340, CESQG Conditionally Exempt Small Quantity Generators, less than 100 kg/month of hazardous waste (Resource Conservation and Recovery Act (tracking hazardous waste)) - notification Business SIC classification: ELEMENTARY AND SECONDARY SCHOOLS Organizations: MULTNOMAH CO SD AKA DAVID DOUGLAS SD 40 (CONTACT/ HAZARDOUS WASTE)
Alternative names: CHERRY PARK ELEM. SCHOOL, CHERRY PARK SCHOOL
AAA PRECIOUS METALS INC (9908 SE ASH ST in PORTLAND, OR)
STATE MASTER (Oregon inspections and permits database) - OR-HWMS-4550, CESQG Conditionally Exempt Small Quantity Generators, less than 100 kg/month of hazardous waste (Resource Conservation and Recovery Act (tracking hazardous waste)) - notification Business SIC classification: JEWELRY, PRECIOUS METAL Business NAICS classification: JEWELRY (EXCEPT COSTUME) MANUFACTURING.; JEWELRY (EXCEPT COSTUME) MANUFACTURING. Organizations: GENE APPLEGATE (HAZARDOUS WASTE LAND OWNER)
EASTGATE AUTO BODY INC (9141 SE STARK in PORTLAND, OR)
STATE MASTER (Oregon inspections and permits database) - OR-HWMS-1919, CESQG Conditionally Exempt Small Quantity Generators, less than 100 kg/month of hazardous waste (Resource Conservation and Recovery Act (tracking hazardous waste)) - notification Business SIC classification: TOP, BODY, AND UPHOLSTERY REPAIR SHOPS AND PAINT SHOPS Business NAICS classification: AUTOMOTIVE BODY, PAINT, AND INTERIOR REPAIR AND MAINTENANCE.; AUTOMOTIVE BODY, PAINT, AND INTERIOR REPAIR AND MAINTENANCE. Organizations: EASTGATE AUTO BODY, INC. (CONTACT/ HAZARDOUS WASTE)
, EAST PORTLAND AUTOBODY (CONTACT/ HAZARDOUS WASTE)
, WILLIAM DALLAS (CONTACT/OPERATOR)
, EASTGATE AUTO BODY, INC. (HAZARDOUS WASTE OPERATOR)
HEIL ELECTRIC CO (8425 SE STARK in PORTLAND, OR)
STATE MASTER (Oregon inspections and permits database) - OR-HWMS-2585, CESQG Conditionally Exempt Small Quantity Generators, less than 100 kg/month of hazardous waste (Resource Conservation and Recovery Act (tracking hazardous waste)) - notification Business SIC classification: ELECTRICAL WORK Organizations: HEIL ELECTRIC CO. (CONTACT/ HAZARDOUS WASTE)
, PS HEIL TRUST (HAZARDOUS WASTE LAND OWNER)
, HEIL ELECTRIC CO. (HAZARDOUS WASTE SITE CONTACT)
COAST YOU POUR IT CONCRETE (10005 EAST BURNSIDE STREET in PORTLAND, OR)
STATE MASTER (Oregon inspections and permits database) - OR-LUST-26-95-0331, LEAKING STORAGE TANK (Resource Conservation and Recovery Act (tracking hazardous waste)) Organizations: COAST U-POUR-IT (CONTACT/GENERAL)
, COAST U-POUR IT CONCRETE (CONTACT/OPERATOR)
, COAST SERVICES INC (CONTACT/OWNER)
Alternative names: COAST U-POUR-IT
GARRY SMALL SAAB (1940 SE 82ND AVE in PORTLAND, OR)
STATE MASTER (Oregon inspections and permits database) - OR-HWMS-4129, CESQG Conditionally Exempt Small Quantity Generators, less than 100 kg/month of hazardous waste (Resource Conservation and Recovery Act (tracking hazardous waste)) - notification Business SIC classification: AUTOMOBILES AND OTHER MOTOR VEHICLES; TOP, BODY, AND UPHOLSTERY REPAIR SHOPS AND PAINT SHOPS Business NAICS classification: AUTOMOTIVE BODY, PAINT, AND INTERIOR REPAIR AND MAINTENANCE.; AUTOMOTIVE BODY, PAINT, AND INTERIOR REPAIR AND MAINTENANCE.
CONOCOPHILLIPS 2705719 (10120 SE WASHINGTON ST in PORTLAND, OR)
STATE MASTER (Oregon inspections and permits database) - OR-HWMS-6749, CESQG Conditionally Exempt Small Quantity Generators, less than 100 kg/month of hazardous waste (Resource Conservation and Recovery Act (tracking hazardous waste)) Organizations: DELAL YAHYA (CONTACT/OPERATOR)
, CONOCOPHILLIPS COMPANY (CONTACT/OWNER)
Housing units lacking complete plumbing facilities: 0.8% Housing units lacking complete kitchen facilities: 0.8%
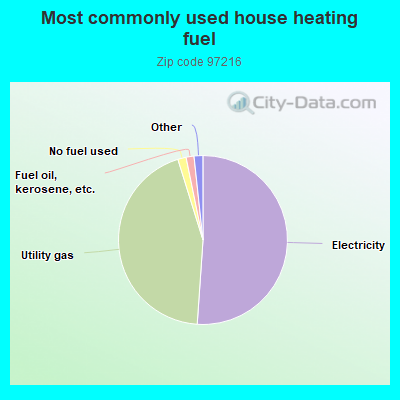
51.1%Electricity
44.1%Utility gas
1.6%No fuel used
1.5%Fuel oil, kerosene, etc.
0.8%Wood
0.8%Bottled, tank, or LP gas
Population in 1990: 11,436. Population change in the 1990s: +1,706 (+14.9%).
Place of birth for U.S.-born residents:
This state: 6,783
Northeast: 925
Midwest: 1,113
South: 753
West: 3,345
49% of the 97216 zip code residents lived in the same house 5 years ago. Out of people who lived in different houses, 63% lived in this county. Out of people who lived in different counties, 50% lived in Oregon.
89% of the 97216 zip code residents lived in the same house 1 year ago. Out of people who lived in different houses, 61% moved from this county. Out of people who lived in different houses, 20% moved from different county within same state. Out of people who lived in different houses, 17% moved from different state. Out of people who lived in different houses, 2% moved from abroad.
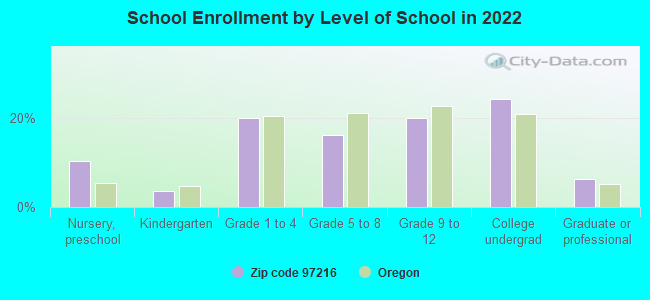
Private vs. public school enrollment:
Students in private schools in grades 1 to 8 (elementary and middle school): 84
Here:
7.0%
Oregon:
13.7%
Students in private schools in grades 9 to 12 (high school): 93
Here:
14.0%
Oregon:
8.8%
Students in private undergraduate colleges: 146
Here:
17.9%
Oregon:
17.7%
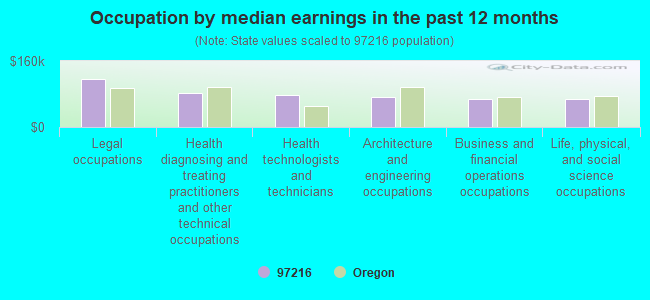
Occupation by median earnings in the past 12 months ($)
117,093Legal occupations
83,163Health diagnosing and treating practitioners and other technical occupations
78,385Health technologists and technicians
72,979Architecture and engineering occupations
68,923Business and financial operations occupations
67,377Life, physical, and social science occupations
Top industries in this zip code by the number of employees in 2005:
Health Care and Social Assistance: General Medical and Surgical Hospitals (over 1000 employees: 1 establishment)
2002 - 2018 National Fire Incident Reporting System (NFIRS) incidents
According to the data from the years 2002 - 2018 the average number of fire incidents per year is 47. The highest number of reported fires - 68 took place in 2003, and the least - 11 in 2017. The data has a declining trend.
When looking into fire subcategories, the most reports belonged to: Outside Fires (52.1%), and Structure Fires (28.7%).
Fire incident types reported to NFIRS in Zip Code 97216


 Nearest zip codes: 97266, 97220, 97215, 97213, 97206, 97233.
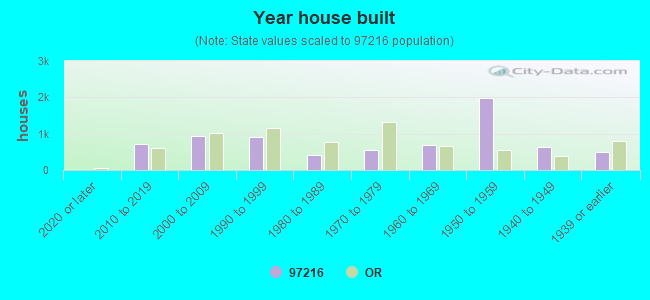


 According to the data from the years 2002 - 2018 the average number of fire incidents per year is 47. The highest number of reported fires - 68 took place in 2003, and the least - 11 in 2017. The data has a declining trend.
 When looking into fire subcategories, the most reports belonged to: Outside Fires (52.1%), and Structure Fires (28.7%).