Estimated zip code population in 2022: 28,038 Zip code population in 2010: 24,331 Zip code population in 2000: 22,940
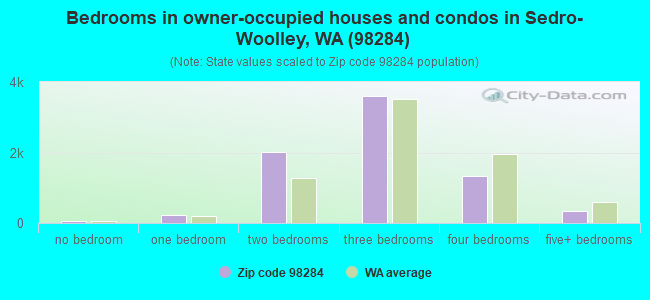
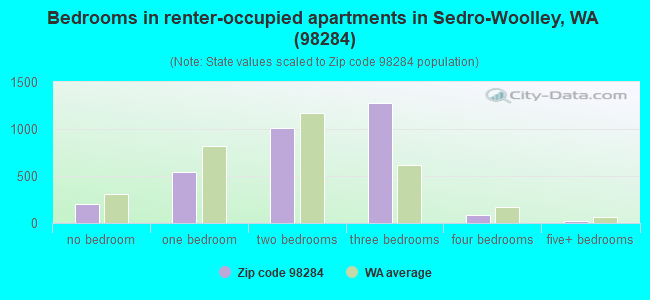
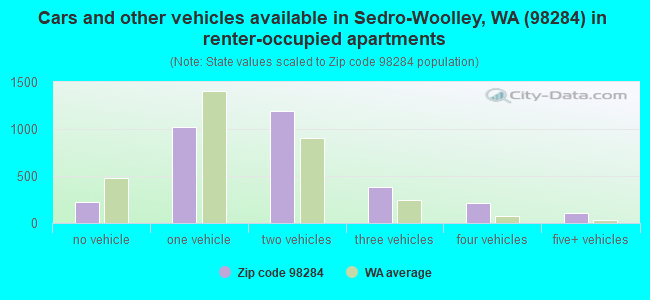
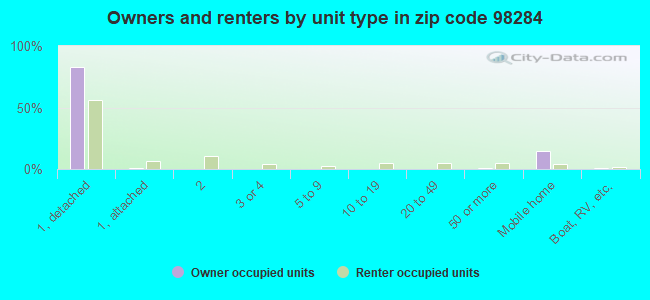
Houses and condos: 11,387 Renter-occupied apartments: 3,192
% of renters here:
30%
State:
36%
March 2022 cost of living index in zip code 98284: 101.3 (near average, U.S. average is 100)
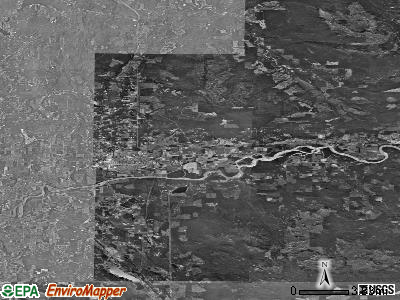
Land area: 282.6 sq. mi. Water area: 6.9 sq. mi.
Population density: 99 people per square mile
(very low).
OSM Map
General Map
Google Map
MSN Map
OSM Map
General Map
Google Map
MSN Map
OSM Map
General Map
Google Map
MSN Map
OSM Map
General Map
Google Map
MSN Map
Please wait while loading the map...
Real estate property taxes paid for housing units in 2022:
This zip code:
0.7% ($3,067)
Washington:
0.8% ($4,283)
Median real estate property taxes paid for housing units with mortgages in 2022: $3,209 (0.6%) Median real estate property taxes paid for housing units with no mortgage in 2022: $2,645 (0.7%)
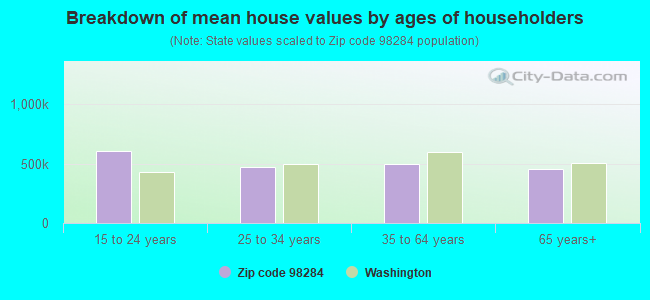
Estimated median house/condo value in 2022: $465,561
98284:
$465,561
Washington:
$569,500
According to our research of Washington and other state lists, there were 27 registered sex offenders living in 98284 zip code as of April 26, 2024. The ratio of all residents to sex offenders in zip code 98284 is 975 to 1. The ratio of registered sex offenders to all residents in this zip code is near the state average.
Median resident age:
This zip code:
39.1 years
Washington median age:
38.4 years
Average household size:
This zip code:
2.5 people
Washington:
2.5 people
Averages for the 2020 tax year for zip code 98284, filed in 2021:
Average Adjusted Gross Income (AGI) in 2020: $65,419 (Individual Income Tax Returns)
Here:
$65,419
State:
$99,264
Salary/wage: $55,256 (reported on 82.9% of returns)
Here:
$55,256
State:
$80,347
(% of AGI for various income ranges: 1140.6% for AGIs below $25k, 3468.3% for AGIs $25k-50k, 6290.2% for AGIs $50k-75k, 8988.0% for AGIs $75k-100k, 16836.1% for AGIs $100k-200k, 56048.0% for AGIs over 200k)
Taxable interest for individuals: $1,329 (reported on 27.3% of returns)
This zip code:
$1,329
Washington:
$2,077
(% of AGI for various income ranges: 20.0% for AGIs below $25k, 19.5% for AGIs $25k-50k, 30.8% for AGIs $50k-75k, 51.1% for AGIs $75k-100k, 82.5% for AGIs $100k-200k, 1528.0% for AGIs over 200k)
Ordinary dividends: $5,820 (reported on 14.2% of returns)
Here:
$5,820
State:
$10,013
(% of AGI for various income ranges: 28.1% for AGIs below $25k, 30.0% for AGIs $25k-50k, 47.6% for AGIs $50k-75k, 91.1% for AGIs $75k-100k, 133.2% for AGIs $100k-200k, 5585.0% for AGIs over 200k)
Net capital gain/loss in AGI: +$21,648 (reported on 13.2% of returns)
Here:
+$21,648
State:
+$40,092
(% of AGI for various income ranges: 14.4% for AGIs below $25k, 20.3% for AGIs $25k-50k, 71.6% for AGIs $50k-75k, 99.4% for AGIs $75k-100k, 504.0% for AGIs $100k-200k, 26871.0% for AGIs over 200k)
Profit/loss from business: +$13,403 (reported on 10.8% of returns)
Here:
+$13,403
State:
+$18,312
(% of AGI for various income ranges: 94.4% for AGIs below $25k, 91.2% for AGIs $25k-50k, 191.6% for AGIs $50k-75k, 214.4% for AGIs $75k-100k, 421.2% for AGIs $100k-200k, 3039.0% for AGIs over 200k)
Taxable individual retirement arrangement distribution: $18,632 (reported on 7.5% of returns)
98284:
$18,632
Washington:
$24,221
(% of AGI for various income ranges: 56.6% for AGIs below $25k, 75.2% for AGIs $25k-50k, 134.1% for AGIs $50k-75k, 276.2% for AGIs $75k-100k, 474.1% for AGIs $100k-200k, 3322.0% for AGIs over 200k)
Total itemized deductions: $33,390 (reported on 6.4% of returns)
Here:
$33,390
State:
$39,068
(% of AGI for various income ranges: 55.4% for AGIs below $25k, 92.4% for AGIs $25k-50k, 218.8% for AGIs $50k-75k, 342.0% for AGIs $75k-100k, 640.3% for AGIs $100k-200k, 8352.0% for AGIs over 200k)
Charity contributions: $9,148 (reported on 4.0% of returns)
Here:
$9,148
State:
$15,331
(% of AGI for various income ranges: 2.7% for AGIs below $25k, 8.6% for AGIs $25k-50k, 23.6% for AGIs $50k-75k, 44.9% for AGIs $75k-100k, 115.6% for AGIs $100k-200k, 2041.0% for AGIs over 200k)
Taxes paid: $6,005 (reported on 6.4% of returns)
98284:
$6,005
State:
$7,774
(% of AGI for various income ranges: 9.1% for AGIs below $25k, 16.8% for AGIs $25k-50k, 45.2% for AGIs $50k-75k, 71.0% for AGIs $75k-100k, 144.9% for AGIs $100k-200k, 972.0% for AGIs over 200k)
Earned income credit: $2,010 (reported on 12.4% of returns)
Here:
$2,010
State:
$2,020
(% of AGI for various income ranges: 70.8% for AGIs below $25k, 51.8% for AGIs $25k-50k, 1.1% for AGIs $50k-75k)
Percentage of individuals using paid preparers for their 2020 taxes: 93.5%
Here:
93%
State:
93%
(% for various income ranges: 91.7% for AGIs below $25k, 93.9% for AGIs $25k-50k, 94.1% for AGIs $50k-75k, 93.9% for AGIs $75k-100k, 94.8% for AGIs $100k-200k, 94.1% for AGIs over 200k)
Averages for the 2012 tax year for zip code 98284, filed in 2013:
Average Adjusted Gross Income (AGI) in 2012: $49,003 (Individual Income Tax Returns)
Here:
$49,003
State:
$69,533
Salary/wage: $43,484 (reported on 84.7% of returns)
Here:
$43,484
State:
$57,267
(% of AGI for various income ranges: 73.9% for AGIs below $25k, 79.4% for AGIs $25k-50k, 79.0% for AGIs $50k-75k, 80.3% for AGIs $75k-100k, 79.9% for AGIs $100k-200k, 30.9% for AGIs over 200k)
Taxable interest for individuals: $1,531 (reported on 30.1% of returns)
This zip code:
$1,531
Washington:
$1,816
(% of AGI for various income ranges: 1.2% for AGIs below $25k, 0.7% for AGIs $25k-50k, 0.7% for AGIs $50k-75k, 0.4% for AGIs $75k-100k, 0.9% for AGIs $100k-200k, 2.9% for AGIs over 200k)
Ordinary dividends: $4,191 (reported on 14.4% of returns)
Here:
$4,191
State:
$8,163
(% of AGI for various income ranges: 1.4% for AGIs below $25k, 0.7% for AGIs $25k-50k, 0.9% for AGIs $50k-75k, 0.8% for AGIs $75k-100k, 0.8% for AGIs $100k-200k, 5.2% for AGIs over 200k)
Net capital gain/loss in AGI: +$6,583 (reported on 11.7% of returns)
Here:
+$6,583
State:
+$21,568
(% of AGI for various income ranges: 0.1% for AGIs $25k-50k, 0.5% for AGIs $50k-75k, 0.7% for AGIs $75k-100k, 1.1% for AGIs $100k-200k, 13.1% for AGIs over 200k)
Profit/loss from business: +$11,463 (reported on 10.9% of returns)
Here:
+$11,463
State:
+$16,521
(% of AGI for various income ranges: 4.5% for AGIs below $25k, 2.8% for AGIs $25k-50k, 1.4% for AGIs $50k-75k, 2.1% for AGIs $75k-100k, 2.6% for AGIs $100k-200k, 3.6% for AGIs over 200k)
Taxable individual retirement arrangement distribution: $12,882 (reported on 8.3% of returns)
98284:
$12,882
Washington:
$18,648
(% of AGI for various income ranges: 2.2% for AGIs below $25k, 1.9% for AGIs $25k-50k, 2.3% for AGIs $50k-75k, 2.3% for AGIs $75k-100k, 3.0% for AGIs $100k-200k)
Self-employment retirement plans: $18,600 (reported on 0.2% of returns)
98284:
$18,600
Washington:
$20,087
Total itemized deductions: $18,853 (23% of AGI, reported on 28.9% of returns)
Here:
$18,853
State:
$23,872
Here:
22.8% of AGI
State:
18.2% of AGI
(% of AGI for various income ranges: 8.3% for AGIs below $25k, 9.9% for AGIs $25k-50k, 11.2% for AGIs $50k-75k, 13.0% for AGIs $75k-100k, 12.5% for AGIs $100k-200k, 9.2% for AGIs over 200k)
Charity contributions: $2,954 (reported on 19.8% of returns)
Here:
$2,954
State:
$4,465
(% of AGI for various income ranges: 0.4% for AGIs below $25k, 0.8% for AGIs $25k-50k, 1.0% for AGIs $50k-75k, 1.1% for AGIs $75k-100k, 1.5% for AGIs $100k-200k, 2.9% for AGIs over 200k)
Taxes paid: $4,310 (reported on 28.5% of returns)
98284:
$4,310
State:
$6,400
(% of AGI for various income ranges: 1.6% for AGIs below $25k, 2.1% for AGIs $25k-50k, 2.4% for AGIs $50k-75k, 2.9% for AGIs $75k-100k, 3.1% for AGIs $100k-200k, 2.3% for AGIs over 200k)
Earned income credit: $2,135 (reported on 17.1% of returns)
Here:
$2,135
State:
$2,073
(% of AGI for various income ranges: 5.5% for AGIs below $25k, 1.1% for AGIs $25k-50k)
Percentage of individuals using paid preparers for their 2012 taxes: 46.0%
Here:
46%
State:
43%
(% for various income ranges: 41.0% for AGIs below $25k, 46.5% for AGIs $25k-50k, 47.7% for AGIs $50k-75k, 50.9% for AGIs $75k-100k, 52.6% for AGIs $100k-200k, 77.8% for AGIs over 200k)
Averages for the 2004 tax year for zip code 98284, filed in 2005:
Average Adjusted Gross Income (AGI) in 2004: $39,342 (Individual Income Tax Returns)
Here:
$39,342
State:
$54,331
Salary/wage: $35,205 (reported on 86.6% of returns)
Here:
$35,205
State:
$45,761
(% of AGI for various income ranges: 131.7% for AGIs below $10k, 75.8% for AGIs $10k-25k, 82.5% for AGIs $25k-50k, 83.8% for AGIs $50k-75k, 83.2% for AGIs $75k-100k, 54.9% for AGIs over 100k)
Taxable interest for individuals: $1,722 (reported on 38.5% of returns)
This zip code:
$1,722
Washington:
$2,110
(% of AGI for various income ranges: 5.4% for AGIs below $10k, 2.4% for AGIs $10k-25k, 1.0% for AGIs $25k-50k, 0.9% for AGIs $50k-75k, 1.0% for AGIs $75k-100k, 3.3% for AGIs over 100k)
Taxable dividends: $2,943 (reported on 18.0% of returns)
Here:
$2,943
State:
$5,879
(% of AGI for various income ranges: 3.4% for AGIs below $10k, 1.1% for AGIs $10k-25k, 0.8% for AGIs $25k-50k, 0.9% for AGIs $50k-75k, 0.8% for AGIs $75k-100k, 3.0% for AGIs over 100k)
Net capital gain/loss: +$8,503 (reported on 15.1% of returns)
Here:
+$8,503
State:
+$15,835
(% of AGI for various income ranges: -1.0% for AGIs below $10k, 0.1% for AGIs $10k-25k, 0.4% for AGIs $25k-50k, 1.1% for AGIs $50k-75k, 1.4% for AGIs $75k-100k, 13.2% for AGIs over 100k)
Profit/loss from business: +$9,047 (reported on 12.6% of returns)
Here:
+$9,047
State:
+$13,994
(% of AGI for various income ranges: -3.2% for AGIs below $10k, 4.6% for AGIs $10k-25k, 2.6% for AGIs $25k-50k, 2.3% for AGIs $50k-75k, 2.7% for AGIs $75k-100k, 3.8% for AGIs over 100k)
IRA payment deduction: $2,788 (reported on 2.5% of returns)
98284:
$2,788
Washington:
$3,001
(% of AGI for various income ranges: 0.2% for AGIs $10k-25k, 0.2% for AGIs $25k-50k, 0.1% for AGIs $50k-75k, 0.2% for AGIs $75k-100k, 0.1% for AGIs over 100k)
Self-employed pension: $9,784 (reported on 0.4% of returns)
Here:
$9,784
Washington:
$14,244
Total itemized deductions: $15,758 (24% of AGI, reported on 31.8% of returns)
Here:
$15,758
State:
$19,669
Here:
24.4% of AGI
State:
20.7% of AGI
(% of AGI for various income ranges: 13.8% for AGIs below $10k, 8.9% for AGIs $10k-25k, 12.4% for AGIs $25k-50k, 14.2% for AGIs $50k-75k, 14.9% for AGIs $75k-100k, 11.7% for AGIs over 100k)
Charity contributions deductions: $2,310 (3% of AGI, reported on 25.0% of returns)
Here:
$2,310
State:
$3,569
Here:
3.4% of AGI
State:
3.5% of AGI
(% of AGI for various income ranges: 0.7% for AGIs below $10k, 0.7% for AGIs $10k-25k, 1.0% for AGIs $25k-50k, 1.2% for AGIs $50k-75k, 1.4% for AGIs $75k-100k, 2.9% for AGIs over 100k)
Total tax: $4,964 (reported on 74.1% of returns)
98284:
$4,964
State:
$9,065
(% of AGI for various income ranges: 3.0% for AGIs below $10k, 3.9% for AGIs $10k-25k, 6.5% for AGIs $25k-50k, 8.3% for AGIs $50k-75k, 10.5% for AGIs $75k-100k, 17.0% for AGIs over 100k)
Earned income credit: $1,636 (reported on 16.3% of returns)
Here:
$1,636
State:
$1,607
Percentage of individuals using paid preparers for their 2004 taxes: 53.5%
Here:
53%
State:
49%
(% for various income ranges: 44.7% for AGIs below $10k, 53.1% for AGIs $10k-25k, 54.0% for AGIs $25k-50k, 56.3% for AGIs $50k-75k, 58.6% for AGIs $75k-100k, 68.8% for AGIs over 100k)
Likely homosexual households (counted as self-reported same-sex unmarried-partner households)
Lesbian couples: 0.1% of all households
Gay men: 0.0% of all households
Household received Food Stamps/SNAP in the past 12 months: 1,287 Household did not receive Food Stamps/SNAP in the past 12 months: 9,478
Women who had a birth in the past 12 months: 416 (254 now married, 152 unmarried) Women who did not have a birth in the past 12 months: 6,147 (2,917 now married, 3,224 unmarried)
Housing units in zip code 98284 with a mortgage: 5,179 (288 second mortgage, 229 both second mortgage and home equity loan) Houses without a mortgage: 11
Median monthly owner costs for units with a mortgage: $1,972 Median monthly owner costs for units without a mortgage: $577
Residents with income below the poverty level in 2022:
This zip code:
11.8%
Whole state:
10.0%
Residents with income below 50% of the poverty level in 2022:
This zip code:
4.8%
Whole state:
4.6%
Median number of rooms in houses and condos:
Here:
5.9
State:
6.5
Median number of rooms in apartments:
Here:
4.1
State:
3.9
Notable locations in this zip code not listed on our city pages
Notable locations in zip code 98284: Mirror Lake Siding (A), Camp Eighteen (B), Lyman Ferry (C), Hickson Community Hall (D), Skagit Water Treatment Plant (E), Sedro - Woolley South Park and Ride (F), Park (G), Riverfront Recreational Vehicle Park (H), Sauk Mountain View Golf Course (I), Skitopa Grange (J), Sedro - Woolley Sewage Treatment Plant (K), Dyes Ranch (L), Haagsma Dairy (M), Sundstrom Dairy (N), Mulder Dairy (O), Branshel Farm (P), Mount Josephine Lookout (Q), Hemlock Highlands (R), Hamilton Fire Department (S), Skagit County Fire District 4 Clear Lake Fire Department (T). Display/hide their locations on the map
Churches in zip code 98284 include: Bethlehem Lutheran Church (A), Northern Peaks Christian Fellowship Church (B), Saint James Episcopal Church (C), Valley Baptist Church (D), Bethel Assembly of God Church (E), Cascade Christian Church (F), Central United Methodist Church (G), Day Creek Chapel (H), First Baptist Church (I). Display/hide their locations on the map
Lakes and reservoirs: Minkler Lake (A), Cranberry Lake (B), Palmer Lake (C), Bottomless Lake (D), Cain Lake (E), Clear Lake (F), Josephine Lakes (G), Heart Lake (H). Display/hide their locations on the map
Streams, rivers, and creeks: Campbell Creek (A), Carry Creek (B), Cavanaugh Creek (C), Childs Creek (D), Cumberland Creek (E), Day Creek (F), Deer Creek (G), Jims Slough (H), Fall Creek (I). Display/hide their locations on the map
3,629 married couples with children.
1,513 single-parent households (913 men, 600 women).
86.2% of residents of 98284 zip code speak English at home.
11.2% of residents speak Spanish at home (66% very well, 15% well, 12% not well, 6% not at all).
1.4% of residents speak other Indo-European language at home (91% very well, 2% well, 5% not well, 2% not at all).
0.7% of residents speak Asian or Pacific Island language at home (28% very well, 46% well, 18% not well, 8% not at all).
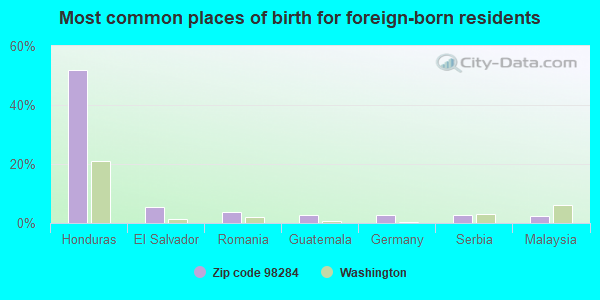
Foreign born population: 1,610 (5.7%) (44.2% of them are naturalized citizens)
This zip code:
5.7%
Whole state:
15.3%
52%Honduras
6%El Salvador
4%Romania
3%Guatemala
3%Germany
3%Serbia
2%Malaysia
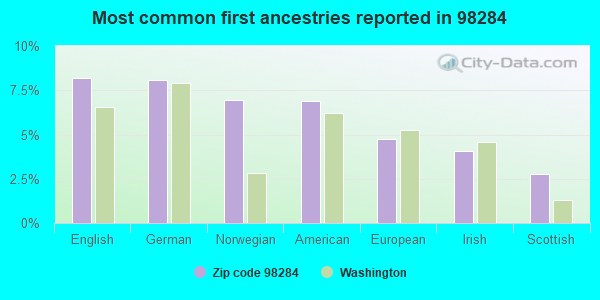
8%English
8%German
7%Norwegian
7%American
5%European
4%Irish
3%Scottish
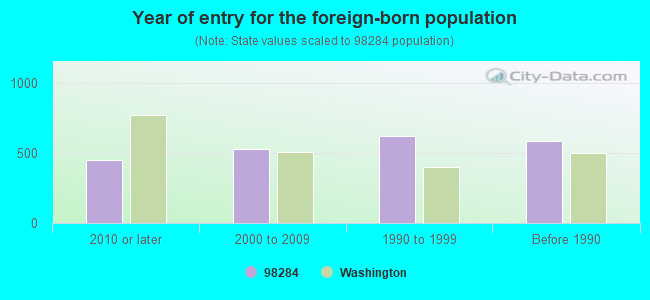
Year of entry for the foreign-born population
4492010 or later
5262000 to 2009
6201990 to 1999
587Before 1990
Facilities with environmental interests located in this zip code:
CASCADE MIDDLE SCHOOL SEDRO WOOLLEY (201 N TOWNSHIP ST in SEDRO WOOLLEY, WA)
(Geographic Names Information System) (National Center for Education Statistics) - STATE ID-3181 (Resource Conservation and Recovery Act (tracking hazardous waste)) STATE MASTER (Washington State Department of Ecology's Facility/Site identification system) - HAZWASTE-WA0000569087, HAZARDOUS WASTE PROGRAM Business SIC classification: SCHOOLS AND EDUCATIONAL SERVICES Organizations: SEDRO WOOLLEY SCHOOL DIST101 (CONTACT/OPERATOR)
, SEDRO-WOOLLEY SCH DIST 101 (SCHOOL DISTRICT)
CHEVRON USA INC SS 97502 (124 FERRY in SEDRO WOOLLEY, WA)
(Resource Conservation and Recovery Act (tracking hazardous waste)) STATE MASTER (Washington State Department of Ecology's Facility/Site identification system) - TOXICS-NW0480, VOLUNTARY CLEAN UP PROGRAM, TOXICS-5236, LEAKING STORAGE TANK, UNDERGROUND STORAGE TANK PROGRAM, TOXICS-NW1452, VOLUNTARY CLEAN UP PROGRAM Business SIC classification: NONCLASSIFIABLE ESTABLISHMENTS Organizations: CHEVRON PRODUCTS CO (CONTACT/ HAZARDOUS WASTE)
, CHEVRON PRODUCTS COMPANY (CONTACT/OPERATOR)
Alternative names: CHEVRON LOT TOWN SQUARE PARK
ARTS AUTO WRECKING (23536 RIVER RD in SEDRO WOOLLEY, WA)
National Pollutant Discharge Elimination System NON-MAJOR (Tracking pollutant discharge elimination systems) - permit STATE MASTER (Washington State Department of Ecology's Facility/Site identification system) - TOXICS-NW0717, VOLUNTARY CLEAN UP PROGRAM, TOXICS-, GROUND WATER PROGRAM, WATQUAL-SO3000602, NPDES STORMWATER PERMIT Business SIC classification: MOTOR VEHICLE PARTS, USED
ASSOCIATED PETROLEUM PRODUCTS (700 BORSETH in SEDRO WOOLLEY, WA)
(Resource Conservation and Recovery Act (tracking hazardous waste)) STATE MASTER (Washington State Department of Ecology's Facility/Site identification system) - TOXICS-, GROUND WATER PROGRAM, HAZWASTE-WAD011810066, HAZARDOUS WASTE PROGRAM, WATQUAL-SO3000702, NPDES STORMWATER PERMIT, HAZWASTE-WAD011810066, EPCRA Business SIC classification: PRODUCTS OF PETROLEUM AND COAL; PETROLEUM BULK STATIONS AND TERMINALS; PETROLEUM AND PETROLEUM PRODUCTS WHOLESALERS, EXCEPT BULK STATIONS AND TERMINALS Business NAICS classification: ALL OTHER PETROLEUM AND COAL PRODUCTS MANUFACTURING.; ALL OTHER PETROLEUM AND COAL PRODUCTS MANUFACTURING. Organizations: BRAD ROBERSON (CONTACT/OPERATOR)
, RAINIER PETROLEUM CORP (CONTACT/OWNER)
Alternative names: SEDRO WOOLLEY HOLDING CORPORATION, SKAGIT PETROLEUM
CM TRUCKING CONSTRUCTION IN (2062 F & S GRADE RD in SEDRO WOOLLEY, WA)
(Resource Conservation and Recovery Act (tracking hazardous waste)) STATE MASTER (Washington State Department of Ecology's Facility/Site identification system) - HAZWASTE-WAD148097900, HAZARDOUS WASTE PROGRAM Business SIC classification: TRUCK TRAILERS Business NAICS classification: TRUCK TRAILER MANUFACTURING. Organizations: CARRI LARSON (CONTACT/OPERATOR)
CONCRETE NORWEST SEDRO WOOLLEY (3 1/2 MILES NW OF SEDRO WOOLLEY in SEDRO WOOLLEY, WA)
National Pollutant Discharge Elimination System NON-MAJOR (Tracking pollutant discharge elimination systems) - permit STATE MASTER (Washington State Department of Ecology's Facility/Site identification system) - WATQUAL-WAG503064, National Pollutant Discharge Elimination System Permit Business SIC classification: CONSTRUCTION SAND AND GRAVEL Organizations: CONCRETE NOR'WEST (CONTACT/OPERATOR)
Alternative names: CONCRETE NORTHWEST, CONCRETE NOR'WEST, SKAGIT READY MIX
ARCO 5581 PSI 5534 (830 MOORE ST in SEDRO WOOLLEY, WA)
Small Quantity Generators, between 100 kg and 1000 kg of hazardous waste/month (Resource Conservation and Recovery Act (tracking hazardous waste)) STATE MASTER (Washington State Department of Ecology's Facility/Site identification system) - TOXICS-99027, LEAKING STORAGE TANK, UNDERGROUND STORAGE TANK PROGRAM, HAZWASTE-WAD988517199, EPCRA, SQG Business SIC classification: GASOLINE SERVICE STATIONS Organizations: BP WEST COAST PRODUCTS LLC (CONTACT/OPERATOR)
Alternative names: ARCO 05581
CENTRAL ELEMENTARY SCHOOL (601 TALCOTT ST in SEDRO-WOOLLEY, WA)
(National Center for Education Statistics) - STATE ID-2380 Organizations: SEDRO-WOOLLEY SCH DIST 101 (SCHOOL DISTRICT)
CASCADES JOB CORPS CENTER (7782 NORTHERN STATE RD in SEDRO WOOLLEY, WA)
(Resource Conservation and Recovery Act (tracking hazardous waste)) Business NAICS classification: APPRENTICESHIP TRAINING. Organizations: CASCADE JOB CORPS CENTER (CONTACT/OPERATOR)
, MANAGEMENT & TRAINING CORP (CONTACT/OWNER)
Housing units lacking complete plumbing facilities: 1.2% Housing units lacking complete kitchen facilities: 1.9%
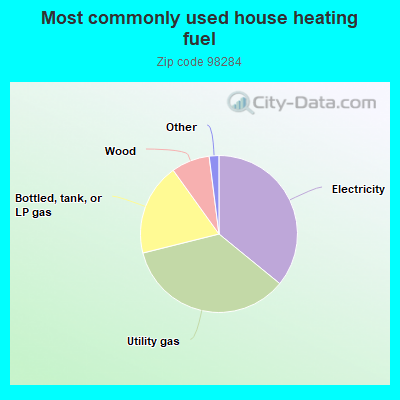
35.9%Electricity
35.2%Utility gas
19.0%Bottled, tank, or LP gas
7.9%Wood
0.8%Fuel oil, kerosene, etc.
0.8%Other fuel
Population in 1990: 14,902. Population change in the 1990s: +8,038 (+53.9%).
Place of birth for U.S.-born residents:
This state: 17,000
Northeast: 532
Midwest: 1,658
South: 1,272
West: 5,235
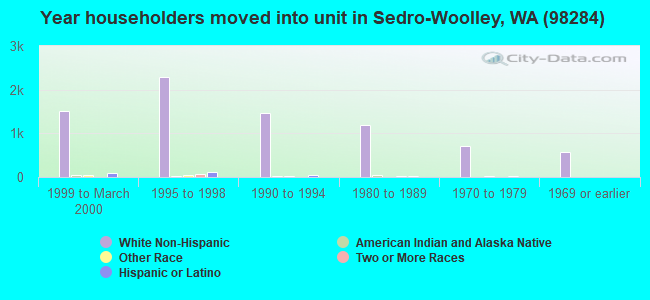
49% of the 98284 zip code residents lived in the same house 5 years ago. Out of people who lived in different houses, 60% lived in this county. Out of people who lived in different counties, 50% lived in Washington.
87% of the 98284 zip code residents lived in the same house 1 year ago. Out of people who lived in different houses, 56% moved from this county. Out of people who lived in different houses, 30% moved from different county within same state. Out of people who lived in different houses, 13% moved from different state.
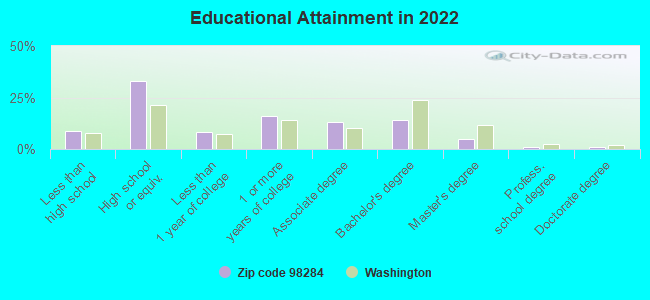
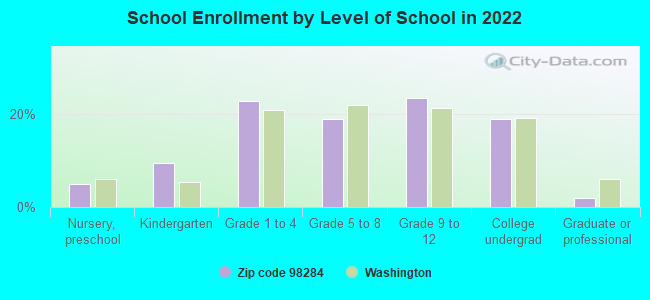
Private vs. public school enrollment:
Students in private schools in grades 1 to 8 (elementary and middle school): 317
Here:
14.0%
Washington:
12.4%
Students in private schools in grades 9 to 12 (high school): 57
Here:
4.5%
Washington:
9.2%
Students in private undergraduate colleges: 198
Here:
19.4%
Washington:
16.5%
Occupation by median earnings in the past 12 months ($)
92,884Life, physical, and social science occupations
86,601Architecture and engineering occupations
74,042Computer and mathematical occupations
69,981Installation, maintenance, and repair occupations
69,851Health diagnosing and treating practitioners and other technical occupations
63,218Law enforcement workers including supervisors
Companies with federal contracts located in this zip code:
ONE WAY CONSTRUCTION INC (215 N REED STREET in SEDRO WOOLLEY, WA; small business) : $10,921,268 in 32 contractsfrom 1999 to 2004
Contracts for Construction of Structures and Facilities -- Highways, Roads, Streets, Bridges, and Railways (includes resurfacing), Maintenance, Repair or Alteration of Real Property -- Highways, Roads, Streets, Bridges, and Railways (includes resurfacing), Miscellaneous Construction Equipment, Construction of Structures and Facilities -- Restoration of real property by Federal Highway Administration, Forest Service, Forest Service (disused code: now 12C2), U.S. Army Corps of Engineers - civil program financing only, and others Signed by year:2000: $5,809,362; 2001: $329,000; 2002: $4,066,000; 2003: $759,559; 2004: -$3,210; 2005: $0; 2006: $0.
Biggest contracts:
$4,060,000 with Federal Highway Administration for Construction of Structures and Facilities -- Highways, Roads, Streets, Bridges, and Railways (includes resurfacing). Signed on 2002-01-15. Completion date: 2004-12-15.
$2,125,096 with Forest Service for Maintenance, Repair or Alteration of Real Property -- Highways, Roads, Streets, Bridges, and Railways (includes resurfacing). Signed on 2000-08-15. Completion date: 2000-09-15.
$2,125,096, same as above.Signed on 2000-08-15. Completion date: 2000-09-15.
$1,512,000 with Forest Service (disused code: now 12C2) for Construction of Structures and Facilities -- Highways, Roads, Streets, Bridges, and Railways (includes resurfacing). Signed on 2000-09-15. Completion date: 2002-11-15.
ROTHENBUHLER ENGINEERING CO IN (524 RHODES RD in SEDRO WOOLLEY, WA; small business) : $9,032,319 in 38 contractsfrom 2000 to 2006
Contracts for Miscellaneous Communication Equipment, Cable, Cord, and Wire Assemblies: Communications Equipment, Underwater Mine Explosive Components, Miscellaneous Weapons, and moreby Navy, Transportation Security Administration, Bureau of Alcohol, Tobacco, Firearms and Explosives Signed by year:2000: $128,859; 2001: $1,278,575; 2002: $2,671,870; 2003: $193,850; 2004: $1,067,601; 2005: $3,400,724; 2006: $290,840.
Biggest contracts:
$1,629,600 with Navy for Miscellaneous Communication Equipment. Signed on 2002-08-07. Completion date: 2003-12-31.
$1,092,000 with Navy for Cable, Cord, and Wire Assemblies: Communications Equipment. Signed on 2005-09-28. Completion date: 2008-08-04.
$960,000 with Navy for Miscellaneous Communication Equipment. Signed on 2001-08-07. Completion date: 2001-12-05.
$924,000, same as above.Signed on 2002-08-13. Completion date: 2003-12-31.
SKAGIT PACIFIC CORPORATION (500 METCALF STREET, BLDG in SEDRO WOOLLEY, WA; small business) : $422,320 in 4 contractsfrom 2001 to 2003
$188,000 with Forest Service (disused code: now 12C2) for Purchase of Structures and Facilities -- Other Residential Buildings. Signed on 2001-06-15. Completion date: 2001-09-15.
$181,500 with Navy for Prefabricated and Portable Buildings. Signed on 2001-02-09. Completion date: 2001-04-04.
$50,820 with Navy for Scaffolding Equipment and Concrete Forms. Signed on 2003-04-04. Completion date: 2003-05-09.
$2,000 with Forest Service (disused code: now 12C2) for Purchase of Structures and Facilities -- Other Residential Buildings. Signed on 2001-06-15. Completion date: 2001-09-15.
JAMES R HERRIN (605 SUNSET PARK DRIVE, SUI in SEDRO WOOLLEY, WA) : $84,000 in 4 contractsfrom 2003 to 2005
$30,000 with Army for Liquid and Gas Flow, Liquid Level, and Mechanical Motion Measuring Instruments. Taking place in NC. Signed on 2003-12-18. Completion date: 2004-01-30.
$30,000 with U.S. Army Corps of Engineers - civil program financing only for Liquid and Gas Flow, Liquid Level, and Mechanical Motion Measuring Instruments. Taking place in NC. Signed on 2003-12-18. Completion date: 2004-01-30.
$12,000 with Army for Non-Food Items For Resale. Signed on 2005-09-16. Completion date: 2005-09-27.
$12,000 with U.S. Army Corps of Engineers - civil program financing only for Non-Food Items For Resale. Signed on 2005-09-16. Completion date: 2005-09-27.
CM TRUCKING & CONSTRUCTION,INC (2062 F AND S GRADE RD in SEDRO WOOLLEY, WA; small business) : $61,356 in 4 contractsin 2003
$22,720 with Army for Construction of Structures and Facilities -- Restoration of real property. Signed on 2003-11-13. Completion date: 2003-10-21.
$22,720 with U.S. Army Corps of Engineers - civil program financing only for Construction of Structures and Facilities -- Restoration of real property. Signed on 2003-11-13. Completion date: 2003-10-21.
$7,958 with U.S. Army Corps of Engineers - civil program financing only for Miscellaneous Construction Materials. Signed on 2003-11-13. Completion date: 2003-10-20.
$7,958 with Army for Miscellaneous Construction Materials. Signed on 2003-11-13. Completion date: 2003-10-20.
JANICKI INDUSTRIES, INC (24595 STATE RTE 20 in SEDRO WOOLLEY, WA; small business)
$7,100 with Army for Plastics Fabricated Materials. Signed on 2003-01-14. Completion date: 2003-02-14.
E&E Lumber (210 West State Street in Sedro-Woolley, wa; small business)
$4,641 with National Park Service for Lumber and Related Basic Wood Materials. Signed on 2006-03-08. Completion date: 2006-03-15.
Top industries in this zip code by the number of employees in 2005:
Health Care and Social Assistance: Residential Mental Health and Substance Abuse Facilities (100-249 employees: 1 establishment)
Health Care and Social Assistance: Nursing Care Facilities (100-249: 1)
Health Care and Social Assistance: Vocational Rehabilitation Services (100-249: 1)
Health Care and Social Assistance: General Medical and Surgical Hospitals (100-249: 1)
Construction: Oil and Gas Pipeline and Related Structures Construction (100-249: 1)
2003 - 2018 National Fire Incident Reporting System (NFIRS) incidents
Based on the data from the years 2003 - 2018 the average number of fires per year is 75. The highest number of fire incidents - 135 took place in 2006, and the least - 50 in 2013. The data has a rising trend.
When looking into fire subcategories, the most incidents belonged to: Structure Fires (47.0%), and Outside Fires (28.7%).
Fire incident types reported to NFIRS in Zip Code 98284

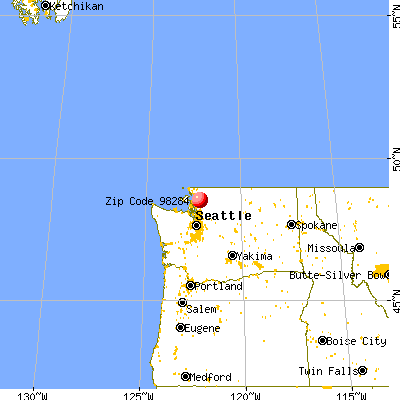


 Nearest zip codes: 98263, 98255, 98235, 98220, 98274, 98233.


 Based on the data from the years 2003 - 2018 the average number of fires per year is 75. The highest number of fire incidents - 135 took place in 2006, and the least - 50 in 2013. The data has a rising trend.
 When looking into fire subcategories, the most incidents belonged to: Structure Fires (47.0%), and Outside Fires (28.7%).