Estimated zip code population in 2022: 14,439 Zip code population in 2010: 12,870 Zip code population in 2000: 9,793
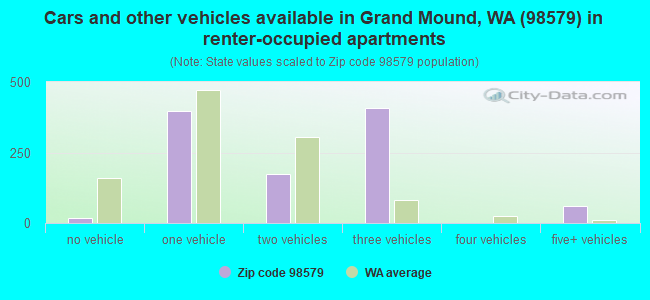
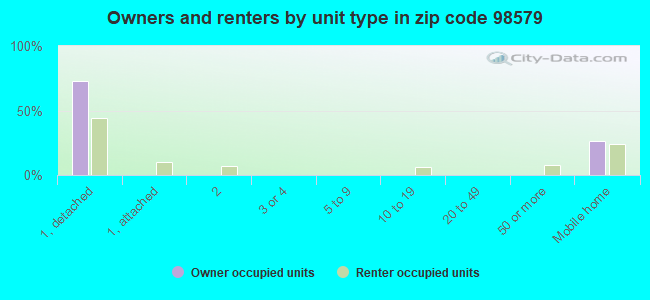
Houses and condos: 5,435 Renter-occupied apartments: 1,096
% of renters here:
21%
State:
36%
March 2022 cost of living index in zip code 98579: 105.3 (more than average, U.S. average is 100)
Land area: 90.5 sq. mi. Water area: 0.6 sq. mi.
Population density: 160 people per square mile
(very low).
OSM Map
General Map
Google Map
MSN Map
OSM Map
General Map
Google Map
MSN Map
OSM Map
General Map
Google Map
MSN Map
OSM Map
General Map
Google Map
MSN Map
Please wait while loading the map...
Real estate property taxes paid for housing units in 2022:
This zip code:
0.8% ($3,387)
Washington:
0.8% ($4,283)
Median real estate property taxes paid for housing units with mortgages in 2022: $3,500 (0.8%) Median real estate property taxes paid for housing units with no mortgage in 2022: $3,248 (0.8%)
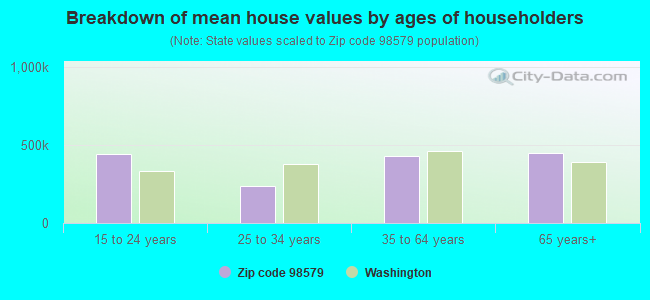
Estimated median house/condo value in 2022: $440,178
98579:
$440,178
Washington:
$569,500
According to our research of Washington and other state lists, there were 14 registered sex offenders living in 98579 zip code as of April 27, 2024. The ratio of all residents to sex offenders in zip code 98579 is 1,007 to 1. The ratio of registered sex offenders to all residents in this zip code is near the state average.
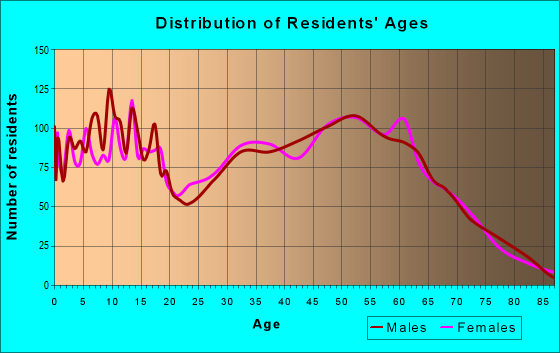
Median resident age:
This zip code:
41.1 years
Washington median age:
38.4 years
Average household size:
This zip code:
2.7 people
Washington:
2.5 people
Averages for the 2020 tax year for zip code 98579, filed in 2021:
Average Adjusted Gross Income (AGI) in 2020: $69,948 (Individual Income Tax Returns)
Here:
$69,948
State:
$99,264
Salary/wage: $58,633 (reported on 82.0% of returns)
Here:
$58,633
State:
$80,347
(% of AGI for various income ranges: 1101.2% for AGIs below $25k, 3323.9% for AGIs $25k-50k, 5804.0% for AGIs $50k-75k, 8748.6% for AGIs $75k-100k, 16485.4% for AGIs $100k-200k, 56664.0% for AGIs over 200k)
Taxable interest for individuals: $966 (reported on 29.3% of returns)
This zip code:
$966
Washington:
$2,077
(% of AGI for various income ranges: 12.7% for AGIs below $25k, 17.8% for AGIs $25k-50k, 24.0% for AGIs $50k-75k, 30.3% for AGIs $75k-100k, 68.1% for AGIs $100k-200k, 1078.0% for AGIs over 200k)
Ordinary dividends: $3,218 (reported on 12.1% of returns)
Here:
$3,218
State:
$10,013
(% of AGI for various income ranges: 24.4% for AGIs below $25k, 13.0% for AGIs $25k-50k, 36.7% for AGIs $50k-75k, 53.1% for AGIs $75k-100k, 95.3% for AGIs $100k-200k, 1402.0% for AGIs over 200k)
Net capital gain/loss in AGI: +$32,232 (reported on 11.5% of returns)
Here:
+$32,232
State:
+$40,092
(% of AGI for various income ranges: 15.0% for AGIs below $25k, 17.2% for AGIs $25k-50k, 60.5% for AGIs $50k-75k, 125.3% for AGIs $75k-100k, 417.8% for AGIs $100k-200k, 37154.0% for AGIs over 200k)
Profit/loss from business: +$14,871 (reported on 10.8% of returns)
Here:
+$14,871
State:
+$18,312
(% of AGI for various income ranges: 65.0% for AGIs below $25k, 96.6% for AGIs $25k-50k, 151.7% for AGIs $50k-75k, 220.5% for AGIs $75k-100k, 411.8% for AGIs $100k-200k, 5244.0% for AGIs over 200k)
Taxable individual retirement arrangement distribution: $17,237 (reported on 6.9% of returns)
98579:
$17,237
Washington:
$24,221
(% of AGI for various income ranges: 39.2% for AGIs below $25k, 56.5% for AGIs $25k-50k, 132.2% for AGIs $50k-75k, 157.2% for AGIs $75k-100k, 587.1% for AGIs $100k-200k)
Total itemized deductions: $33,259 (reported on 7.0% of returns)
Here:
$33,259
State:
$39,068
(% of AGI for various income ranges: 104.0% for AGIs $25k-50k, 275.8% for AGIs $50k-75k, 316.6% for AGIs $75k-100k, 621.4% for AGIs $100k-200k, 9386.0% for AGIs over 200k)
Charity contributions: $7,145 (reported on 4.6% of returns)
Here:
$7,145
State:
$15,331
(% of AGI for various income ranges: 5.4% for AGIs $25k-50k, 33.0% for AGIs $50k-75k, 33.8% for AGIs $75k-100k, 103.2% for AGIs $100k-200k, 1578.0% for AGIs over 200k)
Taxes paid: $6,405 (reported on 6.9% of returns)
98579:
$6,405
State:
$7,774
(% of AGI for various income ranges: 20.8% for AGIs $25k-50k, 55.7% for AGIs $50k-75k, 70.2% for AGIs $75k-100k, 148.6% for AGIs $100k-200k, 1094.0% for AGIs over 200k)
Earned income credit: $1,943 (reported on 12.1% of returns)
Here:
$1,943
State:
$2,020
(% of AGI for various income ranges: 61.4% for AGIs below $25k, 59.0% for AGIs $25k-50k, 1.9% for AGIs $50k-75k)
Percentage of individuals using paid preparers for their 2020 taxes: 93.8%
Here:
94%
State:
93%
(% for various income ranges: 92.1% for AGIs below $25k, 93.7% for AGIs $25k-50k, 93.5% for AGIs $50k-75k, 94.9% for AGIs $75k-100k, 95.7% for AGIs $100k-200k, 94.1% for AGIs over 200k)
Averages for the 2012 tax year for zip code 98579, filed in 2013:
Average Adjusted Gross Income (AGI) in 2012: $48,860 (Individual Income Tax Returns)
Here:
$48,860
State:
$69,533
Salary/wage: $43,871 (reported on 84.5% of returns)
Here:
$43,871
State:
$57,267
(% of AGI for various income ranges: 74.7% for AGIs below $25k, 77.5% for AGIs $25k-50k, 75.8% for AGIs $50k-75k, 79.5% for AGIs $75k-100k, 78.4% for AGIs $100k-200k, 49.6% for AGIs over 200k)
Taxable interest for individuals: $1,076 (reported on 30.8% of returns)
This zip code:
$1,076
Washington:
$1,816
(% of AGI for various income ranges: 0.9% for AGIs below $25k, 0.5% for AGIs $25k-50k, 0.5% for AGIs $50k-75k, 0.7% for AGIs $75k-100k, 0.8% for AGIs $100k-200k, 0.8% for AGIs over 200k)
Ordinary dividends: $2,456 (reported on 11.6% of returns)
Here:
$2,456
State:
$8,163
(% of AGI for various income ranges: 0.8% for AGIs below $25k, 0.5% for AGIs $25k-50k, 0.7% for AGIs $50k-75k, 0.3% for AGIs $75k-100k, 0.7% for AGIs $100k-200k, 0.8% for AGIs over 200k)
Net capital gain/loss in AGI: +$6,276 (reported on 9.3% of returns)
Here:
+$6,276
State:
+$21,568
(% of AGI for various income ranges: 0.1% for AGIs $25k-50k, 0.6% for AGIs $50k-75k, 0.5% for AGIs $75k-100k, 1.2% for AGIs $100k-200k, 12.3% for AGIs over 200k)
Profit/loss from business: +$11,798 (reported on 11.8% of returns)
Here:
+$11,798
State:
+$16,521
(% of AGI for various income ranges: 4.2% for AGIs below $25k, 2.3% for AGIs $25k-50k, 2.6% for AGIs $50k-75k, 1.5% for AGIs $75k-100k, 5.0% for AGIs $100k-200k)
Taxable individual retirement arrangement distribution: $12,175 (reported on 8.2% of returns)
98579:
$12,175
Washington:
$18,648
(% of AGI for various income ranges: 2.4% for AGIs below $25k, 1.9% for AGIs $25k-50k, 1.7% for AGIs $50k-75k, 2.3% for AGIs $75k-100k, 2.7% for AGIs $100k-200k)
Total itemized deductions: $19,099 (25% of AGI, reported on 34.0% of returns)
Here:
$19,099
State:
$23,872
Here:
25.0% of AGI
State:
18.2% of AGI
(% of AGI for various income ranges: 10.4% for AGIs below $25k, 12.4% for AGIs $25k-50k, 13.9% for AGIs $50k-75k, 13.8% for AGIs $75k-100k, 14.5% for AGIs $100k-200k, 12.2% for AGIs over 200k)
Charity contributions: $2,660 (reported on 23.9% of returns)
Here:
$2,660
State:
$4,465
(% of AGI for various income ranges: 0.5% for AGIs below $25k, 0.9% for AGIs $25k-50k, 1.2% for AGIs $50k-75k, 1.2% for AGIs $75k-100k, 1.7% for AGIs $100k-200k, 3.1% for AGIs over 200k)
Taxes paid: $4,490 (reported on 33.2% of returns)
98579:
$4,490
State:
$6,400
(% of AGI for various income ranges: 1.7% for AGIs below $25k, 2.7% for AGIs $25k-50k, 3.2% for AGIs $50k-75k, 3.3% for AGIs $75k-100k, 3.6% for AGIs $100k-200k, 2.5% for AGIs over 200k)
Earned income credit: $2,090 (reported on 18.7% of returns)
Here:
$2,090
State:
$2,073
(% of AGI for various income ranges: 6.4% for AGIs below $25k, 1.1% for AGIs $25k-50k)
Percentage of individuals using paid preparers for their 2012 taxes: 43.1%
Here:
43%
State:
43%
(% for various income ranges: 38.4% for AGIs below $25k, 45.1% for AGIs $25k-50k, 45.4% for AGIs $50k-75k, 45.2% for AGIs $75k-100k, 43.5% for AGIs $100k-200k, 100.0% for AGIs over 200k)
Averages for the 2004 tax year for zip code 98579, filed in 2005:
Average Adjusted Gross Income (AGI) in 2004: $40,185 (Individual Income Tax Returns)
Here:
$40,185
State:
$54,331
Salary/wage: $37,682 (reported on 86.0% of returns)
Here:
$37,682
State:
$45,761
(% of AGI for various income ranges: 155.9% for AGIs below $10k, 74.6% for AGIs $10k-25k, 83.1% for AGIs $25k-50k, 84.0% for AGIs $50k-75k, 86.6% for AGIs $75k-100k, 59.4% for AGIs over 100k)
Taxable interest for individuals: $1,052 (reported on 40.6% of returns)
This zip code:
$1,052
Washington:
$2,110
(% of AGI for various income ranges: 7.1% for AGIs below $10k, 1.9% for AGIs $10k-25k, 1.0% for AGIs $25k-50k, 0.5% for AGIs $50k-75k, 0.7% for AGIs $75k-100k, 1.5% for AGIs over 100k)
Taxable dividends: $1,603 (reported on 14.3% of returns)
Here:
$1,603
State:
$5,879
(% of AGI for various income ranges: 3.7% for AGIs below $10k, 1.1% for AGIs $10k-25k, 0.4% for AGIs $25k-50k, 0.4% for AGIs $50k-75k, 0.3% for AGIs $75k-100k, 1.0% for AGIs over 100k)
Net capital gain/loss: +$9,382 (reported on 12.6% of returns)
Here:
+$9,382
State:
+$15,835
(% of AGI for various income ranges: -2.8% for AGIs below $10k, 0.1% for AGIs $10k-25k, 0.5% for AGIs $25k-50k, 0.5% for AGIs $50k-75k, 1.9% for AGIs $75k-100k, 15.7% for AGIs over 100k)
Profit/loss from business: +$8,429 (reported on 13.7% of returns)
Here:
+$8,429
State:
+$13,994
(% of AGI for various income ranges: -10.0% for AGIs below $10k, 4.4% for AGIs $10k-25k, 2.6% for AGIs $25k-50k, 2.8% for AGIs $50k-75k, 2.2% for AGIs $75k-100k, 4.5% for AGIs over 100k)
IRA payment deduction: $2,817 (reported on 1.9% of returns)
98579:
$2,817
Washington:
$3,001
(% of AGI for various income ranges: 0.2% for AGIs $25k-50k, 0.1% for AGIs $50k-75k, 0.1% for AGIs $75k-100k, 0.2% for AGIs over 100k)
Self-employed pension: $5,909 (reported on 0.2% of returns)
Here:
$5,909
Washington:
$14,244
Total itemized deductions: $15,472 (25% of AGI, reported on 35.3% of returns)
Here:
$15,472
State:
$19,669
Here:
24.9% of AGI
State:
20.7% of AGI
(% of AGI for various income ranges: 24.0% for AGIs below $10k, 10.2% for AGIs $10k-25k, 13.1% for AGIs $25k-50k, 13.9% for AGIs $50k-75k, 15.4% for AGIs $75k-100k, 12.8% for AGIs over 100k)
Charity contributions deductions: $1,948 (3% of AGI, reported on 26.8% of returns)
Here:
$1,948
State:
$3,569
Here:
3.0% of AGI
State:
3.5% of AGI
(% of AGI for various income ranges: 1.0% for AGIs below $10k, 0.7% for AGIs $10k-25k, 1.1% for AGIs $25k-50k, 1.2% for AGIs $50k-75k, 1.5% for AGIs $75k-100k, 2.2% for AGIs over 100k)
Total tax: $4,650 (reported on 75.9% of returns)
98579:
$4,650
State:
$9,065
(% of AGI for various income ranges: 3.8% for AGIs below $10k, 3.9% for AGIs $10k-25k, 6.3% for AGIs $25k-50k, 8.6% for AGIs $50k-75k, 9.9% for AGIs $75k-100k, 15.7% for AGIs over 100k)
Earned income credit: $1,646 (reported on 15.6% of returns)
Here:
$1,646
State:
$1,607
Percentage of individuals using paid preparers for their 2004 taxes: 52.8%
Here:
53%
State:
49%
(% for various income ranges: 45.8% for AGIs below $10k, 55.5% for AGIs $10k-25k, 53.2% for AGIs $25k-50k, 51.7% for AGIs $50k-75k, 55.2% for AGIs $75k-100k, 63.6% for AGIs over 100k)
Household received Food Stamps/SNAP in the past 12 months: 660 Household did not receive Food Stamps/SNAP in the past 12 months: 4,634
Women who had a birth in the past 12 months: 132 (99 now married, 32 unmarried) Women who did not have a birth in the past 12 months: 3,238 (1,527 now married, 1,708 unmarried)
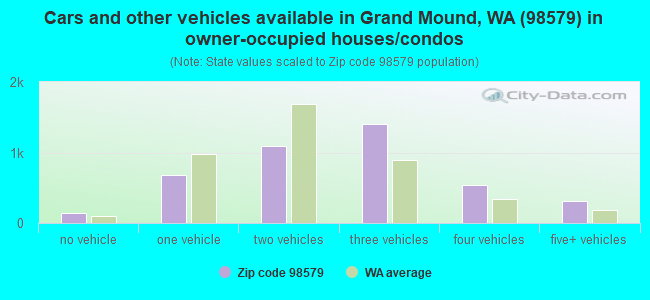
Housing units in zip code 98579 with a mortgage: 2,840 (141 second mortgage, 111 both second mortgage and home equity loan) Houses without a mortgage: 37
Median monthly owner costs for units with a mortgage: $1,847 Median monthly owner costs for units without a mortgage: $637
Residents with income below the poverty level in 2022:
This zip code:
10.6%
Whole state:
10.0%
Residents with income below 50% of the poverty level in 2022:
This zip code:
6.9%
Whole state:
4.6%
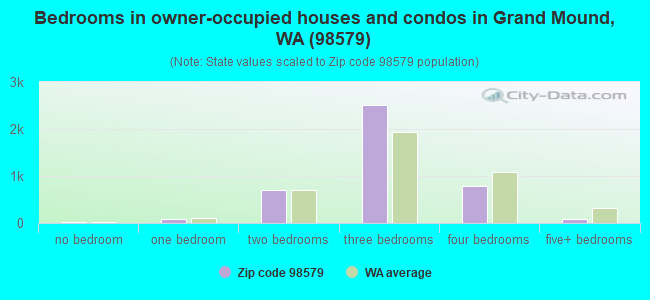
Median number of rooms in houses and condos:
Here:
6.0
State:
6.5
Median number of rooms in apartments:
Here:
4.0
State:
3.9
Notable locations in this zip code not listed on our city pages
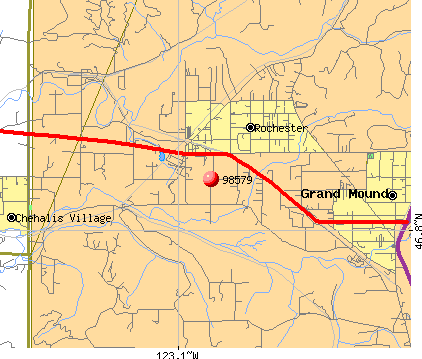
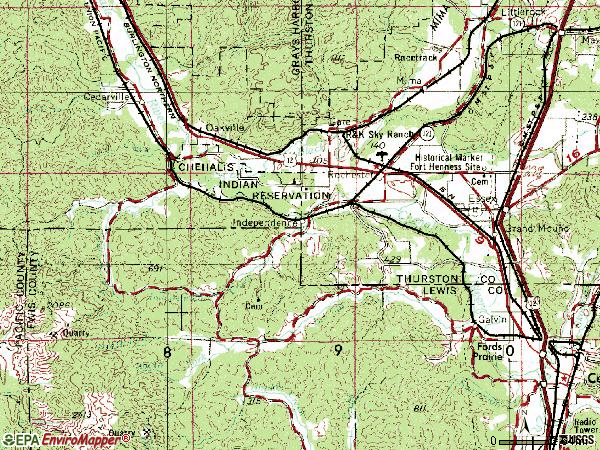
Notable locations in zip code 98579: Gate (A), Lincoln Creek Grange (B), Helsing Junction (C), Lewis County Fire District 12 Riverside Fire Authority Station 7 (D), Lewis County Fire District 12 Riverside Fire Authority Station 8 (E), Thurston County Fire District 1 and 11 West Thurston Regional Fire Authority Station 1 Grand Mound (F), Thurston County Fire District 1 Station 3 (G), Lewis County Fire District 12 Riverside Fire Authority Station 6 (H), Thurston County Fire District 1 and 11 West Thurston Regional Fire Authority Station 1 - 3 Rochester (I). Display/hide their locations on the map
Churches in zip code 98579 include: Crossroads Foursquare Church (A), Rochester United Methodist Church (B), Rochester Life Assembly of God Church (C), The Church of Jesus Christ of Latter Day Saints (D). Display/hide their locations on the map
Creeks: North Fork Lincoln Creek (A), Scatter Creek (B), South Fork Lincoln Creek (C), Wildcat Creek (D), Mima Creek (E). Display/hide their locations on the map
Parks in zip code 98579 include: Grand Mound State Game Reserve (1), Historical Marker Fort Henness Site (2), Scatter Creek Wildlife Recreation Area (3). Display/hide their locations on the map
2,145 married couples with children.
293 single-parent households (121 men, 172 women).
91.7% of residents of 98579 zip code speak English at home.
7.4% of residents speak Spanish at home (62% very well, 19% well, 13% not well, 6% not at all).
0.1% of residents speak other Indo-European language at home (100% very well).
0.2% of residents speak Asian or Pacific Island language at home (44% very well, 22% well, 11% not well, 22% not at all).
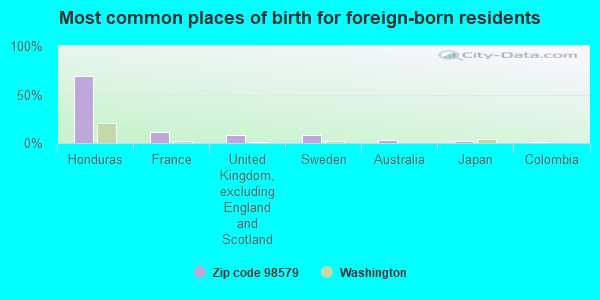
Foreign born population: 799 (5.5%) (32.5% of them are naturalized citizens)
This zip code:
5.5%
Whole state:
15.3%
69%Honduras
11%France
8%United Kingdom, excluding England and Scotland
8%Sweden
3%Australia
2%Japan
1%Colombia
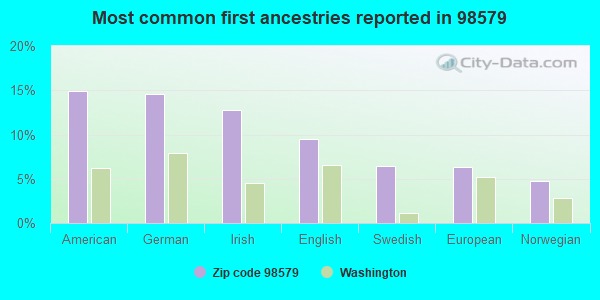
15%American
15%German
13%Irish
9%English
6%Swedish
6%European
5%Norwegian
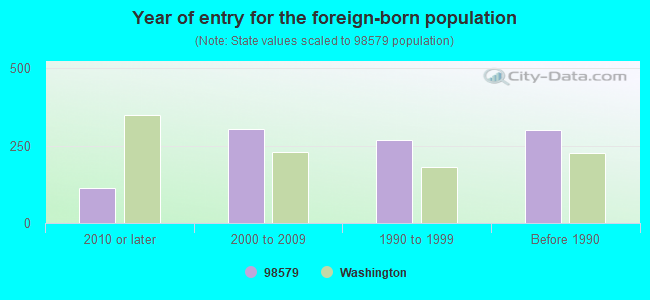
Year of entry for the foreign-born population
1132010 or later
3052000 to 2009
2691990 to 1999
300Before 1990
Facilities with environmental interests located in this zip code:
AGRILIANCE (10330 SCHOOLLAND RD SW in ROCHESTER, WA)
(Resource Conservation and Recovery Act (tracking hazardous waste)) STATE MASTER (Washington State Department of Ecology's Facility/Site identification system) - HAZWASTE-WAR000005249, EPCRA Business SIC classification: FERTILIZERS, MIXING ONLY; FARM SUPPLIES Business NAICS classification: FERTILIZER (MIXING ONLY) MANUFACTURING.; FERTILIZER (MIXING ONLY) MANUFACTURING. Organizations: RONALD WOLFKILL (CONTACT/OPERATOR)
Alternative names: CENEX LAND O LAKES
ARCO 4469 (19705 OLD HWY 99 SW in ROCHESTER, WA)
(Resource Conservation and Recovery Act (tracking hazardous waste)) STATE MASTER (Washington State Department of Ecology's Facility/Site identification system) - TOXICS-8771, LEAKING STORAGE TANK, UNDERGROUND STORAGE TANK PROGRAM, TOXICS-, VOLUNTARY CLEAN UP PROGRAM, HAZWASTE-WAD988514725, EPCRA, SQG Business SIC classification: GASOLINE SERVICE STATIONS Organizations: REGGIE STAFFORD (CONTACT/OPERATOR)
, BP WEST COAST PRODUCTS LLC (CONTACT/OWNER)
Alternative names: ARCO 04469
CAPITOL STATE FOREST DUMP (T16N R3W S20 in ROCHESTER, WA)
Conditionally Exempt Small Quantity Generators, less than 100 kg/month of hazardous waste (Resource Conservation and Recovery Act (tracking hazardous waste)) STATE MASTER (Washington State Department of Ecology's Facility/Site identification system) - HAZWASTE-WAD988469086, CESQG Organizations: WA ECY (CONTACT/ HAZARDOUS WASTE)
, MIKE OSWEILER (CONTACT/OPERATOR)
, WA STATE (CONTACT/OWNER)
1940 DESOTO DRUG LAB (20428 GRAND MOUND WAY in ROCHESTER, WA)
(Resource Conservation and Recovery Act (tracking hazardous waste)) Organizations: WA ECY (CONTACT/OWNER)
AMERICAN GOLD SEAFOODS LLC (5500 180TH AVENUE SW in ROCHESTER, WA)
National Pollutant Discharge Elimination System NON-MAJOR (Tracking pollutant discharge elimination systems) - permit Business SIC classification: FISH HATCHERIES AND PRESERVES Alternative names: GLOBAL AQUA-USA INC, NORTHWEST SEA FARMS-ROCHESTER
Housing units lacking complete plumbing facilities: 0.6% Housing units lacking complete kitchen facilities: 0.7%
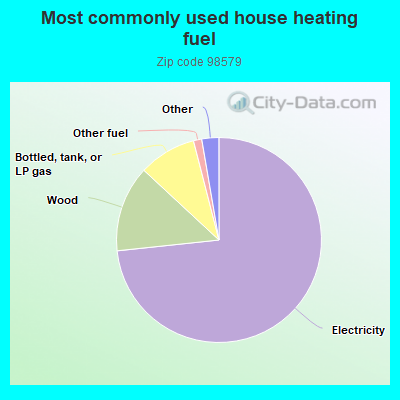
73.4%Electricity
13.6%Wood
9.1%Bottled, tank, or LP gas
1.3%Other fuel
1.0%Utility gas
0.9%Solar energy
0.6%Fuel oil, kerosene, etc.
Population in 1990: 8,231. Population change in the 1990s: +1,562 (+19.0%).
Place of birth for U.S.-born residents:
This state: 9,122
Northeast: 213
Midwest: 985
South: 812
West: 2,210
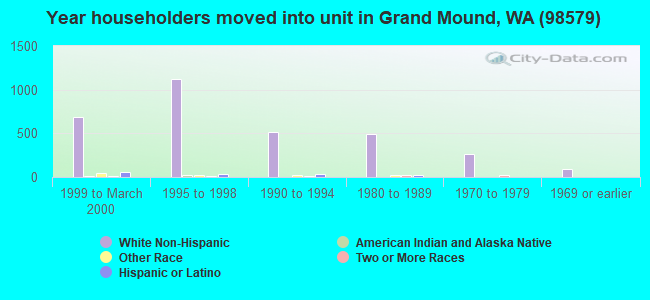
52% of the 98579 zip code residents lived in the same house 5 years ago. Out of people who lived in different houses, 45% lived in this county. Out of people who lived in different counties, 50% lived in Washington.
91% of the 98579 zip code residents lived in the same house 1 year ago. Out of people who lived in different houses, 22% moved from this county. Out of people who lived in different houses, 69% moved from different county within same state. Out of people who lived in different houses, 16% moved from different state.
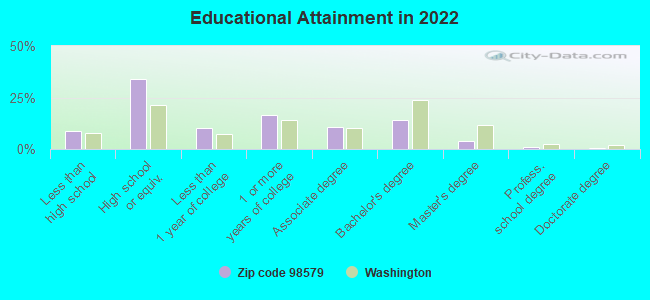
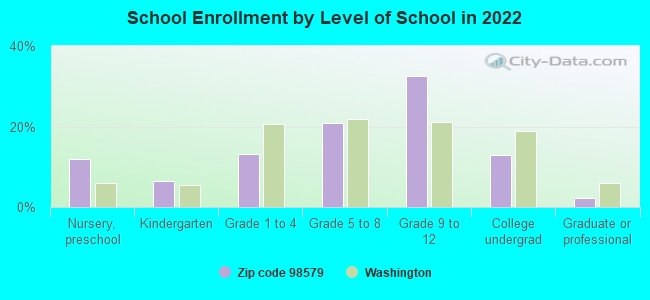
Private vs. public school enrollment:
Students in private schools in grades 1 to 8 (elementary and middle school): 36
Here:
4.3%
Washington:
12.4%
Students in private schools in grades 9 to 12 (high school): 23
Here:
2.9%
Washington:
9.2%
Students in private undergraduate colleges: 71
Here:
22.1%
Washington:
16.5%
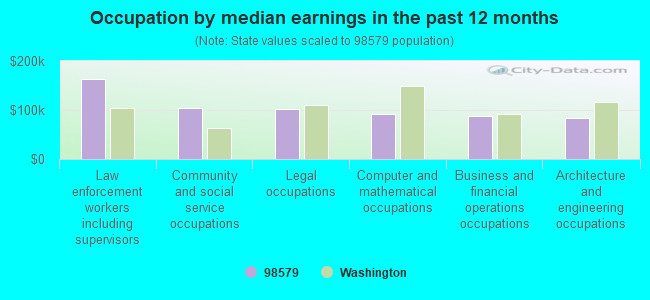
Occupation by median earnings in the past 12 months ($)
163,121Law enforcement workers including supervisors
104,042Community and social service occupations
102,443Legal occupations
92,379Computer and mathematical occupations
88,376Business and financial operations occupations
83,801Architecture and engineering occupations
Companies with federal contracts located in this zip code:
VALLEY FRESH FOODS INC (19210 ANDERSON RD in ROCHESTER, WA) : $1,724,942 in 11 contractsfrom 2004 to 2006
Contracts for Dairy Foods and Eggs, Meat, Poultry, and Fish by Defense Commissary Agency Signed by year:2000: $0; 2001: $0; 2002: $0; 2003: $0; 2004: $368,470; 2005: $818,308; 2006: $538,164.
Biggest contracts:
$368,470 with Defense Commissary Agency for Dairy Foods and Eggs. Signed on 2004-10-01. Completion date: 2005-02-28.
$217,801, same as above.Signed on 2006-01-01. Completion date: 2006-01-31.
$194,855, same as above.Signed on 2005-10-01. Completion date: 2005-11-30.
$169,227 with Defense Commissary Agency for Meat, Poultry, and Fish. Signed on 2005-01-31. Completion date: 2005-03-31.
MARTIN SAND & GRAVEL, INC (6500 - 196TH AVENUE SW in ROCHESTER, WA; small business)
$3,452 with U.S. Army Corps of Engineers - civil program financing only for Maintenance, Repair or Alteration of Real Property -- Highways, Roads, Streets, Bridges, and Railways (includes resurfacing). Signed on 2002-01-09. Completion date: 2002-01-11.
Top industries in this zip code by the number of employees in 2005:
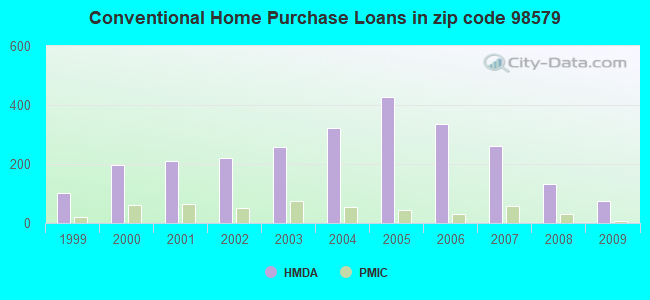
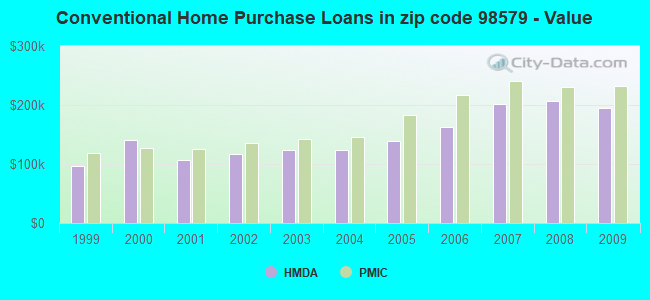
Detailed PMIC statistics for the following Tracts:0127.00
2002 - 2018 National Fire Incident Reporting System (NFIRS) incidents
According to the data from the years 2002 - 2018 the average number of fires per year is 109. The highest number of fires - 194 took place in 2004, and the least - 20 in 2012. The data has a growing trend.
When looking into fire subcategories, the most incidents belonged to: Outside Fires (50.9%), and Structure Fires (30.9%).
Fire incident types reported to NFIRS in Zip Code 98579


 Nearest zip codes: 98544, 98532, 98512, 98568, 98531, 98559.


 According to the data from the years 2002 - 2018 the average number of fires per year is 109. The highest number of fires - 194 took place in 2004, and the least - 20 in 2012. The data has a growing trend.
 When looking into fire subcategories, the most incidents belonged to: Outside Fires (50.9%), and Structure Fires (30.9%).