Estimated zip code population in 2022: 39,160 Zip code population in 2010: 35,240 Zip code population in 2000: 32,380
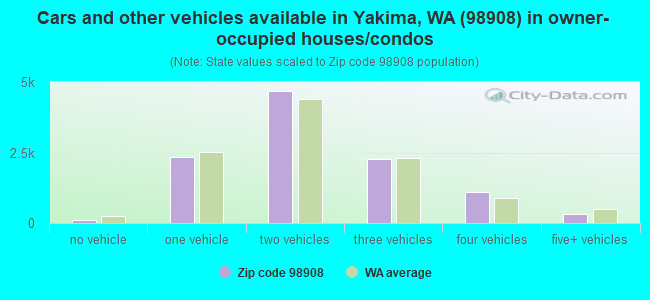
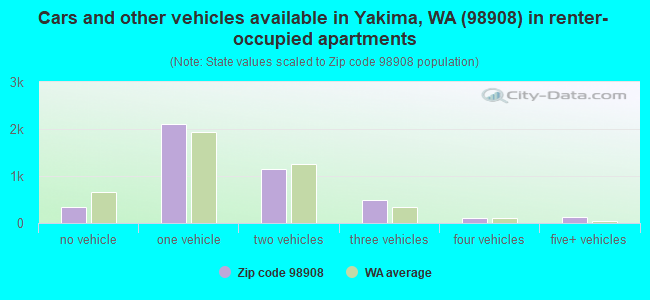
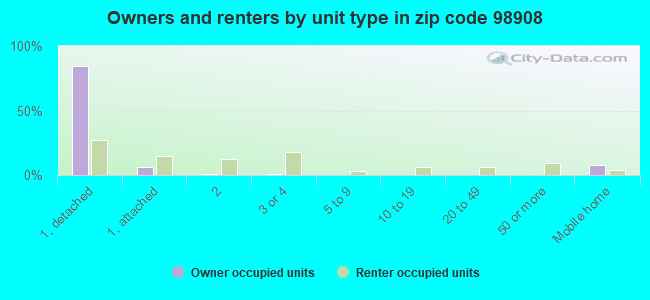
Houses and condos: 15,815 Renter-occupied apartments: 4,357
% of renters here:
29%
State:
36%
March 2022 cost of living index in zip code 98908: 96.2 (near average, U.S. average is 100)
Land area: 98.8 sq. mi. Water area: 0.3 sq. mi.
Population density: 396 people per square mile
(very low).
OSM Map
General Map
Google Map
MSN Map
OSM Map
General Map
Google Map
MSN Map
OSM Map
General Map
Google Map
MSN Map
OSM Map
General Map
Google Map
MSN Map
Please wait while loading the map...
Real estate property taxes paid for housing units in 2022:
This zip code:
0.7% ($2,934)
Washington:
0.8% ($4,283)
Median real estate property taxes paid for housing units with mortgages in 2022: $2,980 (0.7%) Median real estate property taxes paid for housing units with no mortgage in 2022: $2,867 (0.8%)
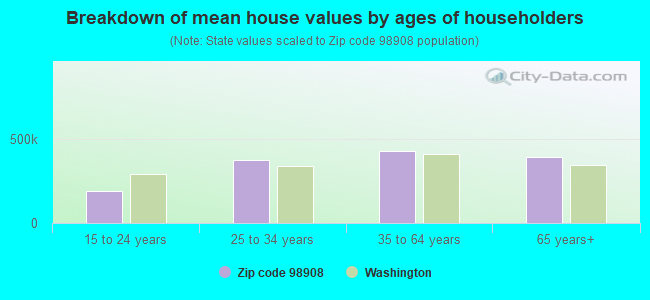
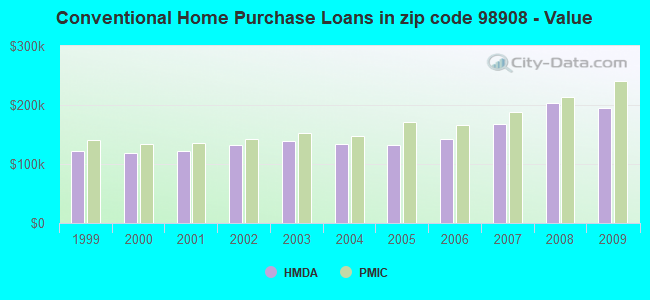
Estimated median house/condo value in 2022: $396,027
98908:
$396,027
Washington:
$569,500
According to our research of Washington and other state lists, there were 16 registered sex offenders living in 98908 zip code as of April 27, 2024. The ratio of all residents to sex offenders in zip code 98908 is 2,261 to 1. The ratio of registered sex offenders to all residents in this zip code is lower than the state average.
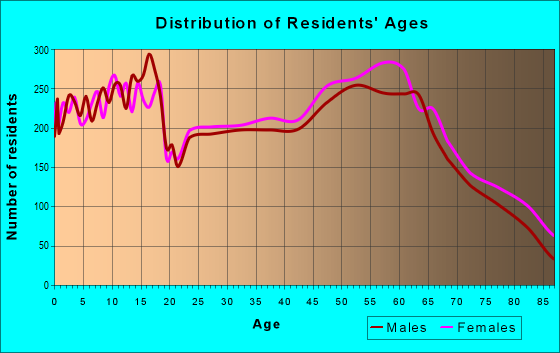
Median resident age:
This zip code:
40.2 years
Washington median age:
38.4 years
Average household size:
This zip code:
2.6 people
Washington:
2.5 people
Averages for the 2020 tax year for zip code 98908, filed in 2021:
Average Adjusted Gross Income (AGI) in 2020: $83,579 (Individual Income Tax Returns)
Here:
$83,579
State:
$99,264
Salary/wage: $60,309 (reported on 78.7% of returns)
Here:
$60,309
State:
$80,347
(% of AGI for various income ranges: 1214.3% for AGIs below $25k, 3362.3% for AGIs $25k-50k, 5948.4% for AGIs $50k-75k, 8802.2% for AGIs $75k-100k, 17244.8% for AGIs $100k-200k, 56675.1% for AGIs over 200k)
Taxable interest for individuals: $3,375 (reported on 30.5% of returns)
This zip code:
$3,375
Washington:
$2,077
(% of AGI for various income ranges: 22.5% for AGIs below $25k, 25.3% for AGIs $25k-50k, 57.1% for AGIs $50k-75k, 91.3% for AGIs $75k-100k, 240.5% for AGIs $100k-200k, 3201.1% for AGIs over 200k)
Ordinary dividends: $14,222 (reported on 20.9% of returns)
Here:
$14,222
State:
$10,013
(% of AGI for various income ranges: 39.1% for AGIs below $25k, 43.8% for AGIs $25k-50k, 143.8% for AGIs $50k-75k, 185.4% for AGIs $75k-100k, 449.4% for AGIs $100k-200k, 11341.1% for AGIs over 200k)
Net capital gain/loss in AGI: +$30,285 (reported on 20.4% of returns)
Here:
+$30,285
State:
+$40,092
(% of AGI for various income ranges: 26.5% for AGIs below $25k, 36.4% for AGIs $25k-50k, 117.9% for AGIs $50k-75k, 212.5% for AGIs $75k-100k, 817.5% for AGIs $100k-200k, 27028.9% for AGIs over 200k)
Profit/loss from business: +$17,888 (reported on 11.7% of returns)
Here:
+$17,888
State:
+$18,312
(% of AGI for various income ranges: 73.6% for AGIs below $25k, 99.1% for AGIs $25k-50k, 143.5% for AGIs $50k-75k, 277.6% for AGIs $75k-100k, 530.9% for AGIs $100k-200k, 4983.4% for AGIs over 200k)
Taxable individual retirement arrangement distribution: $22,213 (reported on 11.8% of returns)
98908:
$22,213
Washington:
$24,221
(% of AGI for various income ranges: 80.0% for AGIs below $25k, 122.0% for AGIs $25k-50k, 277.3% for AGIs $50k-75k, 466.3% for AGIs $75k-100k, 991.1% for AGIs $100k-200k, 3846.0% for AGIs over 200k)
Self-employed (Keogh) retirement plans: $24,910 (reported on 0.5% of returns)
98908:
$24,910
Washington:
$24,166
(% of AGI for various income ranges: 26.7% for AGIs $75k-100k, 610.9% for AGIs over 200k)
Total itemized deductions: $40,199 (reported on 7.3% of returns)
Here:
$40,199
State:
$39,068
(% of AGI for various income ranges: 46.0% for AGIs below $25k, 103.9% for AGIs $25k-50k, 256.3% for AGIs $50k-75k, 367.5% for AGIs $75k-100k, 774.6% for AGIs $100k-200k, 7646.0% for AGIs over 200k)
Charity contributions: $17,181 (reported on 5.9% of returns)
Here:
$17,181
State:
$15,331
(% of AGI for various income ranges: 4.1% for AGIs below $25k, 17.0% for AGIs $25k-50k, 41.5% for AGIs $50k-75k, 75.8% for AGIs $75k-100k, 273.8% for AGIs $100k-200k, 3377.7% for AGIs over 200k)
Taxes paid: $6,580 (reported on 7.3% of returns)
98908:
$6,580
State:
$7,774
(% of AGI for various income ranges: 6.1% for AGIs below $25k, 16.6% for AGIs $25k-50k, 43.4% for AGIs $50k-75k, 74.8% for AGIs $75k-100k, 166.6% for AGIs $100k-200k, 1023.7% for AGIs over 200k)
Earned income credit: $2,073 (reported on 11.8% of returns)
Here:
$2,073
State:
$2,020
(% of AGI for various income ranges: 68.2% for AGIs below $25k, 58.5% for AGIs $25k-50k, 1.2% for AGIs $50k-75k)
Percentage of individuals using paid preparers for their 2020 taxes: 93.2%
Here:
93%
State:
93%
(% for various income ranges: 92.0% for AGIs below $25k, 93.4% for AGIs $25k-50k, 94.0% for AGIs $50k-75k, 93.8% for AGIs $75k-100k, 93.3% for AGIs $100k-200k, 94.5% for AGIs over 200k)
Averages for the 2012 tax year for zip code 98908, filed in 2013:
Average Adjusted Gross Income (AGI) in 2012: $71,577 (Individual Income Tax Returns)
Here:
$71,577
State:
$69,533
Salary/wage: $50,613 (reported on 80.4% of returns)
Here:
$50,613
State:
$57,267
(% of AGI for various income ranges: 71.3% for AGIs below $25k, 73.8% for AGIs $25k-50k, 71.0% for AGIs $50k-75k, 72.4% for AGIs $75k-100k, 71.5% for AGIs $100k-200k, 27.7% for AGIs over 200k)
Taxable interest for individuals: $3,163 (reported on 36.5% of returns)
This zip code:
$3,163
Washington:
$1,816
(% of AGI for various income ranges: 2.1% for AGIs below $25k, 1.1% for AGIs $25k-50k, 1.1% for AGIs $50k-75k, 1.0% for AGIs $75k-100k, 1.5% for AGIs $100k-200k, 2.2% for AGIs over 200k)
Ordinary dividends: $9,961 (reported on 22.7% of returns)
Here:
$9,961
State:
$8,163
(% of AGI for various income ranges: 2.4% for AGIs below $25k, 1.8% for AGIs $25k-50k, 1.6% for AGIs $50k-75k, 1.4% for AGIs $75k-100k, 1.8% for AGIs $100k-200k, 5.9% for AGIs over 200k)
Net capital gain/loss in AGI: +$9,124 (reported on 18.9% of returns)
Here:
+$9,124
State:
+$21,568
(% of AGI for various income ranges: 0.3% for AGIs $25k-50k, 0.8% for AGIs $50k-75k, 0.5% for AGIs $75k-100k, 2.1% for AGIs $100k-200k, 5.1% for AGIs over 200k)
Profit/loss from business: +$17,116 (reported on 12.7% of returns)
Here:
+$17,116
State:
+$16,521
(% of AGI for various income ranges: 4.6% for AGIs below $25k, 3.1% for AGIs $25k-50k, 2.5% for AGIs $50k-75k, 3.1% for AGIs $75k-100k, 3.1% for AGIs $100k-200k, 2.9% for AGIs over 200k)
Taxable individual retirement arrangement distribution: $17,598 (reported on 13.0% of returns)
98908:
$17,598
Washington:
$18,648
(% of AGI for various income ranges: 4.2% for AGIs below $25k, 2.7% for AGIs $25k-50k, 3.3% for AGIs $50k-75k, 3.6% for AGIs $75k-100k, 4.3% for AGIs $100k-200k, 2.3% for AGIs over 200k)
Self-employment retirement plans: $21,167 (reported on 0.7% of returns)
98908:
$21,167
Washington:
$20,087
(% of AGI for various income ranges: 0.2% for AGIs $50k-75k, 0.2% for AGIs $100k-200k, 0.4% for AGIs over 200k)
Total itemized deductions: $21,873 (17% of AGI, reported on 31.8% of returns)
Here:
$21,873
State:
$23,872
Here:
16.6% of AGI
State:
18.2% of AGI
(% of AGI for various income ranges: 11.3% for AGIs below $25k, 10.1% for AGIs $25k-50k, 11.4% for AGIs $50k-75k, 12.6% for AGIs $75k-100k, 12.1% for AGIs $100k-200k, 6.1% for AGIs over 200k)
Charity contributions: $5,379 (reported on 24.9% of returns)
Here:
$5,379
State:
$4,465
(% of AGI for various income ranges: 0.9% for AGIs below $25k, 1.2% for AGIs $25k-50k, 1.7% for AGIs $50k-75k, 2.1% for AGIs $75k-100k, 2.3% for AGIs $100k-200k, 2.0% for AGIs over 200k)
Taxes paid: $5,313 (reported on 31.5% of returns)
98908:
$5,313
State:
$6,400
(% of AGI for various income ranges: 1.8% for AGIs below $25k, 2.5% for AGIs $25k-50k, 2.6% for AGIs $50k-75k, 2.9% for AGIs $75k-100k, 3.2% for AGIs $100k-200k, 1.5% for AGIs over 200k)
Earned income credit: $2,182 (reported on 14.7% of returns)
Here:
$2,182
State:
$2,073
(% of AGI for various income ranges: 5.1% for AGIs below $25k, 1.1% for AGIs $25k-50k)
Percentage of individuals using paid preparers for their 2012 taxes: 49.4%
Here:
49%
State:
43%
(% for various income ranges: 42.5% for AGIs below $25k, 46.8% for AGIs $25k-50k, 50.6% for AGIs $50k-75k, 53.6% for AGIs $75k-100k, 59.1% for AGIs $100k-200k, 82.8% for AGIs over 200k)
Averages for the 2004 tax year for zip code 98908, filed in 2005:
Average Adjusted Gross Income (AGI) in 2004: $53,784 (Individual Income Tax Returns)
Here:
$53,784
State:
$54,331
Salary/wage: $43,442 (reported on 80.9% of returns)
Here:
$43,442
State:
$45,761
(% of AGI for various income ranges: 613.9% for AGIs below $10k, 70.7% for AGIs $10k-25k, 76.1% for AGIs $25k-50k, 76.7% for AGIs $50k-75k, 77.6% for AGIs $75k-100k, 48.3% for AGIs over 100k)
Taxable interest for individuals: $3,057 (reported on 53.1% of returns)
This zip code:
$3,057
Washington:
$2,110
(% of AGI for various income ranges: 65.2% for AGIs below $10k, 4.3% for AGIs $10k-25k, 2.3% for AGIs $25k-50k, 1.9% for AGIs $50k-75k, 2.1% for AGIs $75k-100k, 3.5% for AGIs over 100k)
Taxable dividends: $3,914 (reported on 28.9% of returns)
Here:
$3,914
State:
$5,879
(% of AGI for various income ranges: 41.3% for AGIs below $10k, 2.3% for AGIs $10k-25k, 1.7% for AGIs $25k-50k, 1.6% for AGIs $50k-75k, 1.5% for AGIs $75k-100k, 2.4% for AGIs over 100k)
Net capital gain/loss: +$14,023 (reported on 25.2% of returns)
Here:
+$14,023
State:
+$15,835
(% of AGI for various income ranges: 45.4% for AGIs below $10k, 0.8% for AGIs $10k-25k, 0.9% for AGIs $25k-50k, 1.6% for AGIs $50k-75k, 2.3% for AGIs $75k-100k, 13.0% for AGIs over 100k)
Profit/loss from business: +$14,110 (reported on 14.1% of returns)
Here:
+$14,110
State:
+$13,994
(% of AGI for various income ranges: 0.2% for AGIs below $10k, 3.8% for AGIs $10k-25k, 3.4% for AGIs $25k-50k, 3.2% for AGIs $50k-75k, 2.8% for AGIs $75k-100k, 4.3% for AGIs over 100k)
IRA payment deduction: $3,092 (reported on 3.0% of returns)
98908:
$3,092
Washington:
$3,001
(% of AGI for various income ranges: 2.3% for AGIs below $10k, 0.2% for AGIs $10k-25k, 0.3% for AGIs $25k-50k, 0.2% for AGIs $50k-75k, 0.2% for AGIs $75k-100k, 0.1% for AGIs over 100k)
Self-employed pension: $15,631 (reported on 1.1% of returns)
Here:
$15,631
Washington:
$14,244
(% of AGI for various income ranges: 0.1% for AGIs $25k-50k, 0.1% for AGIs $50k-75k, 0.2% for AGIs $75k-100k, 0.6% for AGIs over 100k)
Total itemized deductions: $18,229 (20% of AGI, reported on 34.9% of returns)
Here:
$18,229
State:
$19,669
Here:
20.5% of AGI
State:
20.7% of AGI
(% of AGI for various income ranges: 80.8% for AGIs below $10k, 11.0% for AGIs $10k-25k, 12.7% for AGIs $25k-50k, 13.7% for AGIs $50k-75k, 13.7% for AGIs $75k-100k, 9.8% for AGIs over 100k)
Charity contributions deductions: $4,697 (5% of AGI, reported on 29.6% of returns)
Here:
$4,697
State:
$3,569
Here:
5.0% of AGI
State:
3.5% of AGI
(% of AGI for various income ranges: 7.0% for AGIs below $10k, 1.1% for AGIs $10k-25k, 1.7% for AGIs $25k-50k, 2.1% for AGIs $50k-75k, 2.2% for AGIs $75k-100k, 3.5% for AGIs over 100k)
Total tax: $9,395 (reported on 76.5% of returns)
98908:
$9,395
State:
$9,065
(% of AGI for various income ranges: 17.2% for AGIs below $10k, 3.9% for AGIs $10k-25k, 6.7% for AGIs $25k-50k, 8.9% for AGIs $50k-75k, 10.4% for AGIs $75k-100k, 20.3% for AGIs over 100k)
Earned income credit: $1,600 (reported on 11.7% of returns)
Here:
$1,600
State:
$1,607
Percentage of individuals using paid preparers for their 2004 taxes: 56.6%
Here:
57%
State:
49%
(% for various income ranges: 46.4% for AGIs below $10k, 56.7% for AGIs $10k-25k, 57.4% for AGIs $25k-50k, 57.2% for AGIs $50k-75k, 58.1% for AGIs $75k-100k, 70.5% for AGIs over 100k)
Likely homosexual households (counted as self-reported same-sex unmarried-partner households)
Lesbian couples: 0.1% of all households
Gay men: 0.2% of all households
Household received Food Stamps/SNAP in the past 12 months: 1,429 Household did not receive Food Stamps/SNAP in the past 12 months: 13,741
Women who had a birth in the past 12 months: 482 (303 now married, 170 unmarried) Women who did not have a birth in the past 12 months: 8,360 (3,587 now married, 4,776 unmarried)
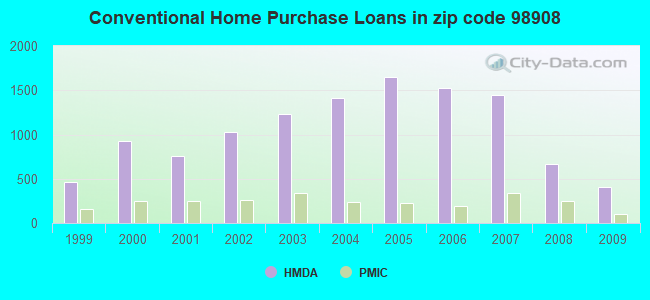
Housing units in zip code 98908 with a mortgage: 6,227 (646 second mortgage, 74 home equity loan, 536 both second mortgage and home equity loan) Houses without a mortgage: 71
Median monthly owner costs for units with a mortgage: $1,752 Median monthly owner costs for units without a mortgage: $603
Residents with income below the poverty level in 2022:
This zip code:
9.3%
Whole state:
10.0%
Residents with income below 50% of the poverty level in 2022:
This zip code:
5.6%
Whole state:
4.6%
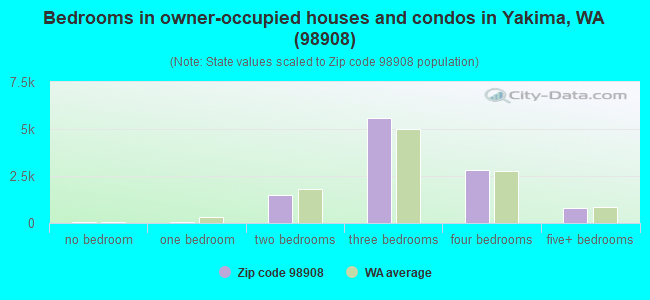
Median number of rooms in houses and condos:
Here:
6.9
State:
6.5
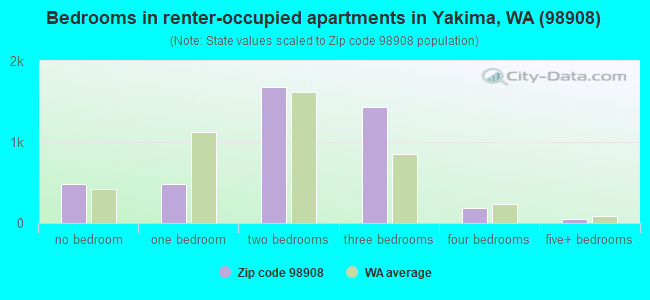
Median number of rooms in apartments:
Here:
4.4
State:
3.9
Notable locations in this zip code not listed on our city pages
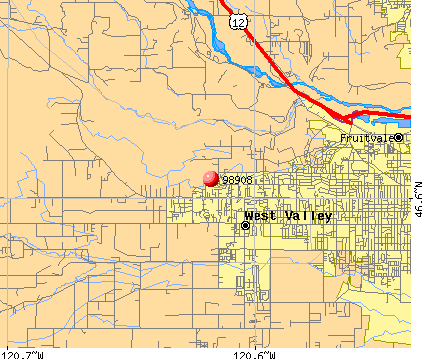
Notable locations in zip code 98908: Lower Naches Grange (A), Meadow Brook (B), Ramblers Park (C), Orchard (D), Mallett (E), Henrybro (F), Exchange (G), Eastman (H), Congdon (I), Bannister (J), Popejoy Orchard (K), Congdon Orchards (L), Swanson Orchards (M), Johnson Orchards (N), G and G Orchards (O), Yakima County Fire District 6 Station 2 (P), Yakima County Fire District 6 Station 1 (Q), American Medical Response (R), Yakima Fire Department Station 92 (S), West Valley Fire Rescue Station 3 (T). Display/hide their locations on the map
Shopping Centers: Westpark Shopping Center (1), Meadowbrook Mall (2), Glenwood Shopping Center (3), Chalet Mall Shopping Center (4). Display/hide their locations on the map
Parks in zip code 98908 include: Gilbert Park (1), Lower Naches Community Park (2), Indian Painted Rocks State Park (3). Display/hide their locations on the map
6,080 married couples with children.
2,235 single-parent households (342 men, 1,893 women).
83.1% of residents of 98908 zip code speak English at home.
14.9% of residents speak Spanish at home (68% very well, 17% well, 9% not well, 6% not at all).
1.2% of residents speak other Indo-European language at home (83% very well, 17% well).
0.8% of residents speak Asian or Pacific Island language at home (47% very well, 37% well, 16% not well).
0.1% of residents speak other language at home (17% very well, 83% well).
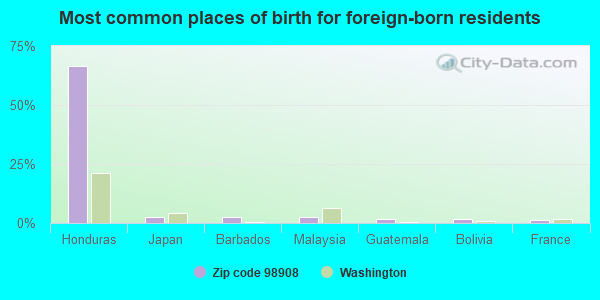
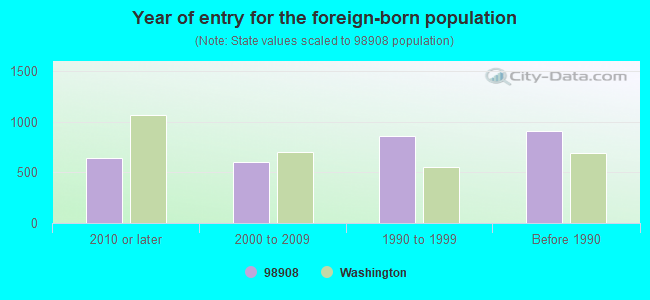
Foreign born population: 2,765 (7.1%) (46.8% of them are naturalized citizens)
Facilities with environmental interests located in this zip code:
CATHOLIC DIOCESE OF YAKIMA (5301 TIETON DR in YAKIMA, WA)
(Resource Conservation and Recovery Act (tracking hazardous waste)) STATE MASTER (Washington State Department of Ecology's Facility/Site identification system) - TOXICS-, UNDERGROUND STORAGE TANK PROGRAM Business SIC classification: NONCLASSIFIABLE ESTABLISHMENTS Alternative names: PASTORIAL CENTER
APPLE VALLEY ELEMENTARY (7 N 88TH AVE in YAKIMA, WA)
(National Center for Education Statistics) - STATE ID-3699 STATE MASTER (Washington State Department of Ecology's Facility/Site identification system) - TOXICS-, INDEPENDENT CLEANUP Organizations: WEST VALLEY SCH DIST 208 (SCHOOL DISTRICT)
Alternative names: APPLE VALLEY ELEMENTARY SCHOOL
CHRISTIES AUTOMOTIVE INC (5812 SUMMITVIEW in YAKIMA, WA)
(Resource Conservation and Recovery Act (tracking hazardous waste)) STATE MASTER (Washington State Department of Ecology's Facility/Site identification system) - TOXICS-11677, UNDERGROUND STORAGE TANK PROGRAM, HAZWASTE-WAD058351172, CESQG Business SIC classification: GENERAL AUTOMOTIVE REPAIR SHOPS Business NAICS classification: GENERAL AUTOMOTIVE REPAIR.; GENERAL AUTOMOTIVE REPAIR. Organizations: BEN CHRISTIE (CONTACT/OPERATOR)
CONKLIN CHEVRON (5604 SUMMITVIEW AVE in YAKIMA, WA)
(Resource Conservation and Recovery Act (tracking hazardous waste)) STATE MASTER (Washington State Department of Ecology's Facility/Site identification system) - HAZWASTE-WAD988489589, EPCRA, TOXICS-5207, UNDERGROUND STORAGE TANK PROGRAM, HAZWASTE-WAD988489589, CESQG Business SIC classification: GASOLINE SERVICE STATIONS; GENERAL AUTOMOTIVE REPAIR SHOPS Organizations: THOMAS CONKLIN (CONTACT/OPERATOR)
, CONKLIN ENTERPRISED DBA CONKLIN CHEVRON (CONTACT/OWNER)
Alternative names: CHEVRON USA 96278, CONKLIN ENTERPRISES DBA CONKLIN CHEVRON
ACKLEY FRUIT COMPANY LLC (5501 W POWERHOUSE RD in YAKIMA, WA)
National Pollutant Discharge Elimination System NON-MAJOR (Tracking pollutant discharge elimination systems) - permit STATE MASTER (Washington State Department of Ecology's Facility/Site identification system) - WATQUAL-WAG435070, NPDES NON-MAJOR Business SIC classification: CROP PREPARATION SERVICES FOR MARKET, EXCEPT COTTON GINNING Organizations: ACKLEY FRUIT CO. LLC (CONTACT/OWNER)
Alternative names: R A ACKLEY, RA ACKLEY
ALLAN BROTHERS GLEED CA (300 ORCHARD RITE RD in YAKIMA, WA)
National Pollutant Discharge Elimination System NON-MAJOR (Tracking pollutant discharge elimination systems) - permit STATE MASTER (Washington State Department of Ecology's Facility/Site identification system) - HAZWASTE-CRK000059350, EPCRA, WATQUAL-WAG435015, NPDES NON-MAJOR Business SIC classification: DAIRY FARMS; CROP PREPARATION SERVICES FOR MARKET, EXCEPT COTTON GINNING Alternative names: YAKIMA VALLEY ORCHARDS INC
CHIEF ORCHARDS W CHESTNUT PLAN (5201 W CHESTNUT AVE in YAKIMA (WRIA 37), WA)
National Pollutant Discharge Elimination System NON-MAJOR (Tracking pollutant discharge elimination systems) - permit Business SIC classification: CROP PREPARATION SERVICES FOR MARKET, EXCEPT COTTON GINNING Alternative names: CHIEF ORCHARDS LLC, GEORGE F JOSEPH ORCHARD
Housing units lacking complete plumbing facilities: 0.3% Housing units lacking complete kitchen facilities: 1.5%
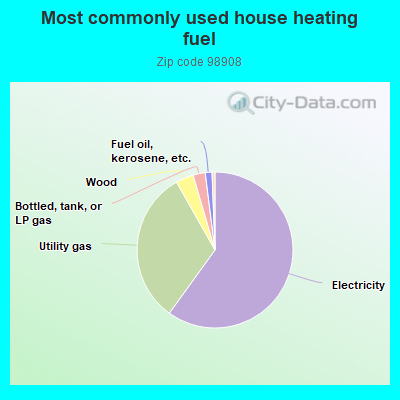
59.9%Electricity
31.8%Utility gas
3.7%Wood
2.5%Bottled, tank, or LP gas
1.4%Fuel oil, kerosene, etc.
Population in 1990: 27,078. Population change in the 1990s: +5,302 (+19.6%).
Place of birth for U.S.-born residents:
This state: 25,279
Northeast: 579
Midwest: 2,473
South: 1,647
West: 5,939
58% of the 98908 zip code residents lived in the same house 5 years ago. Out of people who lived in different houses, 73% lived in this county. Out of people who lived in different counties, 50% lived in Washington.
92% of the 98908 zip code residents lived in the same house 1 year ago. Out of people who lived in different houses, 72% moved from this county. Out of people who lived in different houses, 18% moved from different county within same state. Out of people who lived in different houses, 9% moved from different state. Out of people who lived in different houses, 3% moved from abroad.
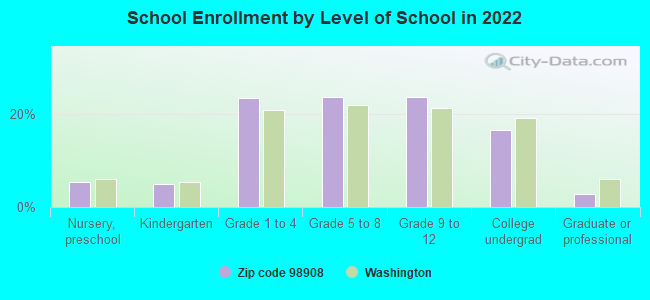
Private vs. public school enrollment:
Students in private schools in grades 1 to 8 (elementary and middle school): 562
Here:
12.8%
Washington:
12.4%
Students in private schools in grades 9 to 12 (high school): 171
Here:
7.8%
Washington:
9.2%
Students in private undergraduate colleges: 174
Here:
11.3%
Washington:
16.5%
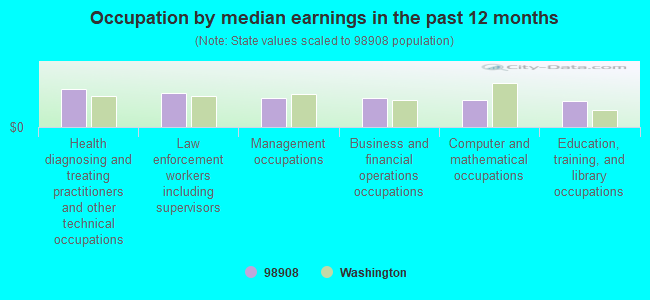
Occupation by median earnings in the past 12 months ($)
106,228Health diagnosing and treating practitioners and other technical occupations
94,931Law enforcement workers including supervisors
81,997Management occupations
80,330Business and financial operations occupations
76,617Computer and mathematical occupations
73,717Education, training, and library occupations
Companies with federal contracts located in this zip code (YAKIMA, WA):
PATRICK, TERRY CONTRACTOR INC (211 N 70TH AVE; small business) : $56,085 in 3 contractsfrom 2003 to 2004
$39,926 with Army for Lumber and Related Basic Wood Materials. Signed on 2003-11-06. Completion date: 2003-11-07.
$10,600 with Army for Purchase of Structures and Facilities -- Other Industrial Buildings. Signed on 2004-08-31. Completion date: 2004-09-07.
$5,559, same as above.Signed on 2004-09-16. Completion date: 2004-09-07.
PACKARD PACKARD PACKARD & SMIT (1501 S 40TH AVE)
$23,640 with Army for Ophthalmic Instruments, Equipment, and Supplies. Signed on 2004-07-30. Completion date: 2004-08-08.
RUSSELL & MICHELE FERGUSON (1103 DAZET RD; small business) : $20,165 in 2 contractsfrom 2003 to 2004
$14,221 with Army for Maintenance, Repair and Rebuilding of Equipment -- Maintenance and Repair Shop Equipment. Signed on 2003-06-13. Completion date: 2003-07-10.
$5,944 with Army for Communications Security Equipment and Components. Signed on 2004-01-29. Completion date: 2004-02-13.
DALE C HOSTETLER (504 ENGLEWOOD PL; small business) : $16,232 in 24 contractsfrom 2002 to 2005
Contracts for Other Professional Services, Chaplain Services by Army Signed by year:2000: $0; 2001: $0; 2002: $420; 2003: $1,823; 2004: $7,989; 2005: $6,000; 2006: $0.
Biggest contracts:
$9,380 with Army for Other Professional Services. Signed on 2005-11-18. Completion date: 2006-09-30.
$6,000, same as above.Signed on 2005-01-14. Completion date: 2005-09-30.
$6,000, same as above.Signed on 2004-12-30. Completion date: 2005-09-30.
$420 with Army for Chaplain Services. Signed on 2002-12-24. Completion date: 2003-01-24.
DARP ENTERPRISES (41 ROCKY TOP RD; small business) : $11,086 in 4 contractsfrom 2003 to 2005
$7,000 with Army for Trash/Garbage Collection Services - Including Portable Sanitation Services. Signed on 2005-08-11. Completion date: 2005-08-31.
$7,000, same as above.Signed on 2004-08-18. Completion date: 2005-08-31.
$0 with Army for Air Quality Support Services. Signed on 2003-02-20. Completion date: 2003-09-30.
-$2,914, same as above.Signed on 2003-02-20. Completion date: 2003-09-30.
Top industries in this zip code by the number of employees in 2005:
2002 - 2018 National Fire Incident Reporting System (NFIRS) incidents
Based on the data from the years 2002 - 2018 the average number of fires per year is 137. The highest number of fire incidents - 206 took place in 2003, and the least - 87 in 2011. The data has an increasing trend.
When looking into fire subcategories, the most reports belonged to: Outside Fires (44.0%), and Structure Fires (37.2%).
Fire incident types reported to NFIRS in Zip Code 98908
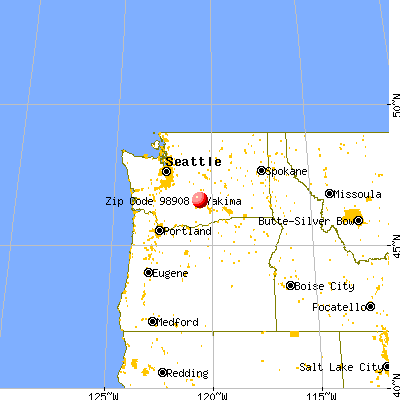


 Nearest zip codes: 98923, 98947, 98902, 98942, 98933, 98952.
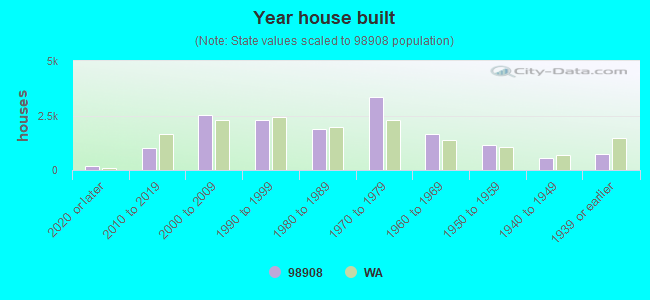


 Based on the data from the years 2002 - 2018 the average number of fires per year is 137. The highest number of fire incidents - 206 took place in 2003, and the least - 87 in 2011. The data has an increasing trend.
 When looking into fire subcategories, the most reports belonged to: Outside Fires (44.0%), and Structure Fires (37.2%).