Estimated zip code population in 2022: 18,275 Zip code population in 2010: 16,973 Zip code population in 2000: 15,328
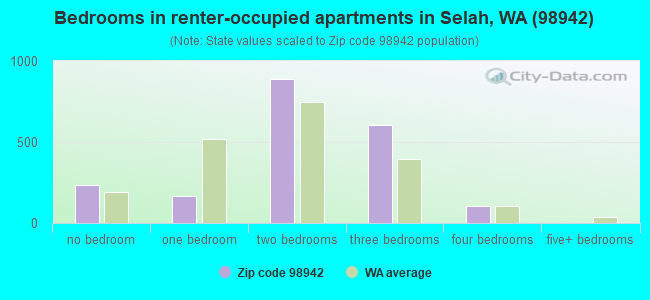
Houses and condos: 7,809 Renter-occupied apartments: 2,016
% of renters here:
27%
State:
36%
March 2022 cost of living index in zip code 98942: 96.6 (near average, U.S. average is 100)
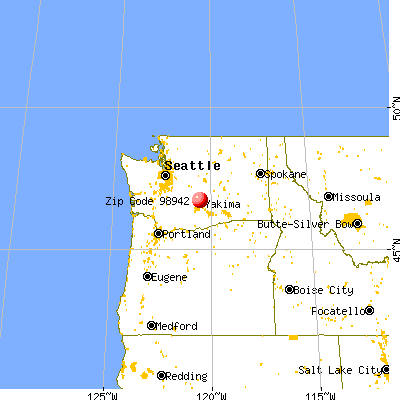
Land area: 188.4 sq. mi. Water area: 0.5 sq. mi.
Population density: 97 people per square mile
(very low).
OSM Map
General Map
Google Map
MSN Map
OSM Map
General Map
Google Map
MSN Map
OSM Map
General Map
Google Map
MSN Map
OSM Map
General Map
Google Map
MSN Map
Please wait while loading the map...
Real estate property taxes paid for housing units in 2022:
This zip code:
0.7% ($2,611)
Washington:
0.8% ($4,283)
Median real estate property taxes paid for housing units with mortgages in 2022: $2,584 (0.6%) Median real estate property taxes paid for housing units with no mortgage in 2022: $2,719 (0.8%)
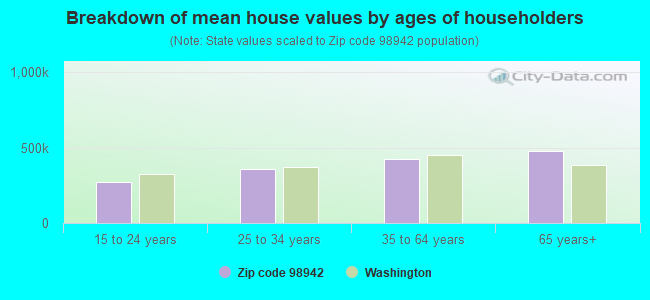
Estimated median house/condo value in 2022: $387,005
98942:
$387,005
Washington:
$569,500
According to our research of Washington and other state lists, there were 7 registered sex offenders living in 98942 zip code as of April 27, 2024. The ratio of all residents to sex offenders in zip code 98942 is 2,466 to 1. The ratio of registered sex offenders to all residents in this zip code is lower than the state average.
Median resident age:
This zip code:
37.7 years
Washington median age:
38.4 years
Average household size:
This zip code:
2.4 people
Washington:
2.5 people
Averages for the 2020 tax year for zip code 98942, filed in 2021:
Average Adjusted Gross Income (AGI) in 2020: $71,897 (Individual Income Tax Returns)
Here:
$71,897
State:
$99,264
Salary/wage: $58,341 (reported on 85.0% of returns)
Here:
$58,341
State:
$80,347
(% of AGI for various income ranges: 1403.9% for AGIs below $25k, 3633.4% for AGIs $25k-50k, 6208.8% for AGIs $50k-75k, 9114.2% for AGIs $75k-100k, 17390.3% for AGIs $100k-200k, 64415.5% for AGIs over 200k)
Taxable interest for individuals: $3,369 (reported on 23.9% of returns)
This zip code:
$3,369
Washington:
$2,077
(% of AGI for various income ranges: 16.2% for AGIs below $25k, 18.8% for AGIs $25k-50k, 33.4% for AGIs $50k-75k, 41.5% for AGIs $75k-100k, 196.6% for AGIs $100k-200k, 3836.4% for AGIs over 200k)
Ordinary dividends: $8,128 (reported on 14.2% of returns)
Here:
$8,128
State:
$10,013
(% of AGI for various income ranges: 20.2% for AGIs below $25k, 19.9% for AGIs $25k-50k, 55.2% for AGIs $50k-75k, 85.9% for AGIs $75k-100k, 208.2% for AGIs $100k-200k, 6001.8% for AGIs over 200k)
Net capital gain/loss in AGI: +$21,322 (reported on 13.9% of returns)
Here:
+$21,322
State:
+$40,092
(% of AGI for various income ranges: 13.0% for AGIs below $25k, 25.5% for AGIs $25k-50k, 67.2% for AGIs $50k-75k, 115.5% for AGIs $75k-100k, 436.6% for AGIs $100k-200k, 18539.1% for AGIs over 200k)
Profit/loss from business: +$18,591 (reported on 10.3% of returns)
Here:
+$18,591
State:
+$18,312
(% of AGI for various income ranges: 46.1% for AGIs below $25k, 54.3% for AGIs $25k-50k, 123.5% for AGIs $50k-75k, 180.1% for AGIs $75k-100k, 449.8% for AGIs $100k-200k, 8010.0% for AGIs over 200k)
Taxable individual retirement arrangement distribution: $21,273 (reported on 7.8% of returns)
98942:
$21,273
Washington:
$24,221
(% of AGI for various income ranges: 56.9% for AGIs below $25k, 67.5% for AGIs $25k-50k, 180.0% for AGIs $50k-75k, 287.5% for AGIs $75k-100k, 678.6% for AGIs $100k-200k, 2554.5% for AGIs over 200k)
Self-employed (Keogh) retirement plans: $33,550 (reported on 0.2% of returns)
98942:
$33,550
Washington:
$24,166
(% of AGI for various income ranges: 610.0% for AGIs over 200k)
Total itemized deductions: $32,737 (reported on 5.4% of returns)
Here:
$32,737
State:
$39,068
(% of AGI for various income ranges: 37.6% for AGIs below $25k, 78.8% for AGIs $25k-50k, 201.4% for AGIs $50k-75k, 248.7% for AGIs $75k-100k, 580.2% for AGIs $100k-200k, 4245.5% for AGIs over 200k)
Charity contributions: $12,900 (reported on 3.7% of returns)
Here:
$12,900
State:
$15,331
(% of AGI for various income ranges: 11.8% for AGIs $25k-50k, 30.3% for AGIs $50k-75k, 41.7% for AGIs $75k-100k, 149.5% for AGIs $100k-200k, 1921.8% for AGIs over 200k)
Taxes paid: $6,636 (reported on 5.3% of returns)
98942:
$6,636
State:
$7,774
(% of AGI for various income ranges: 5.8% for AGIs below $25k, 11.4% for AGIs $25k-50k, 37.1% for AGIs $50k-75k, 52.3% for AGIs $75k-100k, 123.2% for AGIs $100k-200k, 883.6% for AGIs over 200k)
Earned income credit: $2,086 (reported on 13.1% of returns)
Here:
$2,086
State:
$2,020
(% of AGI for various income ranges: 73.7% for AGIs below $25k, 64.2% for AGIs $25k-50k, 1.9% for AGIs $50k-75k)
Percentage of individuals using paid preparers for their 2020 taxes: 93.3%
Here:
93%
State:
93%
(% for various income ranges: 90.9% for AGIs below $25k, 94.0% for AGIs $25k-50k, 95.6% for AGIs $50k-75k, 93.8% for AGIs $75k-100k, 93.2% for AGIs $100k-200k, 94.9% for AGIs over 200k)
Averages for the 2012 tax year for zip code 98942, filed in 2013:
Average Adjusted Gross Income (AGI) in 2012: $58,552 (Individual Income Tax Returns)
Here:
$58,552
State:
$69,533
Salary/wage: $47,921 (reported on 86.2% of returns)
Here:
$47,921
State:
$57,267
(% of AGI for various income ranges: 77.1% for AGIs below $25k, 81.3% for AGIs $25k-50k, 79.2% for AGIs $50k-75k, 79.5% for AGIs $75k-100k, 78.5% for AGIs $100k-200k, 35.2% for AGIs over 200k)
Taxable interest for individuals: $2,735 (reported on 28.1% of returns)
This zip code:
$2,735
Washington:
$1,816
(% of AGI for various income ranges: 1.2% for AGIs below $25k, 0.5% for AGIs $25k-50k, 0.6% for AGIs $50k-75k, 0.8% for AGIs $75k-100k, 1.1% for AGIs $100k-200k, 3.3% for AGIs over 200k)
Ordinary dividends: $8,539 (reported on 15.4% of returns)
Here:
$8,539
State:
$8,163
(% of AGI for various income ranges: 1.0% for AGIs below $25k, 0.6% for AGIs $25k-50k, 0.7% for AGIs $50k-75k, 0.7% for AGIs $75k-100k, 1.0% for AGIs $100k-200k, 8.1% for AGIs over 200k)
Net capital gain/loss in AGI: +$7,537 (reported on 12.2% of returns)
Here:
+$7,537
State:
+$21,568
(% of AGI for various income ranges: 0.2% for AGIs $25k-50k, 0.5% for AGIs $50k-75k, 0.7% for AGIs $75k-100k, 1.4% for AGIs $100k-200k, 5.1% for AGIs over 200k)
Profit/loss from business: +$13,831 (reported on 12.4% of returns)
Here:
+$13,831
State:
+$16,521
(% of AGI for various income ranges: 5.1% for AGIs below $25k, 1.7% for AGIs $25k-50k, 1.9% for AGIs $50k-75k, 2.1% for AGIs $75k-100k, 2.9% for AGIs $100k-200k, 4.6% for AGIs over 200k)
Taxable individual retirement arrangement distribution: $13,570 (reported on 9.2% of returns)
98942:
$13,570
Washington:
$18,648
(% of AGI for various income ranges: 2.6% for AGIs below $25k, 2.0% for AGIs $25k-50k, 2.1% for AGIs $50k-75k, 2.7% for AGIs $75k-100k, 2.7% for AGIs $100k-200k, 0.9% for AGIs over 200k)
Self-employment retirement plans: $22,233 (reported on 0.4% of returns)
98942:
$22,233
Washington:
$20,087
(% of AGI for various income ranges: 0.6% for AGIs $100k-200k)
Total itemized deductions: $19,468 (18% of AGI, reported on 29.3% of returns)
Here:
$19,468
State:
$23,872
Here:
17.8% of AGI
State:
18.2% of AGI
(% of AGI for various income ranges: 7.5% for AGIs below $25k, 8.8% for AGIs $25k-50k, 10.8% for AGIs $50k-75k, 11.3% for AGIs $75k-100k, 12.4% for AGIs $100k-200k, 5.9% for AGIs over 200k)
Charity contributions: $3,675 (reported on 21.6% of returns)
Here:
$3,675
State:
$4,465
(% of AGI for various income ranges: 0.5% for AGIs below $25k, 0.8% for AGIs $25k-50k, 1.1% for AGIs $50k-75k, 1.5% for AGIs $75k-100k, 1.9% for AGIs $100k-200k, 1.5% for AGIs over 200k)
Taxes paid: $4,923 (reported on 28.8% of returns)
98942:
$4,923
State:
$6,400
(% of AGI for various income ranges: 1.5% for AGIs below $25k, 1.9% for AGIs $25k-50k, 2.5% for AGIs $50k-75k, 2.8% for AGIs $75k-100k, 3.2% for AGIs $100k-200k, 1.8% for AGIs over 200k)
Earned income credit: $2,235 (reported on 17.3% of returns)
Here:
$2,235
State:
$2,073
(% of AGI for various income ranges: 6.3% for AGIs below $25k, 1.2% for AGIs $25k-50k)
Percentage of individuals using paid preparers for their 2012 taxes: 47.1%
Here:
47%
State:
43%
(% for various income ranges: 41.0% for AGIs below $25k, 47.3% for AGIs $25k-50k, 47.6% for AGIs $50k-75k, 48.2% for AGIs $75k-100k, 57.1% for AGIs $100k-200k, 83.3% for AGIs over 200k)
Averages for the 2004 tax year for zip code 98942, filed in 2005:
Average Adjusted Gross Income (AGI) in 2004: $44,894 (Individual Income Tax Returns)
Here:
$44,894
State:
$54,331
Salary/wage: $39,622 (reported on 87.4% of returns)
Here:
$39,622
State:
$45,761
(% of AGI for various income ranges: 214.0% for AGIs below $10k, 78.1% for AGIs $10k-25k, 82.7% for AGIs $25k-50k, 86.1% for AGIs $50k-75k, 82.2% for AGIs $75k-100k, 58.3% for AGIs over 100k)
Taxable interest for individuals: $2,526 (reported on 42.4% of returns)
This zip code:
$2,526
Washington:
$2,110
(% of AGI for various income ranges: 18.9% for AGIs below $10k, 2.3% for AGIs $10k-25k, 1.4% for AGIs $25k-50k, 1.2% for AGIs $50k-75k, 1.3% for AGIs $75k-100k, 4.2% for AGIs over 100k)
Taxable dividends: $2,102 (reported on 19.0% of returns)
Here:
$2,102
State:
$5,879
(% of AGI for various income ranges: 6.0% for AGIs below $10k, 0.9% for AGIs $10k-25k, 0.6% for AGIs $25k-50k, 0.5% for AGIs $50k-75k, 0.8% for AGIs $75k-100k, 1.4% for AGIs over 100k)
Net capital gain/loss: +$6,128 (reported on 16.8% of returns)
Here:
+$6,128
State:
+$15,835
(% of AGI for various income ranges: -1.2% for AGIs below $10k, 0.6% for AGIs $10k-25k, 0.6% for AGIs $25k-50k, 0.9% for AGIs $50k-75k, 1.3% for AGIs $75k-100k, 5.8% for AGIs over 100k)
Profit/loss from business: +$11,667 (reported on 14.1% of returns)
Here:
+$11,667
State:
+$13,994
(% of AGI for various income ranges: -9.0% for AGIs below $10k, 3.5% for AGIs $10k-25k, 3.3% for AGIs $25k-50k, 1.7% for AGIs $50k-75k, 3.6% for AGIs $75k-100k, 6.0% for AGIs over 100k)
IRA payment deduction: $3,056 (reported on 2.3% of returns)
98942:
$3,056
Washington:
$3,001
(% of AGI for various income ranges: 0.1% for AGIs $10k-25k, 0.2% for AGIs $25k-50k, 0.2% for AGIs $50k-75k, 0.1% for AGIs $75k-100k, 0.1% for AGIs over 100k)
Self-employed pension: $11,625 (reported on 0.5% of returns)
Here:
$11,625
Washington:
$14,244
Total itemized deductions: $16,428 (22% of AGI, reported on 31.8% of returns)
Here:
$16,428
State:
$19,669
Here:
21.9% of AGI
State:
20.7% of AGI
(% of AGI for various income ranges: 22.3% for AGIs below $10k, 10.1% for AGIs $10k-25k, 10.5% for AGIs $25k-50k, 12.9% for AGIs $50k-75k, 13.5% for AGIs $75k-100k, 10.4% for AGIs over 100k)
Charity contributions deductions: $2,736 (3% of AGI, reported on 25.7% of returns)
Here:
$2,736
State:
$3,569
Here:
3.4% of AGI
State:
3.5% of AGI
(% of AGI for various income ranges: 0.7% for AGIs below $10k, 0.9% for AGIs $10k-25k, 1.1% for AGIs $25k-50k, 1.5% for AGIs $50k-75k, 1.8% for AGIs $75k-100k, 2.0% for AGIs over 100k)
Total tax: $6,428 (reported on 73.9% of returns)
98942:
$6,428
State:
$9,065
(% of AGI for various income ranges: 5.6% for AGIs below $10k, 3.6% for AGIs $10k-25k, 6.2% for AGIs $25k-50k, 8.1% for AGIs $50k-75k, 10.1% for AGIs $75k-100k, 18.2% for AGIs over 100k)
Earned income credit: $1,664 (reported on 15.1% of returns)
Here:
$1,664
State:
$1,607
Percentage of individuals using paid preparers for their 2004 taxes: 54.2%
Here:
54%
State:
49%
(% for various income ranges: 46.1% for AGIs below $10k, 56.1% for AGIs $10k-25k, 54.4% for AGIs $25k-50k, 55.9% for AGIs $50k-75k, 54.5% for AGIs $75k-100k, 63.5% for AGIs over 100k)
Household received Food Stamps/SNAP in the past 12 months: 900 Household did not receive Food Stamps/SNAP in the past 12 months: 6,509
Women who had a birth in the past 12 months: 209 (149 now married, 57 unmarried) Women who did not have a birth in the past 12 months: 4,120 (2,126 now married, 1,985 unmarried)
Housing units in zip code 98942 with a mortgage: 3,841 (329 second mortgage, 218 both second mortgage and home equity loan) Houses without a mortgage: 10
Median monthly owner costs for units with a mortgage: $1,692 Median monthly owner costs for units without a mortgage: $584
Residents with income below the poverty level in 2022:
This zip code:
7.7%
Whole state:
10.0%
Residents with income below 50% of the poverty level in 2022:
This zip code:
4.4%
Whole state:
4.6%
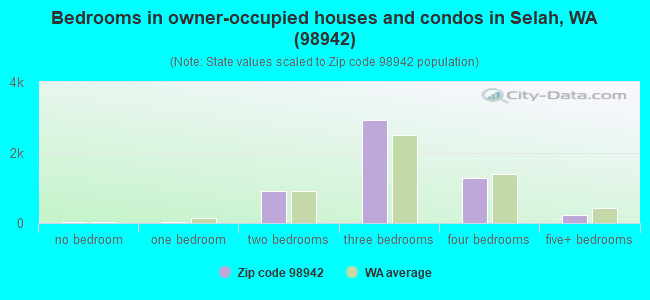
Median number of rooms in houses and condos:
Here:
6.4
State:
6.5
Median number of rooms in apartments:
Here:
4.3
State:
3.9
Notable locations in this zip code not listed on our city pages
Notable locations in zip code 98942: Elks Golf and Country Club (A), Selah Heights (B), Wenas Camp (C), The Cottonwoods (D), Wenas Valley Grange (E), Yakima County Fire District 2 Selah Fire Department Station 6 (F), Yakima County Fire District 2 Selah Fire Department Station 4 (G), Selah Fire Department (H). Display/hide their locations on the map
Parks in zip code 98942 include: Carlon Park (1), Wixon Park (2), Palm Park (3), Legion Park (4), L T Murray State Wildlife Recreation Area (5), Oak Creek State Wildlife Area (6). Display/hide their locations on the map
In group quarters: 252 (-1 institutionalized population)
Size of family households: 2,426 2-persons, 1,248 3-persons, 858 4-persons, 395 5-persons, 267 6-persons, 6 7-or-more-persons
Size of nonfamily households: 1,813 1-person, 337 2-persons, 23 3-persons
2,909 married couples with children.
977 single-parent households (158 men, 819 women).
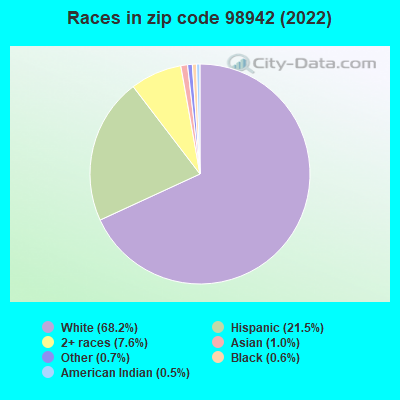
79.6% of residents of 98942 zip code speak English at home.
19.2% of residents speak Spanish at home (71% very well, 14% well, 7% not well, 7% not at all).
0.6% of residents speak other Indo-European language at home (38% very well, 59% well, 3% not well).
0.5% of residents speak Asian or Pacific Island language at home (100% very well).
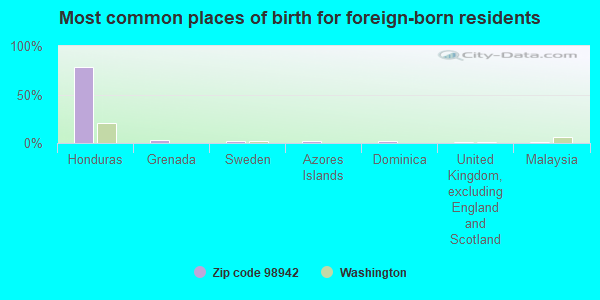
Foreign born population: 1,777 (9.7%) (56.3% of them are naturalized citizens)
This zip code:
9.7%
Whole state:
15.3%
78%Honduras
3%Grenada
2%Sweden
2%Azores Islands
2%Dominica
1%United Kingdom, excluding England and Scotland
1%Malaysia
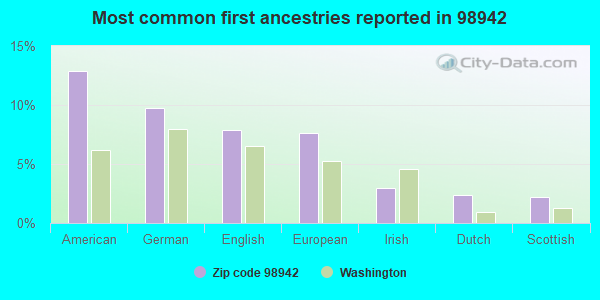
13%American
10%German
8%English
8%European
3%Irish
2%Dutch
2%Scottish
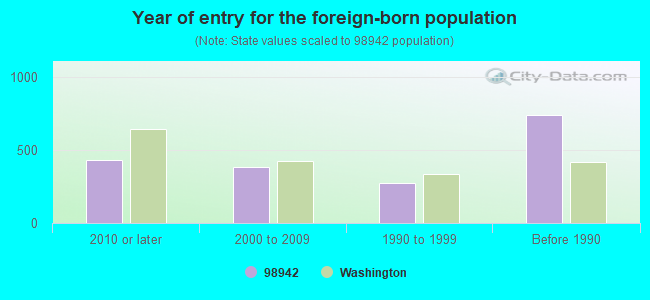
Year of entry for the foreign-born population
4312010 or later
3812000 to 2009
2721990 to 1999
738Before 1990
Facilities with environmental interests located in this zip code:
COMET TRAILER CORPORATION (501 S. 1ST ST. in SELAH, WA)
(Integrated Compliance Information System) - ICIS-10-1993-0113, FORMAL ENFORCEMENT ACTION COMPLIANCE ACTIVITY (Tracking inspections of insecticide, fungicide, and rodenticide, and toxic substances) (Resource Conservation and Recovery Act (tracking hazardous waste)) TRI REPORTER (Tracking of toxic chemicals releasing facilities) STATE MASTER (Washington State Department of Ecology's Facility/Site identification system) - HAZWASTE-WAD980979587, HAZARDOUS WASTE PROGRAM, TOXICS-, GROUND WATER PROGRAM, HAZWASTE-WAD980979587, EPCRA, TRI REPORTER Business SIC classification: TRUCK TRAILERS Business NAICS classification: TRUCK TRAILER MANUFACTURING. Alternative names: OLD SELAH DUMP
CENTRAL PRE MIX SELAH (60 POND RD in SELAH, WA)
National Pollutant Discharge Elimination System NON-MAJOR (Tracking pollutant discharge elimination systems) - permit STATE MASTER (Washington State Department of Ecology's Facility/Site identification system) - WATQUAL-WAG505068, National Pollutant Discharge Elimination System Permit Business SIC classification: CONSTRUCTION SAND AND GRAVEL Organizations: CENTRAL PRE MIX CONCRETE CO (CONTACT/OWNER)
Housing units lacking complete plumbing facilities: 0.6% Housing units lacking complete kitchen facilities: 1.2%
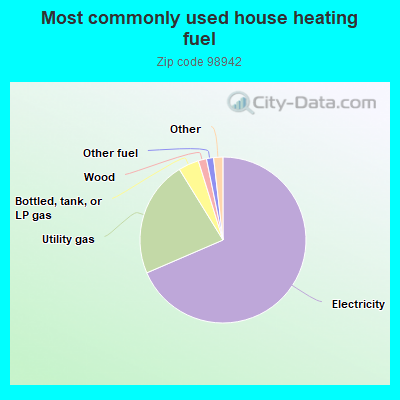
68.6%Electricity
22.7%Utility gas
4.0%Bottled, tank, or LP gas
1.6%Wood
1.4%Other fuel
0.8%Fuel oil, kerosene, etc.
0.7%No fuel used
Population in 1990: 12,507. Population change in the 1990s: +2,821 (+22.6%).
Place of birth for U.S.-born residents:
This state: 12,057
Northeast: 221
Midwest: 759
South: 762
West: 2,559
55% of the 98942 zip code residents lived in the same house 5 years ago. Out of people who lived in different houses, 72% lived in this county. Out of people who lived in different counties, 50% lived in Washington.
88% of the 98942 zip code residents lived in the same house 1 year ago. Out of people who lived in different houses, 60% moved from this county. Out of people who lived in different houses, 27% moved from different county within same state. Out of people who lived in different houses, 6% moved from different state. Out of people who lived in different houses, 5% moved from abroad.
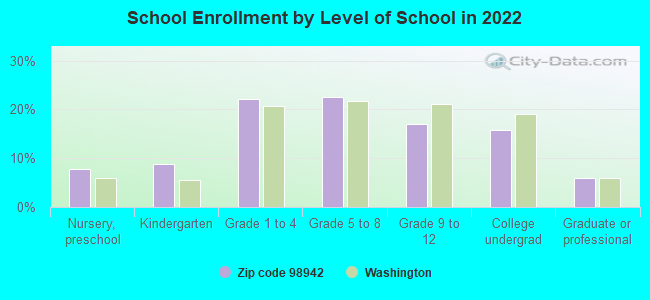
Private vs. public school enrollment:
Students in private schools in grades 1 to 8 (elementary and middle school): 149
Here:
7.6%
Washington:
12.4%
Students in private schools in grades 9 to 12 (high school):
Here:
0.0%
Washington:
9.2%
Students in private undergraduate colleges: 142
Here:
20.4%
Washington:
16.5%
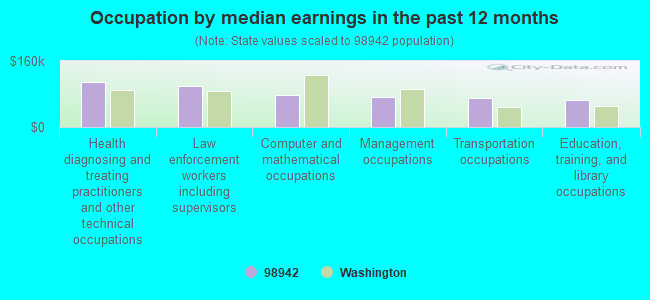
Occupation by median earnings in the past 12 months ($)
109,342Health diagnosing and treating practitioners and other technical occupations
98,519Law enforcement workers including supervisors
78,440Computer and mathematical occupations
73,078Management occupations
70,345Transportation occupations
65,151Education, training, and library occupations
Companies with federal contracts located in this zip code (SELAH, WA):
TREE TOP, INC (220 E 2ND AVE) : $13,683,120 in 47 contractsfrom 1999 to 2006
Contracts for Non-Food Items For Resale, Food Items For Resale, Fruits and Vegetables, Services -- Management and Support (R&D) by Defense Commissary Agency, Agricultural Marketing Service (disused code), Department of Defense, Agricultural Marketing Service, and others Signed by year:2000: $456,098; 2001: $1,347,955; 2002: $1,248,560; 2003: $449,630; 2004: $2,201,459; 2005: $5,523,102; 2006: $2,284,058.
Biggest contracts:
$2,054,053 with Defense Commissary Agency for Non-Food Items For Resale. Signed on 2006-01-01. Completion date: 2006-03-31.
$1,767,688 with Defense Commissary Agency for Food Items For Resale. Signed on 2005-04-01. Completion date: 2005-09-30.
$1,659,441, same as above.Signed on 2004-10-01. Completion date: 2005-02-28.
$1,324,559 with Defense Commissary Agency for Non-Food Items For Resale. Signed on 2005-10-01. Completion date: 2005-12-31.
ABLE CONTRACTING, LLC (1012 GOODLANDER DR) : $234,437 in 10 contractsfrom 2004 to 2005
Contracts for Maintenance, Repair or Alteration of Real Property -- Restoration of real property, Construction -- Basic Research (R&D), Maintenance, Repair or Alteration of Real Property -- Other Administrative Facilities and Service Buildings by Army, U.S. Army Corps of Engineers - civil program financing only, Public Health Service, Indian Health Service, and others Signed by year:2000: $0; 2001: $0; 2002: $0; 2003: $0; 2004: $27,724; 2005: $206,713; 2006: $0.
Biggest contracts:
$81,580 with Army for Maintenance, Repair or Alteration of Real Property -- Restoration of real property. Signed on 2005-02-28. Completion date: 2005-04-30.
$81,580 with U.S. Army Corps of Engineers - civil program financing only for Maintenance, Repair or Alteration of Real Property -- Restoration of real property. Signed on 2005-02-28. Completion date: 2005-04-30.
$37,290 with Army for Maintenance, Repair or Alteration of Real Property -- Restoration of real property. Signed on 2005-03-22. Completion date: 2005-04-30.
$37,290 with U.S. Army Corps of Engineers - civil program financing only for Maintenance, Repair or Alteration of Real Property -- Restoration of real property. Signed on 2005-03-22. Completion date: 2005-04-30.
CASCADE VEGETATION MANAGEMENT (1012 GOODLANDER DR; small business) : $128,569 in 10 contractsfrom 2001 to 2006
Contracts for Pesticides Support Services, Water Quality Support Services, Landscaping/Groundskeeping Services, Site Preparation by Army Signed by year:2000: $0; 2001: $59,547; 2002: $0; 2003: $0; 2004: $33,026; 2005: $9,996; 2006: $26,000.
Biggest contracts:
$59,547 with Army for Pesticides Support Services. Signed on 2001-05-17. Completion date: 2001-09-25.
$25,500 with Army for Water Quality Support Services. Signed on 2006-02-07. Completion date: 2006-04-01.
$17,076 with Army for Landscaping/Groundskeeping Services. Signed on 2004-09-29. Completion date: 2005-05-31.
$9,996, same as above.Signed on 2005-09-29. Completion date: 2005-11-04.
PATNODE, RONALD J (1112 W FREMONT AVE; small business)
$4,950 with Army for Chaplain Services. Signed on 2004-11-16. Completion date: 2005-09-30.
PATNODE, RONALD J (1112 W FREMONT AVE; small business) : $0 in 3 contractsin 2005
$5,470 with Army for Other Professional Services. Signed on 2005-12-02. Completion date: 2006-09-30.
$0, same as above.Signed on 2005-12-02. Completion date: 2006-09-30.
-$5,470, same as above.Signed on 2005-12-12. Completion date: 2006-09-30.
Top industries in this zip code by the number of employees in 2005:
Wholesale Trade: Other Grocery and Related Products Merchant Wholesalers (250-499 employees: 1 establishment)
2002 - 2018 National Fire Incident Reporting System (NFIRS) incidents
Based on the data from the years 2002 - 2018 the average number of fire incidents per year is 97. The highest number of reported fire incidents - 134 took place in 2009, and the least - 62 in 2016. The data has a rising trend.
When looking into fire subcategories, the most reports belonged to: Outside Fires (47.9%), and Structure Fires (35.9%).
Fire incident types reported to NFIRS in Zip Code 98942


 Nearest zip codes: 98923, 98947, 98908, 98902, 98901, 98946.


 Based on the data from the years 2002 - 2018 the average number of fire incidents per year is 97. The highest number of reported fire incidents - 134 took place in 2009, and the least - 62 in 2016. The data has a rising trend.
 When looking into fire subcategories, the most reports belonged to: Outside Fires (47.9%), and Structure Fires (35.9%).