Estimated zip code population in 2022: 58,907 Zip code population in 2010: 49,193 Zip code population in 2000: 34,581
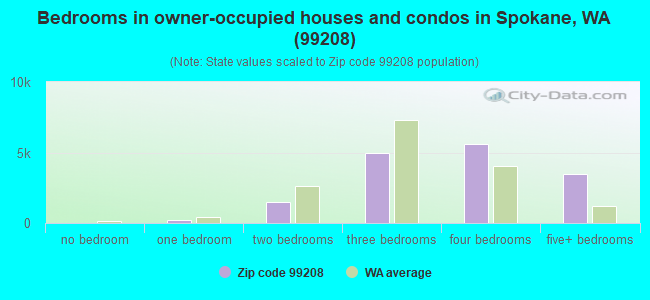
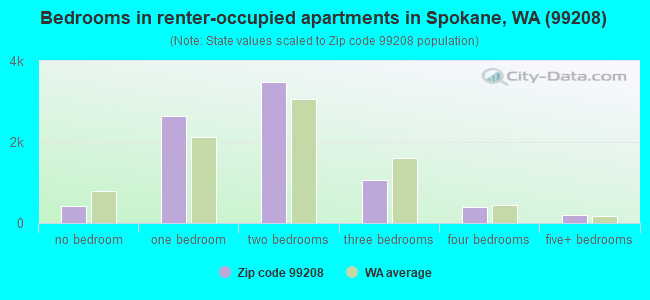
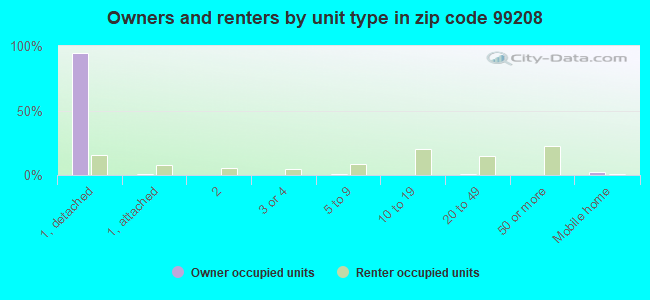
Houses and condos: 24,760 Renter-occupied apartments: 8,170
% of renters here:
34%
State:
36%
March 2022 cost of living index in zip code 99208: 95.5 (near average, U.S. average is 100)
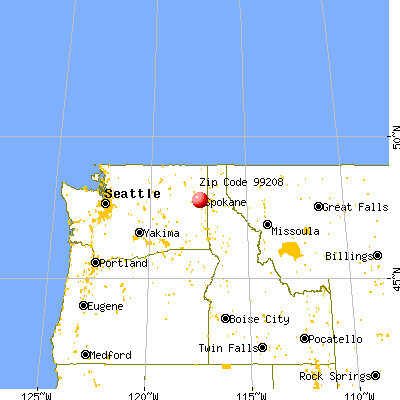
Land area: 49.2 sq. mi. Water area: 0.1 sq. mi.
Population density: 1,198 people per square mile
(low).
OSM Map
General Map
Google Map
MSN Map
OSM Map
General Map
Google Map
MSN Map
OSM Map
General Map
Google Map
MSN Map
OSM Map
General Map
Google Map
MSN Map
Please wait while loading the map...
Real estate property taxes paid for housing units in 2022:
This zip code:
0.8% ($3,388)
Washington:
0.8% ($4,283)
Median real estate property taxes paid for housing units with mortgages in 2022: $3,426 (0.7%) Median real estate property taxes paid for housing units with no mortgage in 2022: $3,330 (0.8%)
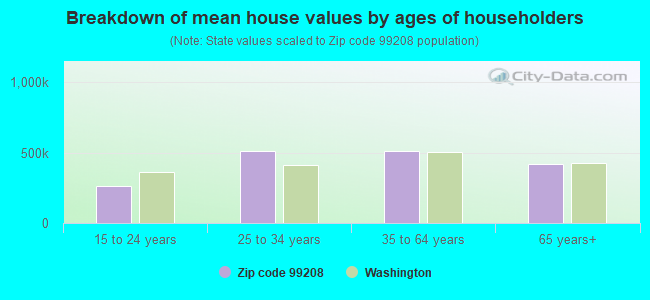
Estimated median house/condo value in 2022: $451,245
99208:
$451,245
Washington:
$569,500
According to our research of Washington and other state lists, there were 21 registered sex offenders living in 99208 zip code as of April 26, 2024. The ratio of all residents to sex offenders in zip code 99208 is 2,527 to 1. The ratio of registered sex offenders to all residents in this zip code is lower than the state average.
Median resident age:
This zip code:
40.8 years
Washington median age:
38.4 years
Average household size:
This zip code:
2.5 people
Washington:
2.5 people
Averages for the 2020 tax year for zip code 99208, filed in 2021:
Average Adjusted Gross Income (AGI) in 2020: $76,229 (Individual Income Tax Returns)
Here:
$76,229
State:
$99,264
Salary/wage: $61,288 (reported on 80.6% of returns)
Here:
$61,288
State:
$80,347
(% of AGI for various income ranges: 1149.1% for AGIs below $25k, 3303.8% for AGIs $25k-50k, 5901.9% for AGIs $50k-75k, 8500.6% for AGIs $75k-100k, 17162.4% for AGIs $100k-200k, 59952.7% for AGIs over 200k)
Taxable interest for individuals: $1,584 (reported on 39.4% of returns)
This zip code:
$1,584
Washington:
$2,077
(% of AGI for various income ranges: 19.6% for AGIs below $25k, 26.1% for AGIs $25k-50k, 45.6% for AGIs $50k-75k, 68.5% for AGIs $75k-100k, 155.5% for AGIs $100k-200k, 1559.6% for AGIs over 200k)
Ordinary dividends: $6,265 (reported on 19.7% of returns)
Here:
$6,265
State:
$10,013
(% of AGI for various income ranges: 28.9% for AGIs below $25k, 36.3% for AGIs $25k-50k, 91.3% for AGIs $50k-75k, 147.7% for AGIs $75k-100k, 290.8% for AGIs $100k-200k, 3436.5% for AGIs over 200k)
Net capital gain/loss in AGI: +$21,600 (reported on 18.9% of returns)
Here:
+$21,600
State:
+$40,092
(% of AGI for various income ranges: 10.9% for AGIs below $25k, 27.1% for AGIs $25k-50k, 95.2% for AGIs $50k-75k, 161.6% for AGIs $75k-100k, 589.8% for AGIs $100k-200k, 18007.7% for AGIs over 200k)
Profit/loss from business: +$18,928 (reported on 12.3% of returns)
Here:
+$18,928
State:
+$18,312
(% of AGI for various income ranges: 66.3% for AGIs below $25k, 120.1% for AGIs $25k-50k, 226.8% for AGIs $50k-75k, 324.4% for AGIs $75k-100k, 580.0% for AGIs $100k-200k, 5024.8% for AGIs over 200k)
Taxable individual retirement arrangement distribution: $21,431 (reported on 10.8% of returns)
99208:
$21,431
Washington:
$24,221
(% of AGI for various income ranges: 64.2% for AGIs below $25k, 100.4% for AGIs $25k-50k, 259.2% for AGIs $50k-75k, 453.1% for AGIs $75k-100k, 841.6% for AGIs $100k-200k, 2941.9% for AGIs over 200k)
Self-employed (Keogh) retirement plans: $22,710 (reported on 0.4% of returns)
99208:
$22,710
Washington:
$24,166
(% of AGI for various income ranges: 20.5% for AGIs $100k-200k, 355.4% for AGIs over 200k)
Total itemized deductions: $36,181 (reported on 6.9% of returns)
Here:
$36,181
State:
$39,068
(% of AGI for various income ranges: 47.0% for AGIs below $25k, 72.9% for AGIs $25k-50k, 212.7% for AGIs $50k-75k, 313.6% for AGIs $75k-100k, 754.6% for AGIs $100k-200k, 5934.0% for AGIs over 200k)
Charity contributions: $15,007 (reported on 5.6% of returns)
Here:
$15,007
State:
$15,331
(% of AGI for various income ranges: 3.7% for AGIs below $25k, 9.6% for AGIs $25k-50k, 30.4% for AGIs $50k-75k, 63.6% for AGIs $75k-100k, 202.9% for AGIs $100k-200k, 3031.7% for AGIs over 200k)
Taxes paid: $7,034 (reported on 6.8% of returns)
99208:
$7,034
State:
$7,774
(% of AGI for various income ranges: 7.2% for AGIs below $25k, 12.4% for AGIs $25k-50k, 43.8% for AGIs $50k-75k, 69.2% for AGIs $75k-100k, 167.8% for AGIs $100k-200k, 985.6% for AGIs over 200k)
Earned income credit: $2,148 (reported on 12.3% of returns)
Here:
$2,148
State:
$2,020
(% of AGI for various income ranges: 65.9% for AGIs below $25k, 59.7% for AGIs $25k-50k, 1.5% for AGIs $50k-75k)
Percentage of individuals using paid preparers for their 2020 taxes: 93.9%
Here:
94%
State:
93%
(% for various income ranges: 93.0% for AGIs below $25k, 94.5% for AGIs $25k-50k, 93.9% for AGIs $50k-75k, 93.5% for AGIs $75k-100k, 93.9% for AGIs $100k-200k, 95.1% for AGIs over 200k)
Averages for the 2012 tax year for zip code 99208, filed in 2013:
Average Adjusted Gross Income (AGI) in 2012: $58,273 (Individual Income Tax Returns)
Here:
$58,273
State:
$69,533
Salary/wage: $48,622 (reported on 81.8% of returns)
Here:
$48,622
State:
$57,267
(% of AGI for various income ranges: 73.3% for AGIs below $25k, 75.1% for AGIs $25k-50k, 71.4% for AGIs $50k-75k, 73.7% for AGIs $75k-100k, 74.3% for AGIs $100k-200k, 44.5% for AGIs over 200k)
Taxable interest for individuals: $1,527 (reported on 39.8% of returns)
This zip code:
$1,527
Washington:
$1,816
(% of AGI for various income ranges: 1.5% for AGIs below $25k, 1.0% for AGIs $25k-50k, 0.9% for AGIs $50k-75k, 0.7% for AGIs $75k-100k, 0.8% for AGIs $100k-200k, 1.7% for AGIs over 200k)
Ordinary dividends: $4,706 (reported on 21.6% of returns)
Here:
$4,706
State:
$8,163
(% of AGI for various income ranges: 2.5% for AGIs below $25k, 1.3% for AGIs $25k-50k, 1.4% for AGIs $50k-75k, 1.0% for AGIs $75k-100k, 1.2% for AGIs $100k-200k, 3.6% for AGIs over 200k)
Net capital gain/loss in AGI: +$8,076 (reported on 17.0% of returns)
Here:
+$8,076
State:
+$21,568
(% of AGI for various income ranges: 0.2% for AGIs $25k-50k, 0.5% for AGIs $50k-75k, 0.7% for AGIs $75k-100k, 1.7% for AGIs $100k-200k, 8.8% for AGIs over 200k)
Profit/loss from business: +$16,011 (reported on 12.4% of returns)
Here:
+$16,011
State:
+$16,521
(% of AGI for various income ranges: 4.4% for AGIs below $25k, 2.8% for AGIs $25k-50k, 2.7% for AGIs $50k-75k, 2.5% for AGIs $75k-100k, 3.1% for AGIs $100k-200k, 5.3% for AGIs over 200k)
Taxable individual retirement arrangement distribution: $15,157 (reported on 11.7% of returns)
99208:
$15,157
Washington:
$18,648
(% of AGI for various income ranges: 3.6% for AGIs below $25k, 2.4% for AGIs $25k-50k, 3.2% for AGIs $50k-75k, 3.1% for AGIs $75k-100k, 3.4% for AGIs $100k-200k, 2.6% for AGIs over 200k)
Self-employment retirement plans: $21,533 (reported on 0.5% of returns)
99208:
$21,533
Washington:
$20,087
(% of AGI for various income ranges: 0.2% for AGIs $50k-75k, 0.1% for AGIs $100k-200k, 0.7% for AGIs over 200k)
Total itemized deductions: $20,903 (20% of AGI, reported on 31.1% of returns)
Here:
$20,903
State:
$23,872
Here:
19.9% of AGI
State:
18.2% of AGI
(% of AGI for various income ranges: 8.9% for AGIs below $25k, 10.2% for AGIs $25k-50k, 12.3% for AGIs $50k-75k, 12.5% for AGIs $75k-100k, 12.6% for AGIs $100k-200k, 8.7% for AGIs over 200k)
Charity contributions: $4,198 (reported on 25.5% of returns)
Here:
$4,198
State:
$4,465
(% of AGI for various income ranges: 0.7% for AGIs below $25k, 1.1% for AGIs $25k-50k, 1.6% for AGIs $50k-75k, 2.0% for AGIs $75k-100k, 2.2% for AGIs $100k-200k, 2.4% for AGIs over 200k)
Taxes paid: $5,299 (reported on 30.9% of returns)
99208:
$5,299
State:
$6,400
(% of AGI for various income ranges: 1.6% for AGIs below $25k, 2.2% for AGIs $25k-50k, 2.9% for AGIs $50k-75k, 3.2% for AGIs $75k-100k, 3.5% for AGIs $100k-200k, 2.4% for AGIs over 200k)
Earned income credit: $2,146 (reported on 16.1% of returns)
Here:
$2,146
State:
$2,073
(% of AGI for various income ranges: 5.5% for AGIs below $25k, 1.1% for AGIs $25k-50k)
Percentage of individuals using paid preparers for their 2012 taxes: 42.2%
Here:
42%
State:
43%
(% for various income ranges: 37.3% for AGIs below $25k, 41.6% for AGIs $25k-50k, 43.5% for AGIs $50k-75k, 42.9% for AGIs $75k-100k, 49.6% for AGIs $100k-200k, 73.2% for AGIs over 200k)
Averages for the 2004 tax year for zip code 99208, filed in 2005:
Average Adjusted Gross Income (AGI) in 2004: $49,378 (Individual Income Tax Returns)
Here:
$49,378
State:
$54,331
Salary/wage: $41,450 (reported on 83.2% of returns)
Here:
$41,450
State:
$45,761
(% of AGI for various income ranges: 137.5% for AGIs below $10k, 74.1% for AGIs $10k-25k, 76.1% for AGIs $25k-50k, 76.8% for AGIs $50k-75k, 80.7% for AGIs $75k-100k, 55.8% for AGIs over 100k)
Taxable interest for individuals: $1,808 (reported on 49.8% of returns)
This zip code:
$1,808
Washington:
$2,110
(% of AGI for various income ranges: 8.3% for AGIs below $10k, 2.9% for AGIs $10k-25k, 1.6% for AGIs $25k-50k, 1.5% for AGIs $50k-75k, 1.2% for AGIs $75k-100k, 1.9% for AGIs over 100k)
Taxable dividends: $2,903 (reported on 26.9% of returns)
Here:
$2,903
State:
$5,879
(% of AGI for various income ranges: 5.1% for AGIs below $10k, 1.6% for AGIs $10k-25k, 1.1% for AGIs $25k-50k, 1.1% for AGIs $50k-75k, 1.0% for AGIs $75k-100k, 2.2% for AGIs over 100k)
Net capital gain/loss: +$13,571 (reported on 23.6% of returns)
Here:
+$13,571
State:
+$15,835
(% of AGI for various income ranges: -0.6% for AGIs below $10k, 0.2% for AGIs $10k-25k, 0.7% for AGIs $25k-50k, 1.1% for AGIs $50k-75k, 1.7% for AGIs $75k-100k, 15.5% for AGIs over 100k)
Profit/loss from business: +$14,716 (reported on 12.7% of returns)
Here:
+$14,716
State:
+$13,994
(% of AGI for various income ranges: 0.9% for AGIs below $10k, 3.4% for AGIs $10k-25k, 2.4% for AGIs $25k-50k, 3.0% for AGIs $50k-75k, 2.6% for AGIs $75k-100k, 5.5% for AGIs over 100k)
IRA payment deduction: $3,137 (reported on 3.0% of returns)
99208:
$3,137
Washington:
$3,001
(% of AGI for various income ranges: 0.4% for AGIs below $10k, 0.2% for AGIs $10k-25k, 0.3% for AGIs $25k-50k, 0.2% for AGIs $50k-75k, 0.2% for AGIs $75k-100k, 0.1% for AGIs over 100k)
Self-employed pension: $13,557 (reported on 0.9% of returns)
Here:
$13,557
Washington:
$14,244
(% of AGI for various income ranges: 0.1% for AGIs $25k-50k, 0.1% for AGIs $50k-75k, 0.1% for AGIs $75k-100k, 0.5% for AGIs over 100k)
Total itemized deductions: $17,023 (20% of AGI, reported on 33.9% of returns)
Here:
$17,023
State:
$19,669
Here:
19.9% of AGI
State:
20.7% of AGI
(% of AGI for various income ranges: 14.0% for AGIs below $10k, 9.6% for AGIs $10k-25k, 11.5% for AGIs $25k-50k, 13.7% for AGIs $50k-75k, 14.6% for AGIs $75k-100k, 9.8% for AGIs over 100k)
Charity contributions deductions: $3,477 (4% of AGI, reported on 30.1% of returns)
Here:
$3,477
State:
$3,569
Here:
3.9% of AGI
State:
3.5% of AGI
(% of AGI for various income ranges: 0.9% for AGIs below $10k, 1.2% for AGIs $10k-25k, 1.5% for AGIs $25k-50k, 2.0% for AGIs $50k-75k, 2.4% for AGIs $75k-100k, 2.6% for AGIs over 100k)
Total tax: $7,448 (reported on 77.7% of returns)
99208:
$7,448
State:
$9,065
(% of AGI for various income ranges: 3.6% for AGIs below $10k, 4.2% for AGIs $10k-25k, 6.5% for AGIs $25k-50k, 8.2% for AGIs $50k-75k, 10.0% for AGIs $75k-100k, 18.6% for AGIs over 100k)
Earned income credit: $1,630 (reported on 11.3% of returns)
Here:
$1,630
State:
$1,607
Percentage of individuals using paid preparers for their 2004 taxes: 46.3%
Here:
46%
State:
49%
(% for various income ranges: 37.1% for AGIs below $10k, 45.5% for AGIs $10k-25k, 47.3% for AGIs $25k-50k, 47.7% for AGIs $50k-75k, 47.5% for AGIs $75k-100k, 60.8% for AGIs over 100k)
Likely homosexual households (counted as self-reported same-sex unmarried-partner households)
Lesbian couples: 0.0% of all households
Gay men: 0.1% of all households
Household received Food Stamps/SNAP in the past 12 months: 3,176 Household did not receive Food Stamps/SNAP in the past 12 months: 20,666
Women who had a birth in the past 12 months: 572 (408 now married, 158 unmarried) Women who did not have a birth in the past 12 months: 11,953 (5,705 now married, 6,237 unmarried)
Housing units in zip code 99208 with a mortgage: 10,151 (1,086 second mortgage, 4 home equity loan, 1,001 both second mortgage and home equity loan) Houses without a mortgage: 241
Median monthly owner costs for units with a mortgage: $1,842 Median monthly owner costs for units without a mortgage: $645
Residents with income below the poverty level in 2022:
This zip code:
8.7%
Whole state:
10.0%
Residents with income below 50% of the poverty level in 2022:
This zip code:
4.0%
Whole state:
4.6%
Median number of rooms in houses and condos:
Here:
7.9
State:
6.5
Median number of rooms in apartments:
Here:
3.8
State:
3.9
Notable locations in this zip code not listed on our city pages
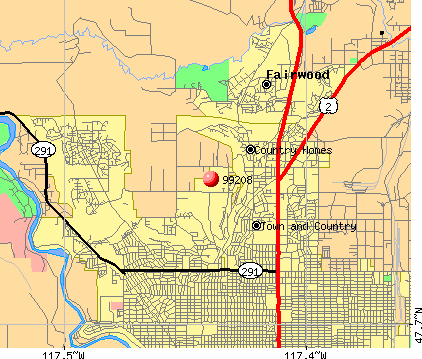
Notable locations in zip code 99208: Indian Rock Paintings (A), Fort Spokane Historic Site (B), Commellini Junction (C), Spokane State Fish Hatchery (D), Spokane County Fire District 9 Station 95 (E), Good Shepherd Home (F), Spokane Fire Department Station 18 (G), Spokane Fire Department Station 17 (H). Display/hide their locations on the map
Parks in zip code 99208 include: Little Spokane River Park (1), Harmon Field (2), Indian Trail Park (3), Jim Hill Park (4), Linwood Park (5), Indian Rock Paintings State Park (6), Sunburst Park (7), Aubrey L White Park (8), Mount Vista Park (9). Display/hide their locations on the map
Tourist attractions (not listed on the city page) : Trade A Game Inc (Amusement & Theme Parks; 6813 North Division Street) (1), Annie's Tours (Tours & Charters; 6419 North Monroe Street) (2). Display/hide their approximate locations on the map
9,826 married couples with children.
3,012 single-parent households (1,201 men, 1,811 women).
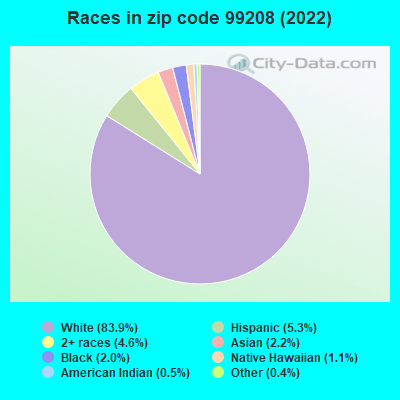
92.9% of residents of 99208 zip code speak English at home.
1.5% of residents speak Spanish at home (66% very well, 27% well, 6% not well, 1% not at all).
3.0% of residents speak other Indo-European language at home (60% very well, 26% well, 13% not well, 2% not at all).
1.6% of residents speak Asian or Pacific Island language at home (55% very well, 37% well, 8% not well).
0.5% of residents speak other language at home (43% very well, 55% well, 2% not well).
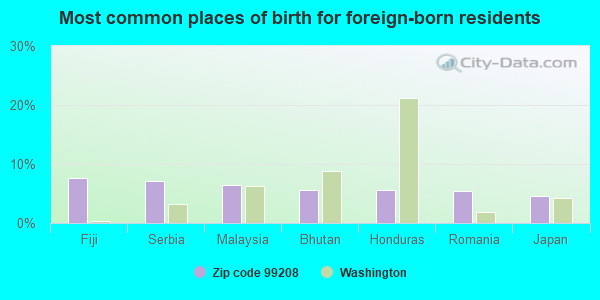
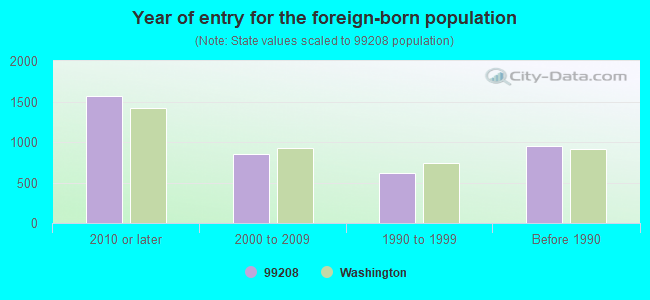
Foreign born population: 3,247 (5.5%) (61.7% of them are naturalized citizens)
Facilities with environmental interests located in this zip code:
CIRCLE K STORE 01151 (4807 W NINE MILE RD in SPOKANE, WA)
Conditionally Exempt Small Quantity Generators, less than 100 kg/month of hazardous waste (Resource Conservation and Recovery Act (tracking hazardous waste)) STATE MASTER (Washington State Department of Ecology's Facility/Site identification system) - HAZWASTE-WAR000011072, EPCRA, CESQG Business SIC classification: GASOLINE SERVICE STATIONS Organizations: GUY STANDARD (CONTACT/OPERATOR)
, CONOCOPHILLIPS (CONTACT/OWNER)
Alternative names: TOSCO FACILITY 01151
ALTONS TIRE & AUTOMOTIVE CENTERS INC DIV (N 7777 DIVISION ST in SPOKANE, WA)
Conditionally Exempt Small Quantity Generators, less than 100 kg/month of hazardous waste (Resource Conservation and Recovery Act (tracking hazardous waste)) - notification STATE MASTER (Washington State Department of Ecology's Facility/Site identification system) - TOXICS-4851, UNDERGROUND STORAGE TANK PROGRAM, HAZWASTE-WAD988517090, CESQG Business SIC classification: GENERAL AUTOMOTIVE REPAIR SHOPS Business NAICS classification: GENERAL AUTOMOTIVE REPAIR.; GENERAL AUTOMOTIVE REPAIR. Alternative names: ALTONS AUTOMOTIVE & TIRE CENTER UST 4851
CEDAR CREEK CHEVRON (8624 N NEVADA ST in SPOKANE, WA)
Conditionally Exempt Small Quantity Generators, less than 100 kg/month of hazardous waste (Resource Conservation and Recovery Act (tracking hazardous waste)) STATE MASTER (Washington State Department of Ecology's Facility/Site identification system) - TOXICS-401846, LEAKING STORAGE TANK, HAZWASTE-CRK000042850, EPCRA, TOXICS-, UNDERGROUND STORAGE TANK PROGRAM, HAZWASTE-WAH000000166, CESQG, TOXICS-, GROUND WATER PROGRAM Business SIC classification: GASOLINE SERVICE STATIONS Organizations: BOB BEAL (CONTACT/OWNER)
Alternative names: CEDAR CREEK FOODMART
ABLE CLEANUP TECHNOLOGIES INCORPORATED (3106 WEST HORIZON AVENUE in SPOKANE, WA)
(Resource Conservation and Recovery Act (tracking hazardous waste))
COLUMBIA PAINT & COATINGS DIVISION SPOK (7228 N DIVISION ST in SPOKANE, WA)
(Resource Conservation and Recovery Act (tracking hazardous waste)) Organizations: COLUMBIA PAINT & COATINGS CO (CONTACT/OPERATOR)
Housing units lacking complete kitchen facilities: 1.0%
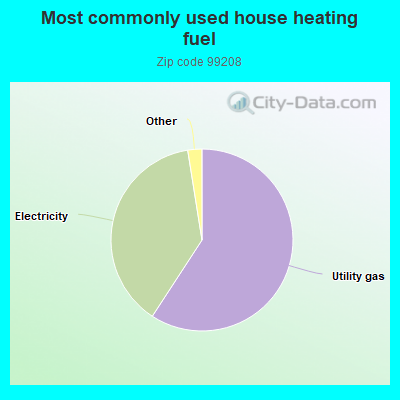
59.2%Utility gas
38.3%Electricity
1.0%Bottled, tank, or LP gas
0.9%Wood
Population in 1990: 27,989. Population change in the 1990s: +6,592 (+23.6%).
Place of birth for U.S.-born residents:
This state: 32,122
Northeast: 1,660
Midwest: 4,300
South: 2,970
West: 13,679
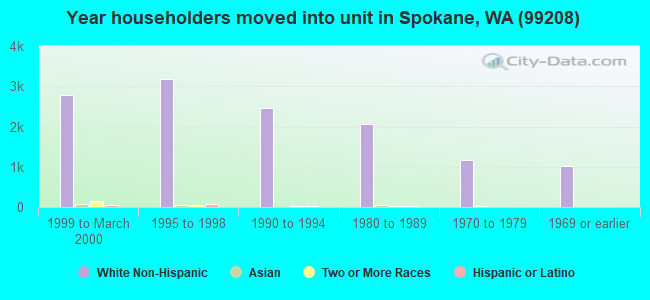
55% of the 99208 zip code residents lived in the same house 5 years ago. Out of people who lived in different houses, 66% lived in this county. Out of people who lived in different counties, 50% lived in Washington.
88% of the 99208 zip code residents lived in the same house 1 year ago. Out of people who lived in different houses, 67% moved from this county. Out of people who lived in different houses, 14% moved from different county within same state. Out of people who lived in different houses, 15% moved from different state. Out of people who lived in different houses, 3% moved from abroad.
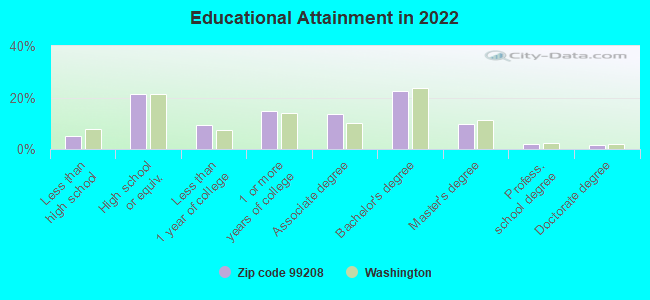
Private vs. public school enrollment:
Students in private schools in grades 1 to 8 (elementary and middle school): 658
Here:
9.9%
Washington:
12.4%
Students in private schools in grades 9 to 12 (high school): 382
Here:
10.7%
Washington:
9.2%
Students in private undergraduate colleges: 392
Here:
20.1%
Washington:
16.5%
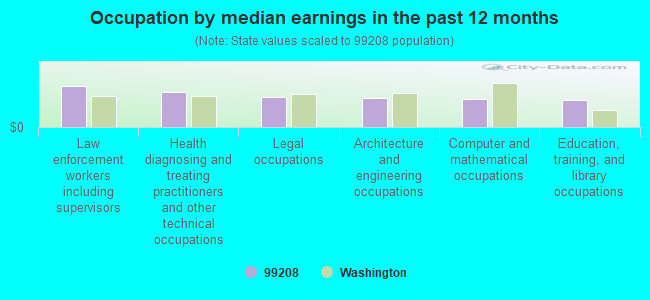
Occupation by median earnings in the past 12 months ($)
116,677Law enforcement workers including supervisors
100,896Health diagnosing and treating practitioners and other technical occupations
85,368Legal occupations
83,527Architecture and engineering occupations
79,105Computer and mathematical occupations
78,071Education, training, and library occupations
Companies with federal contracts located in this zip code (SPOKANE, WA):
BURTON CONSTRUCTION, INC. (55 E. LINCOLN RD. SUITE 10; small business) : $941,466 in 9 contractsin 2000
Contracts for Maintenance, Repair or Alteration of Real Property -- Other Non-Building Facilities, Maintenance, Repair or Alteration of Real Property -- Miscellaneous Buildings, Maintenance, Repair or Alteration of Real Property -- Parking Facilities Conservation by Army Signed by year:2000: $941,466; 2001: $0; 2002: $0; 2003: $0; 2004: $0; 2005: $0; 2006: $0.
Biggest contracts:
$403,001 with Army for Maintenance, Repair or Alteration of Real Property -- Other Non-Building Facilities. Taking place in OR. Signed on 2000-09-28. Completion date: 2001-04-26.
$261,450, same as above.Signed on 2000-09-27. Completion date: 2001-04-25.
$105,120, same as above.Signed on 2000-09-06. Completion date: 2001-01-04.
$59,710 with Army for Maintenance, Repair or Alteration of Real Property -- Miscellaneous Buildings. Taking place in OR. Signed on 2000-06-12. Completion date: 2000-08-11.
MARK TOLLEFSEN (5633 W BEDFORD AVE; small business) : $98,315 in 12 contractsfrom 2001 to 2005
Contracts for Fuel Cell Power Units, Components,and Accessories, Miscellaneous Items, Miscellaneous Electrical and Electronic Components, Electronic Modules by U.S. Army Corps of Engineers - civil program financing only, Army Signed by year:2000: $0; 2001: $21,805; 2002: $17,380; 2003: $19,780; 2004: $26,384; 2005: $12,966; 2006: $0.
Biggest contracts:
$21,805 with U.S. Army Corps of Engineers - civil program financing only for Fuel Cell Power Units, Components,and Accessories. Signed on 2001-08-03. Completion date: 2001-08-15.
$17,380, same as above.Signed on 2002-03-14. Completion date: 2002-03-15.
$17,380, same as above.Signed on 2002-02-19. Completion date: 2002-02-28.
$9,890 with Army for Fuel Cell Power Units, Components,and Accessories. Signed on 2003-10-27. Completion date: 2003-11-09.
PQ PRODUCTS INC (927 E FARWELL RD; small business)
$17,755 with Air Force for Water Purification Equipment. Signed on 2004-04-05. Completion date: 2004-04-12.
SYTE NET SERVICES INC (14909 N EDENCREST DR; small business)
$13,084 with Air Force for ADP Support Equipment. Signed on 2005-09-06. Completion date: 2005-10-03.
HAMRE CONSTRUCTION INC (6619 N CEDAR RD, STE 107; small business) : $9,093 in 4 contractsfrom 2000 to 2001
$12,140 with Air Force for Maintenance, Repair or Alteration of Real Property -- Troop Housing Facilities. Signed on 2000-07-19. Completion date: 2000-07-21.
$10,635, same as above.Signed on 2000-01-31. Completion date: 2000-07-31.
-$5,546 with Air Force for Maintenance, Repair or Alteration of Real Property -- Recreational Buildings. Signed on 2000-01-03. Completion date: 1999-07-30.
-$8,136 with Air Force for Maintenance, Repair or Alteration of Real Property -- Troop Housing Facilities. Signed on 2001-03-05. Completion date: 2000-07-21.
TONY THOMPSON (9309 N FARMDALE; small business) : $8,475 in 5 contractsfrom 2004 to 2006
Contracts for Snow Removal/Salt Service (also spreading aggregate or other snow melting material) by Air Force Signed by year:2000: $0; 2001: $0; 2002: $0; 2003: $0; 2004: $7,700; 2005: $5,991; 2006: -$5,216.
Biggest contracts:
$8,580 with Air Force for Snow Removal/Salt Service (also spreading aggregate or other snow melting material). Signed on 2005-10-28. Completion date: 2006-09-30.
$7,700, same as above.Signed on 2004-10-01. Completion date: 2005-09-30.
$0, same as above.Signed on 2006-05-02. Completion date: 2006-09-30.
-$2,589, same as above.Signed on 2005-05-10. Completion date: 2005-09-30.
POWERS, FRANK (8503 NORTH STANDARD; small business) : $8,100 in 2 contractsin 2005
$4,600 with Air Force for Education Services. Signed on 2005-09-22. Completion date: 2005-11-09.
$3,500 with Air Force for Other Education and Training Services. Signed on 2005-05-09. Completion date: 2005-05-19.
RAILWAY LOGISTICS INTERNATIONA (7115 N DIVISION ST; small business)
$5,541 with Defense Logistics Agency for Miscellaneous Power Transmission Equipment. Taking place in GA. Signed on 2005-02-04. Completion date: 2005-03-24.
AERIAL ENGINEERING INC (15501 N LANTERN LN; small business) : $4,822 in 3 contractsin 2004
$4,100 with Army for Industrial Hygienics. Signed on 2004-04-02. Completion date: 2004-08-31.
$1,733, same as above.Signed on 2004-09-23. Completion date: 2004-08-31.
-$1,011, same as above.Signed on 2004-09-16. Completion date: 2004-08-31.
RESCUE NORTHWEST (15612 N JUNEBERRY DR; small business)
$4,346 with Army for Miscellaneous Items. Signed on 2004-09-02. Completion date: 2004-09-30.
Top industries in this zip code by the number of employees in 2005:
Health Care and Social Assistance: General Medical and Surgical Hospitals (over 1000 employees: 1 establishment)
Finance and Insurance: Direct Life Insurance Carriers (500-999: 1, 1-4: 1)
2002 - 2018 National Fire Incident Reporting System (NFIRS) incidents
Based on the data from the years 2002 - 2018 the average number of fire incidents per year is 71. The highest number of fires - 134 took place in 2015, and the least - 18 in 2002. The data has an increasing trend.
When looking into fire subcategories, the most reports belonged to: Outside Fires (45.1%), and Structure Fires (36.4%).
Fire incident types reported to NFIRS in Zip Code 99208


 Nearest zip codes: 99218, 99205, 99005, 99207, 99201, 99204.


 Based on the data from the years 2002 - 2018 the average number of fire incidents per year is 71. The highest number of fires - 134 took place in 2015, and the least - 18 in 2002. The data has an increasing trend.
 When looking into fire subcategories, the most reports belonged to: Outside Fires (45.1%), and Structure Fires (36.4%).