Estimated zip code population in 2022: 14,467 Zip code population in 2010: 12,979 Zip code population in 2000: 11,399
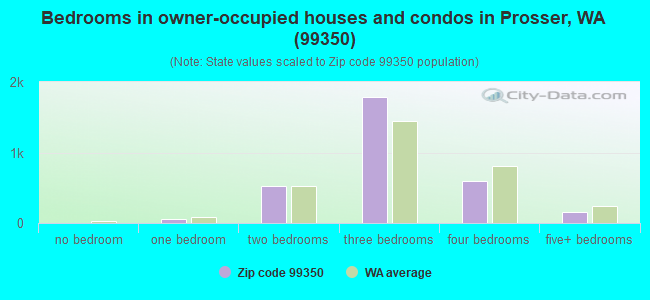
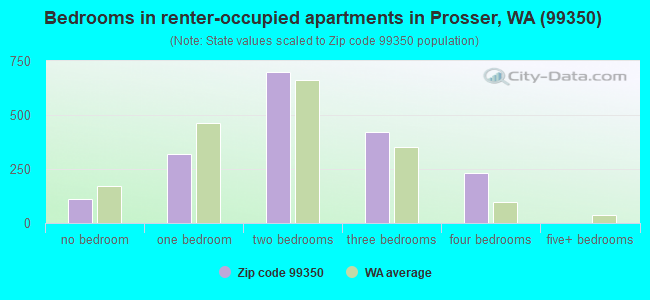
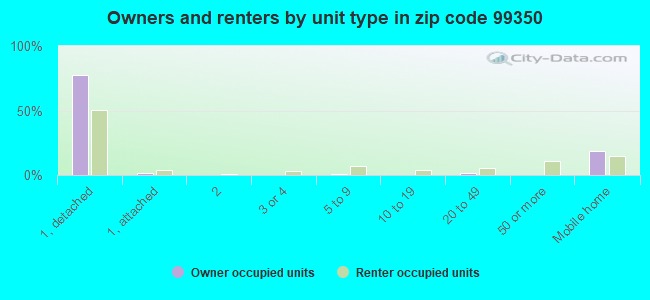
Houses and condos: 5,203 Renter-occupied apartments: 1,807
% of renters here:
37%
State:
36%
March 2022 cost of living index in zip code 99350: 94.5 (less than average, U.S. average is 100)
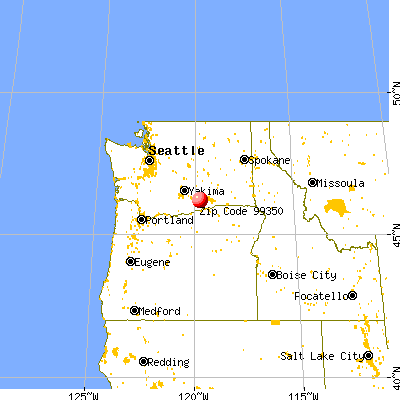
Land area: 571.4 sq. mi. Water area: 0.9 sq. mi.
Population density: 25 people per square mile
(very low).
OSM Map
General Map
Google Map
MSN Map
OSM Map
General Map
Google Map
MSN Map
OSM Map
General Map
Google Map
MSN Map
OSM Map
General Map
Google Map
MSN Map
Please wait while loading the map...
Real estate property taxes paid for housing units in 2022:
This zip code:
0.7% ($2,447)
Washington:
0.8% ($4,283)
Median real estate property taxes paid for housing units with mortgages in 2022: $2,391 (0.7%) Median real estate property taxes paid for housing units with no mortgage in 2022: $2,556 (0.8%)
Business Search- 14 Million verified businesses
Males: 7,388
(51.1%)
Females: 7,079
(48.9%)
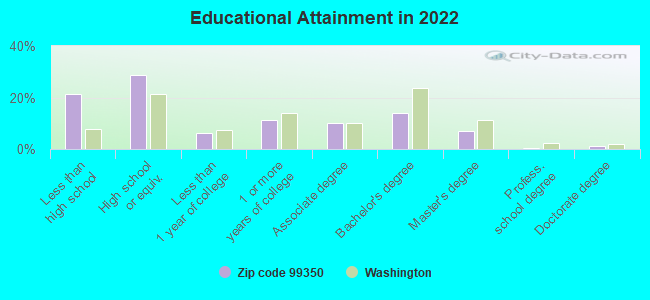
For population 25 years and over in 99350:
High school or higher: 77.8%
Bachelor's degree or higher: 22.1%
Graduate or professional degree: 8.1%
Unemployed: 5.9%
Mean travel time to work (commute): 20.3 minutes
For population 15 years and over in 99350:
Never married: 27.7%
Now married: 55.7%
Separated: 1.8%
Widowed: 6.0%
Divorced: 8.7%
Zip code 99350 compared to state average:
Median house value below state average.
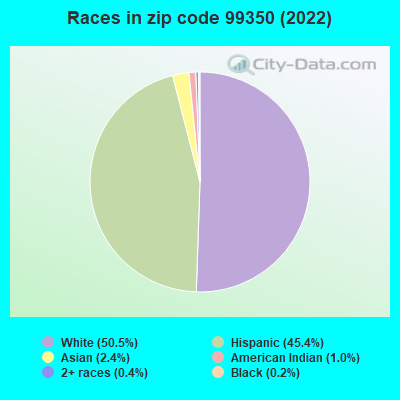
Black race population percentage significantly below state average.
Hispanic race population percentage significantly above state average.
Length of stay since moving in significantly above state average.
Percentage of population with a bachelor's degree or higher below state average.
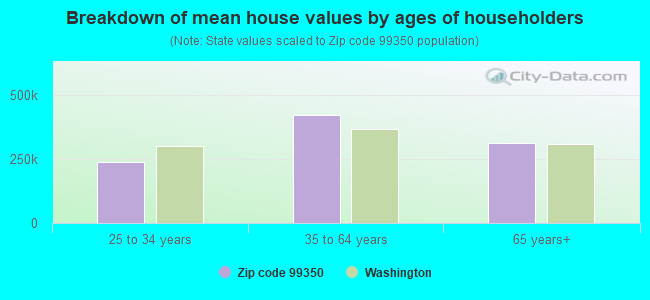
Estimated median house/condo value in 2022: $335,035
99350:
$335,035
Washington:
$569,500
According to our research of Washington and other state lists, there were 7 registered sex offenders living in 99350 zip code as of April 27, 2024. The ratio of all residents to sex offenders in zip code 99350 is 1,936 to 1. The ratio of registered sex offenders to all residents in this zip code is lower than the state average.
Median resident age:
This zip code:
35.0 years
Washington median age:
38.4 years
Average household size:
This zip code:
2.9 people
Washington:
2.5 people
Averages for the 2020 tax year for zip code 99350, filed in 2021:
Average Adjusted Gross Income (AGI) in 2020: $70,303 (Individual Income Tax Returns)
Here:
$70,303
State:
$99,264
Salary/wage: $51,946 (reported on 86.8% of returns)
Here:
$51,946
State:
$80,347
(% of AGI for various income ranges: 1455.5% for AGIs below $25k, 3844.1% for AGIs $25k-50k, 6622.1% for AGIs $50k-75k, 9661.2% for AGIs $75k-100k, 18356.4% for AGIs $100k-200k, 55017.1% for AGIs over 200k)
Taxable interest for individuals: $2,017 (reported on 22.2% of returns)
This zip code:
$2,017
Washington:
$2,077
(% of AGI for various income ranges: 12.7% for AGIs below $25k, 23.8% for AGIs $25k-50k, 24.0% for AGIs $50k-75k, 63.0% for AGIs $75k-100k, 175.7% for AGIs $100k-200k, 1488.6% for AGIs over 200k)
Ordinary dividends: $5,694 (reported on 10.8% of returns)
Here:
$5,694
State:
$10,013
(% of AGI for various income ranges: 11.7% for AGIs below $25k, 20.3% for AGIs $25k-50k, 40.6% for AGIs $50k-75k, 68.8% for AGIs $75k-100k, 206.8% for AGIs $100k-200k, 2645.7% for AGIs over 200k)
Net capital gain/loss in AGI: +$22,320 (reported on 12.0% of returns)
Here:
+$22,320
State:
+$40,092
(% of AGI for various income ranges: 12.1% for AGIs below $25k, 19.4% for AGIs $25k-50k, 74.9% for AGIs $50k-75k, 188.2% for AGIs $75k-100k, 567.2% for AGIs $100k-200k, 17682.9% for AGIs over 200k)
Profit/loss from business: +$14,398 (reported on 9.8% of returns)
Here:
+$14,398
State:
+$18,312
(% of AGI for various income ranges: 40.1% for AGIs below $25k, 77.4% for AGIs $25k-50k, 167.1% for AGIs $50k-75k, 221.2% for AGIs $75k-100k, 383.0% for AGIs $100k-200k, 4781.4% for AGIs over 200k)
Taxable individual retirement arrangement distribution: $27,508 (reported on 6.1% of returns)
99350:
$27,508
Washington:
$24,221
(% of AGI for various income ranges: 35.6% for AGIs below $25k, 54.4% for AGIs $25k-50k, 128.7% for AGIs $50k-75k, 288.2% for AGIs $75k-100k, 748.5% for AGIs $100k-200k, 5238.6% for AGIs over 200k)
Total itemized deductions: $40,459 (reported on 4.3% of returns)
Here:
$40,459
State:
$39,068
(% of AGI for various income ranges: 56.8% for AGIs $25k-50k, 110.3% for AGIs $50k-75k, 224.0% for AGIs $75k-100k, 690.4% for AGIs $100k-200k, 7522.9% for AGIs over 200k)
Charity contributions: $25,324 (reported on 3.4% of returns)
Here:
$25,324
State:
$15,331
(% of AGI for various income ranges: 35.9% for AGIs $50k-75k, 53.0% for AGIs $75k-100k, 203.2% for AGIs $100k-200k, 5581.4% for AGIs over 200k)
Taxes paid: $6,144 (reported on 4.3% of returns)
99350:
$6,144
State:
$7,774
(% of AGI for various income ranges: 7.9% for AGIs $25k-50k, 21.2% for AGIs $50k-75k, 44.0% for AGIs $75k-100k, 141.7% for AGIs $100k-200k, 808.6% for AGIs over 200k)
Earned income credit: $2,121 (reported on 16.1% of returns)
Here:
$2,121
State:
$2,020
(% of AGI for various income ranges: 76.8% for AGIs below $25k, 75.3% for AGIs $25k-50k, 2.2% for AGIs $50k-75k)
Percentage of individuals using paid preparers for their 2020 taxes: 93.4%
Here:
93%
State:
93%
(% for various income ranges: 92.2% for AGIs below $25k, 93.1% for AGIs $25k-50k, 94.6% for AGIs $50k-75k, 94.7% for AGIs $75k-100k, 94.1% for AGIs $100k-200k, 95.7% for AGIs over 200k)
Averages for the 2012 tax year for zip code 99350, filed in 2013:
Average Adjusted Gross Income (AGI) in 2012: $51,681 (Individual Income Tax Returns)
Here:
$51,681
State:
$69,533
Salary/wage: $42,102 (reported on 88.4% of returns)
Here:
$42,102
State:
$57,267
(% of AGI for various income ranges: 82.2% for AGIs below $25k, 83.6% for AGIs $25k-50k, 81.2% for AGIs $50k-75k, 80.8% for AGIs $75k-100k, 78.0% for AGIs $100k-200k, 31.5% for AGIs over 200k)
Taxable interest for individuals: $2,079 (reported on 27.2% of returns)
This zip code:
$2,079
Washington:
$1,816
(% of AGI for various income ranges: 1.0% for AGIs below $25k, 0.8% for AGIs $25k-50k, 0.8% for AGIs $50k-75k, 0.7% for AGIs $75k-100k, 1.4% for AGIs $100k-200k, 1.7% for AGIs over 200k)
Ordinary dividends: $5,366 (reported on 11.9% of returns)
Here:
$5,366
State:
$8,163
(% of AGI for various income ranges: 1.1% for AGIs below $25k, 0.5% for AGIs $25k-50k, 0.8% for AGIs $50k-75k, 0.9% for AGIs $75k-100k, 1.2% for AGIs $100k-200k, 2.9% for AGIs over 200k)
Net capital gain/loss in AGI: +$11,568 (reported on 9.2% of returns)
Here:
+$11,568
State:
+$21,568
(% of AGI for various income ranges: 0.2% for AGIs $25k-50k, 0.9% for AGIs $50k-75k, 0.8% for AGIs $75k-100k, 1.7% for AGIs $100k-200k, 7.6% for AGIs over 200k)
Profit/loss from business: +$10,652 (reported on 11.2% of returns)
Here:
+$10,652
State:
+$16,521
(% of AGI for various income ranges: 2.2% for AGIs below $25k, 2.2% for AGIs $25k-50k, 2.2% for AGIs $50k-75k, 1.3% for AGIs $75k-100k, 2.6% for AGIs $100k-200k, 3.1% for AGIs over 200k)
Taxable individual retirement arrangement distribution: $14,326 (reported on 7.0% of returns)
99350:
$14,326
Washington:
$18,648
(% of AGI for various income ranges: 1.5% for AGIs below $25k, 1.9% for AGIs $25k-50k, 2.3% for AGIs $50k-75k, 2.0% for AGIs $75k-100k, 3.4% for AGIs $100k-200k)
Self-employment retirement plans: $21,933 (reported on 0.6% of returns)
99350:
$21,933
Washington:
$20,087
(% of AGI for various income ranges: 1.0% for AGIs $100k-200k)
Total itemized deductions: $21,304 (19% of AGI, reported on 20.6% of returns)
Here:
$21,304
State:
$23,872
Here:
19.4% of AGI
State:
18.2% of AGI
(% of AGI for various income ranges: 6.6% for AGIs below $25k, 5.7% for AGIs $25k-50k, 9.2% for AGIs $50k-75k, 9.3% for AGIs $75k-100k, 10.1% for AGIs $100k-200k, 9.1% for AGIs over 200k)
Charity contributions: $6,827 (reported on 15.1% of returns)
Here:
$6,827
State:
$4,465
(% of AGI for various income ranges: 0.5% for AGIs below $25k, 0.6% for AGIs $25k-50k, 1.3% for AGIs $50k-75k, 1.6% for AGIs $75k-100k, 2.2% for AGIs $100k-200k, 4.9% for AGIs over 200k)
Taxes paid: $4,194 (reported on 20.4% of returns)
99350:
$4,194
State:
$6,400
(% of AGI for various income ranges: 1.0% for AGIs below $25k, 1.1% for AGIs $25k-50k, 1.7% for AGIs $50k-75k, 2.1% for AGIs $75k-100k, 2.5% for AGIs $100k-200k, 1.2% for AGIs over 200k)
Earned income credit: $2,346 (reported on 20.6% of returns)
Here:
$2,346
State:
$2,073
(% of AGI for various income ranges: 6.8% for AGIs below $25k, 1.4% for AGIs $25k-50k)
Percentage of individuals using paid preparers for their 2012 taxes: 57.5%
Here:
58%
State:
43%
(% for various income ranges: 54.6% for AGIs below $25k, 59.9% for AGIs $25k-50k, 56.0% for AGIs $50k-75k, 57.8% for AGIs $75k-100k, 61.2% for AGIs $100k-200k, 80.0% for AGIs over 200k)
Averages for the 2004 tax year for zip code 99350, filed in 2005:
Average Adjusted Gross Income (AGI) in 2004: $38,761 (Individual Income Tax Returns)
Here:
$38,761
State:
$54,331
Salary/wage: $34,723 (reported on 86.5% of returns)
Here:
$34,723
State:
$45,761
(% of AGI for various income ranges: 120.8% for AGIs below $10k, 78.2% for AGIs $10k-25k, 84.4% for AGIs $25k-50k, 83.9% for AGIs $50k-75k, 84.3% for AGIs $75k-100k, 56.2% for AGIs over 100k)
Taxable interest for individuals: $1,842 (reported on 42.1% of returns)
This zip code:
$1,842
Washington:
$2,110
(% of AGI for various income ranges: 7.3% for AGIs below $10k, 2.9% for AGIs $10k-25k, 1.5% for AGIs $25k-50k, 1.8% for AGIs $50k-75k, 1.3% for AGIs $75k-100k, 2.3% for AGIs over 100k)
Taxable dividends: $2,156 (reported on 16.7% of returns)
Here:
$2,156
State:
$5,879
(% of AGI for various income ranges: 2.9% for AGIs below $10k, 0.9% for AGIs $10k-25k, 0.5% for AGIs $25k-50k, 0.6% for AGIs $50k-75k, 0.8% for AGIs $75k-100k, 1.6% for AGIs over 100k)
Net capital gain/loss: +$12,974 (reported on 15.6% of returns)
Here:
+$12,974
State:
+$15,835
(% of AGI for various income ranges: -2.2% for AGIs below $10k, 0.9% for AGIs $10k-25k, 0.9% for AGIs $25k-50k, 0.9% for AGIs $50k-75k, 1.8% for AGIs $75k-100k, 18.3% for AGIs over 100k)
Profit/loss from business: +$10,494 (reported on 12.6% of returns)
Here:
+$10,494
State:
+$13,994
(% of AGI for various income ranges: -1.6% for AGIs below $10k, 2.6% for AGIs $10k-25k, 2.8% for AGIs $25k-50k, 1.6% for AGIs $50k-75k, 2.1% for AGIs $75k-100k, 7.4% for AGIs over 100k)
IRA payment deduction: $3,363 (reported on 2.0% of returns)
99350:
$3,363
Washington:
$3,001
(% of AGI for various income ranges: 0.1% for AGIs $10k-25k, 0.2% for AGIs $25k-50k, 0.2% for AGIs $50k-75k, 0.2% for AGIs $75k-100k, 0.2% for AGIs over 100k)
Self-employed pension: $11,733 (reported on 0.6% of returns)
Here:
$11,733
Washington:
$14,244
Total itemized deductions: $16,504 (23% of AGI, reported on 21.8% of returns)
Here:
$16,504
State:
$19,669
Here:
23.2% of AGI
State:
20.7% of AGI
(% of AGI for various income ranges: 6.5% for AGIs below $10k, 6.4% for AGIs $10k-25k, 8.4% for AGIs $25k-50k, 10.1% for AGIs $50k-75k, 11.1% for AGIs $75k-100k, 9.9% for AGIs over 100k)
Charity contributions deductions: $4,146 (5% of AGI, reported on 17.2% of returns)
Here:
$4,146
State:
$3,569
Here:
5.4% of AGI
State:
3.5% of AGI
(% of AGI for various income ranges: 0.4% for AGIs below $10k, 0.6% for AGIs $10k-25k, 1.1% for AGIs $25k-50k, 1.7% for AGIs $50k-75k, 2.2% for AGIs $75k-100k, 3.2% for AGIs over 100k)
Total tax: $5,309 (reported on 65.6% of returns)
99350:
$5,309
State:
$9,065
(% of AGI for various income ranges: 2.3% for AGIs below $10k, 2.9% for AGIs $10k-25k, 5.2% for AGIs $25k-50k, 8.0% for AGIs $50k-75k, 10.1% for AGIs $75k-100k, 16.4% for AGIs over 100k)
Earned income credit: $1,822 (reported on 19.8% of returns)
Here:
$1,822
State:
$1,607
Percentage of individuals using paid preparers for their 2004 taxes: 57.5%
Here:
58%
State:
49%
(% for various income ranges: 48.7% for AGIs below $10k, 59.8% for AGIs $10k-25k, 58.1% for AGIs $25k-50k, 59.3% for AGIs $50k-75k, 61.0% for AGIs $75k-100k, 68.7% for AGIs over 100k)
Likely homosexual households (counted as self-reported same-sex unmarried-partner households)
Lesbian couples: 0.0% of all households
Gay men: 0.2% of all households
Household received Food Stamps/SNAP in the past 12 months: 516 Household did not receive Food Stamps/SNAP in the past 12 months: 4,415
Women who had a birth in the past 12 months: 30 (8 now married, 20 unmarried) Women who did not have a birth in the past 12 months: 3,024 (1,501 now married, 1,518 unmarried)
Housing units in zip code 99350 with a mortgage: 1,818 (244 second mortgage, 32 home equity loan, 227 both second mortgage and home equity loan) Houses without a mortgage: 14
Median monthly owner costs for units with a mortgage: $1,584 Median monthly owner costs for units without a mortgage: $498
Residents with income below the poverty level in 2022:
This zip code:
10.4%
Whole state:
10.0%
Residents with income below 50% of the poverty level in 2022:
This zip code:
7.6%
Whole state:
4.6%
Median number of rooms in houses and condos:
Here:
6.1
State:
6.5
Median number of rooms in apartments:
Here:
4.7
State:
3.9
Notable locations in this zip code not listed on our city pages
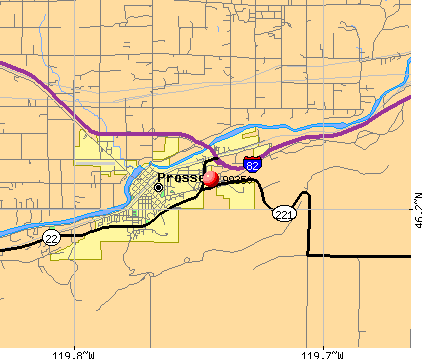
Notable locations in zip code 99350: Anderson Ranch (A), Bennett Ranch (B), Davis Ranch (C), McWhorter Ranch (D), Prior Ranch (E), Snively Ranch (F), Youngs Ranch (G), Biggam (H), Klickitat County Fire District 10 (I), Benton County Fire District 6 (J), Prosser Memorial Hospital Emergency Medical Services (K), Prosser Fire District 3 Station 320 (L), Benton County Fire Protection District 5 Station 540 (M), Benton County Fire Protection District 5 Station 520 (N), Benton County Fire Protection District 5 Station 530 (O), Prosser Fire District 3 Station 310 (P). Display/hide their locations on the map
In group quarters: 197 (-1 institutionalized population)
Size of family households: 1,410 2-persons, 770 3-persons, 808 4-persons, 498 5-persons, 144 6-persons, 133 7-or-more-persons
Size of nonfamily households: 1,043 1-person, 82 2-persons
2,907 married couples with children.
1,147 single-parent households (301 men, 846 women).
63.2% of residents of 99350 zip code speak English at home.
35.5% of residents speak Spanish at home (57% very well, 13% well, 15% not well, 15% not at all).
0.9% of residents speak other Indo-European language at home (90% very well, 10% well).
1.0% of residents speak Asian or Pacific Island language at home (74% very well, 26% well).
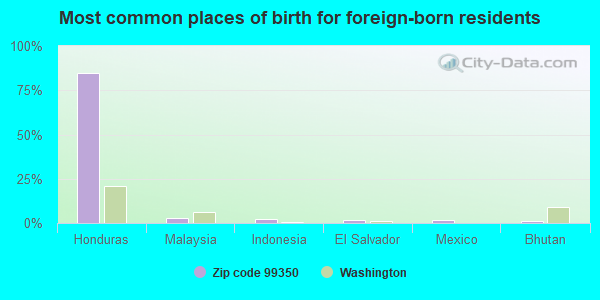
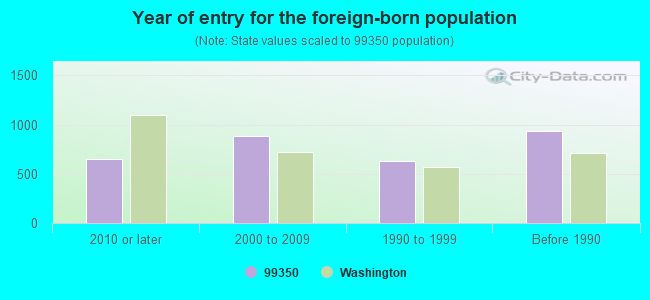
Foreign born population: 2,791 (19.3%) (23.6% of them are naturalized citizens)
This zip code:
19.3%
Whole state:
15.3%
85%Honduras
3%Malaysia
2%Indonesia
2%El Salvador
2%Mexico
1%Bhutan
0%North Macedonia (Macedonia)
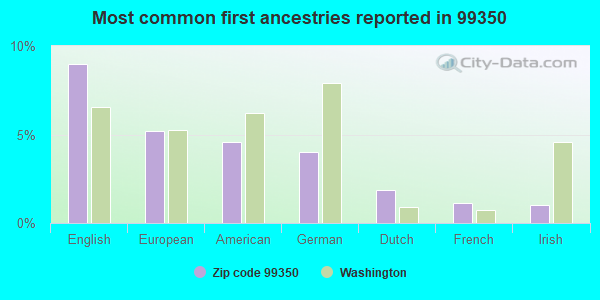
9%English
5%European
5%American
4%German
2%Dutch
1%French
1%Irish
Year of entry for the foreign-born population
6512010 or later
8792000 to 2009
6301990 to 1999
939Before 1990
Facilities with environmental interests located in this zip code:
ALEXANDER FARMS (179101 W KING TULL RD in PROSSER, WA)
HAZARDOUS WASTE BIENNIAL REPORTER (Resource Conservation and Recovery Act (tracking hazardous waste)) (Resource Conservation and Recovery Act (tracking hazardous waste)) STATE MASTER (Washington State Department of Ecology's Facility/Site identification system) - HAZWASTE-WAH000006999, HAZARDOUS WASTE PROGRAM, TOXICS-, FORMAL ENFORCEMENT ACTION, GROUND WATER PROGRAM Business SIC classification: GENERAL FARMS, PRIMARILY CROP Business NAICS classification: ALL OTHER MISCELLANEOUS CROP FARMING.; ALL OTHER MISCELLANEOUS CROP FARMING.
ALLEN KENASCO (631 WINE COUNTRY RD in PROSSER, WA)
(Resource Conservation and Recovery Act (tracking hazardous waste)) STATE MASTER (Washington State Department of Ecology's Facility/Site identification system) - TOXICS-459943, LEAKING STORAGE TANK, UNDERGROUND STORAGE TANK PROGRAM, TOXICS-, INDEPENDENT CLEANUP Business SIC classification: FABRICATED METAL PRODUCTS; CONVEYORS AND CONVEYING EQUIPMENT; FOOD PRODUCTS MACHINERY Business NAICS classification: FOOD PRODUCT MACHINERY MANUFACTURING. Organizations: KEN LEINGANG (CONTACT/OPERATOR)
, ALLEN MACHINERY (CONTACT/OWNER)
Alternative names: ALLEN MACHINERY COMPANY
BURLINGTON NORTHERN SANTA FE RAILWAY (1120 BENNETT ST in PROSSER, WA)
(Resource Conservation and Recovery Act (tracking hazardous waste)) STATE MASTER (Washington State Department of Ecology's Facility/Site identification system) - HAZWASTE-WAH000015222, HAZARDOUS WASTE PROGRAM Business SIC classification: RAILROADS, LINE-HAUL OPERATING Organizations: BURLINGTON NORTHERN SANTA FE RAIL WAY (CONTACT/OPERATOR)
COLLINS SVC (1123 WINE COUNTRY RD in PROSSER, WA)
(Resource Conservation and Recovery Act (tracking hazardous waste)) STATE MASTER (Washington State Department of Ecology's Facility/Site identification system) - TOXICS-11125, UNDERGROUND STORAGE TANK PROGRAM Business SIC classification: GENERAL AUTOMOTIVE REPAIR SHOPS; AUTOMOTIVE REPAIR SHOPS Business NAICS classification: GENERAL AUTOMOTIVE REPAIR.; GENERAL AUTOMOTIVE REPAIR. Organizations: MARCUS COLLINS (CONTACT/OPERATOR)
AG AIR / HEIDI BOLONG (150201 W KING TULL RD in PROSSER, WA)
COMPLIANCE ACTIVITY (Tracking inspections of insecticide, fungicide, and rodenticide, and toxic substances)
Housing units lacking complete plumbing facilities: 2.5% Housing units lacking complete kitchen facilities: 6.1%
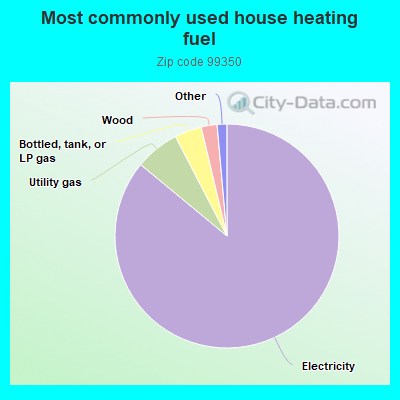
86.0%Electricity
6.4%Utility gas
3.9%Bottled, tank, or LP gas
2.3%Wood
0.8%Fuel oil, kerosene, etc.
0.6%No fuel used
Population in 1990: 9,714. Population change in the 1990s: +1,685 (+17.3%).
Place of birth for U.S.-born residents:
This state: 7,942
Northeast: 313
Midwest: 513
South: 891
West: 1,633
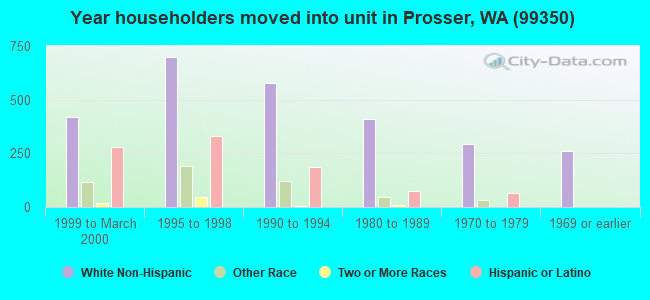
62% of the 99350 zip code residents lived in the same house 5 years ago. Out of people who lived in different houses, 57% lived in this county. Out of people who lived in different counties, 50% lived in Washington.
95% of the 99350 zip code residents lived in the same house 1 year ago. Out of people who lived in different houses, 48% moved from this county. Out of people who lived in different houses, 38% moved from different county within same state. Out of people who lived in different houses, 14% moved from different state. Out of people who lived in different houses, 12% moved from abroad.
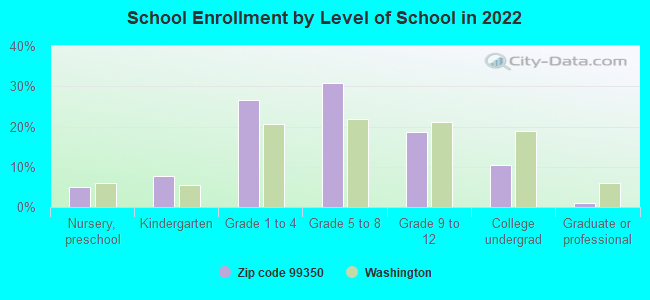
Private vs. public school enrollment:
Students in private schools in grades 1 to 8 (elementary and middle school): 295
Here:
12.9%
Washington:
12.4%
Students in private schools in grades 9 to 12 (high school): 1
Here:
0.1%
Washington:
9.2%
Students in private undergraduate colleges: 110
Here:
26.6%
Washington:
16.5%
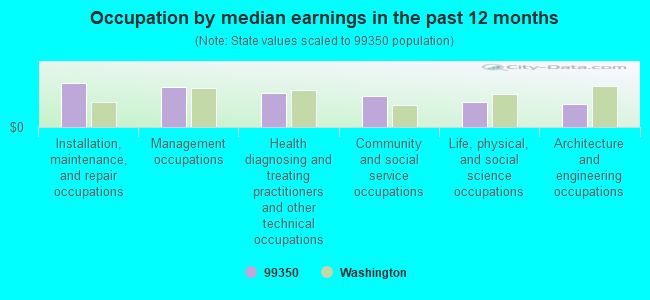
Occupation by median earnings in the past 12 months ($)
106,798Installation, maintenance, and repair occupations
96,613Management occupations
82,636Health diagnosing and treating practitioners and other technical occupations
75,303Community and social service occupations
60,590Life, physical, and social science occupations
55,788Architecture and engineering occupations
Companies with federal contracts located in this zip code:
PROSSER INN ASSOCIATES, LP (259 MERLOT DRIVE in PROSSER, WA; small business)
$8,904 with Army for Lodging - Hotel/Motel. Signed on 2006-07-09. Completion date: 2006-07-10.
Top industries in this zip code by the number of employees in 2005:
Health Care and Social Assistance: General Medical and Surgical Hospitals (100-249 employees: 1 establishment)
Administrative and Support and Waste Management and Remediation Services: Professional Employer Organizations (100-249: 1)
2002 - 2018 National Fire Incident Reporting System (NFIRS) incidents
Based on the data from the years 2002 - 2018 the average number of fires per year is 103. The highest number of reported fire incidents - 176 took place in 2007, and the least - 64 in 2010. The data has a declining trend.
When looking into fire subcategories, the most reports belonged to: Outside Fires (56.1%), and Structure Fires (23.2%).
Fire incident types reported to NFIRS in Zip Code 99350


 Nearest zip codes: 98930, 99320, 99345, 98944, 97844, 99353.


 Based on the data from the years 2002 - 2018 the average number of fires per year is 103. The highest number of reported fire incidents - 176 took place in 2007, and the least - 64 in 2010. The data has a declining trend.
 When looking into fire subcategories, the most reports belonged to: Outside Fires (56.1%), and Structure Fires (23.2%).