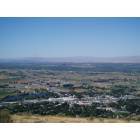
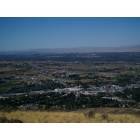
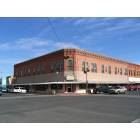
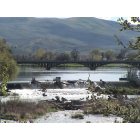
Prosser, Washington Submit your own pictures of this city and show them to the world
OSM Map
General Map
Google Map
MSN Map
OSM Map
General Map
Google Map
MSN Map
OSM Map
General Map
Google Map
MSN Map
OSM Map
General Map
Google Map
MSN Map
Please wait while loading the map...
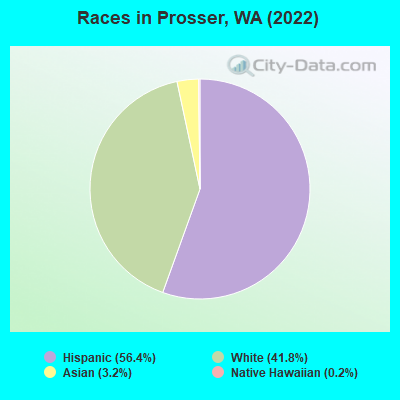
Population in 2022: 6,242 (98% urban, 2% rural). Population change since 2000: +29.0%Males: 2,970 Females: 3,272
March 2022 cost of living index in Prosser: 94.2 (less than average, U.S. average is 100) Percentage of residents living in poverty in 2022: 20.5%for White Non-Hispanic residents , 100.0% for Black residents , 24.3% for Hispanic or Latino residents , 32.8% for other race residents , 6.0% for two or more races residents )Business Search - 14 Million verified businesses
Data:
Median household income ($)
Median household income (% change since 2000)
Household income diversity
Ratio of average income to average house value (%)
Ratio of average income to average rent
Median household income ($) - White
Median household income ($) - Black or African American
Median household income ($) - Asian
Median household income ($) - Hispanic or Latino
Median household income ($) - American Indian and Alaska Native
Median household income ($) - Multirace
Median household income ($) - Other Race
Median household income for houses/condos with a mortgage ($)
Median household income for apartments without a mortgage ($)
Races - White alone (%)
Races - White alone (% change since 2000)
Races - Black alone (%)
Races - Black alone (% change since 2000)
Races - American Indian alone (%)
Races - American Indian alone (% change since 2000)
Races - Asian alone (%)
Races - Asian alone (% change since 2000)
Races - Hispanic (%)
Races - Hispanic (% change since 2000)
Races - Native Hawaiian and Other Pacific Islander alone (%)
Races - Native Hawaiian and Other Pacific Islander alone (% change since 2000)
Races - Two or more races (%)
Races - Two or more races (% change since 2000)
Races - Other race alone (%)
Races - Other race alone (% change since 2000)
Racial diversity
Unemployment (%)
Unemployment (% change since 2000)
Unemployment (%) - White
Unemployment (%) - Black or African American
Unemployment (%) - Asian
Unemployment (%) - Hispanic or Latino
Unemployment (%) - American Indian and Alaska Native
Unemployment (%) - Multirace
Unemployment (%) - Other Race
Population density (people per square mile)
Population - Males (%)
Population - Females (%)
Population - Males (%) - White
Population - Males (%) - Black or African American
Population - Males (%) - Asian
Population - Males (%) - Hispanic or Latino
Population - Males (%) - American Indian and Alaska Native
Population - Males (%) - Multirace
Population - Males (%) - Other Race
Population - Females (%) - White
Population - Females (%) - Black or African American
Population - Females (%) - Asian
Population - Females (%) - Hispanic or Latino
Population - Females (%) - American Indian and Alaska Native
Population - Females (%) - Multirace
Population - Females (%) - Other Race
Coronavirus confirmed cases (May 05, 2024)
Deaths caused by coronavirus (May 05, 2024)
Coronavirus confirmed cases (per 100k population) (May 05, 2024)
Deaths caused by coronavirus (per 100k population) (May 05, 2024)
Daily increase in number of cases (May 05, 2024)
Weekly increase in number of cases (May 05, 2024)
Cases doubled (in days) (May 05, 2024)
Hospitalized patients (Apr 18, 2022)
Negative test results (Apr 18, 2022)
Total test results (Apr 18, 2022)
COVID Vaccine doses distributed (per 100k population) (Sep 19, 2023)
COVID Vaccine doses administered (per 100k population) (Sep 19, 2023)
COVID Vaccine doses distributed (Sep 19, 2023)
COVID Vaccine doses administered (Sep 19, 2023)
Likely homosexual households (%)
Likely homosexual households (% change since 2000)
Likely homosexual households - Lesbian couples (%)
Likely homosexual households - Lesbian couples (% change since 2000)
Likely homosexual households - Gay men (%)
Likely homosexual households - Gay men (% change since 2000)
Cost of living index
Median gross rent ($)
Median contract rent ($)
Median monthly housing costs ($)
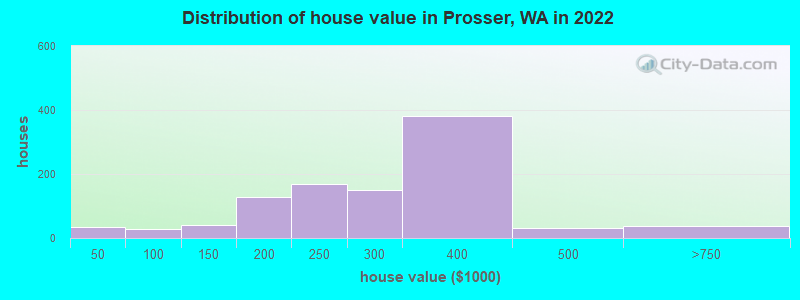
Median house or condo value ($)
Median house or condo value ($ change since 2000)
Mean house or condo value by units in structure - 1, detached ($)
Mean house or condo value by units in structure - 1, attached ($)
Mean house or condo value by units in structure - 2 ($)
Mean house or condo value by units in structure by units in structure - 3 or 4 ($)
Mean house or condo value by units in structure - 5 or more ($)
Mean house or condo value by units in structure - Boat, RV, van, etc. ($)
Mean house or condo value by units in structure - Mobile home ($)
Median house or condo value ($) - White
Median house or condo value ($) - Black or African American
Median house or condo value ($) - Asian
Median house or condo value ($) - Hispanic or Latino
Median house or condo value ($) - American Indian and Alaska Native
Median house or condo value ($) - Multirace
Median house or condo value ($) - Other Race
Median resident age
Resident age diversity
Median resident age - Males
Median resident age - Females
Median resident age - White
Median resident age - Black or African American
Median resident age - Asian
Median resident age - Hispanic or Latino
Median resident age - American Indian and Alaska Native
Median resident age - Multirace
Median resident age - Other Race
Median resident age - Males - White
Median resident age - Males - Black or African American
Median resident age - Males - Asian
Median resident age - Males - Hispanic or Latino
Median resident age - Males - American Indian and Alaska Native
Median resident age - Males - Multirace
Median resident age - Males - Other Race
Median resident age - Females - White
Median resident age - Females - Black or African American
Median resident age - Females - Asian
Median resident age - Females - Hispanic or Latino
Median resident age - Females - American Indian and Alaska Native
Median resident age - Females - Multirace
Median resident age - Females - Other Race
Commute - mean travel time to work (minutes)
Travel time to work - Less than 5 minutes (%)
Travel time to work - Less than 5 minutes (% change since 2000)
Travel time to work - 5 to 9 minutes (%)
Travel time to work - 5 to 9 minutes (% change since 2000)
Travel time to work - 10 to 19 minutes (%)
Travel time to work - 10 to 19 minutes (% change since 2000)
Travel time to work - 20 to 29 minutes (%)
Travel time to work - 20 to 29 minutes (% change since 2000)
Travel time to work - 30 to 39 minutes (%)
Travel time to work - 30 to 39 minutes (% change since 2000)
Travel time to work - 40 to 59 minutes (%)
Travel time to work - 40 to 59 minutes (% change since 2000)
Travel time to work - 60 to 89 minutes (%)
Travel time to work - 60 to 89 minutes (% change since 2000)
Travel time to work - 90 or more minutes (%)
Travel time to work - 90 or more minutes (% change since 2000)
Marital status - Never married (%)
Marital status - Now married (%)
Marital status - Separated (%)
Marital status - Widowed (%)
Marital status - Divorced (%)
Median family income ($)
Median family income (% change since 2000)
Median non-family income ($)
Median non-family income (% change since 2000)
Median per capita income ($)
Median per capita income (% change since 2000)
Median family income ($) - White
Median family income ($) - Black or African American
Median family income ($) - Asian
Median family income ($) - Hispanic or Latino
Median family income ($) - American Indian and Alaska Native
Median family income ($) - Multirace
Median family income ($) - Other Race
Median year house/condo built
Median year apartment built
Year house built - Built 2005 or later (%)
Year house built - Built 2000 to 2004 (%)
Year house built - Built 1990 to 1999 (%)
Year house built - Built 1980 to 1989 (%)
Year house built - Built 1970 to 1979 (%)
Year house built - Built 1960 to 1969 (%)
Year house built - Built 1950 to 1959 (%)
Year house built - Built 1940 to 1949 (%)
Year house built - Built 1939 or earlier (%)
Average household size
Household density (households per square mile)
Average household size - White
Average household size - Black or African American
Average household size - Asian
Average household size - Hispanic or Latino
Average household size - American Indian and Alaska Native
Average household size - Multirace
Average household size - Other Race
Occupied housing units (%)
Vacant housing units (%)
Owner occupied housing units (%)
Renter occupied housing units (%)
Vacancy status - For rent (%)
Vacancy status - For sale only (%)
Vacancy status - Rented or sold, not occupied (%)
Vacancy status - For seasonal, recreational, or occasional use (%)
Vacancy status - For migrant workers (%)
Vacancy status - Other vacant (%)
Residents with income below the poverty level (%)
Residents with income below 50% of the poverty level (%)
Children below poverty level (%)
Poor families by family type - Married-couple family (%)
Poor families by family type - Male, no wife present (%)
Poor families by family type - Female, no husband present (%)
Poverty status for native-born residents (%)
Poverty status for foreign-born residents (%)
Poverty among high school graduates not in families (%)
Poverty among people who did not graduate high school not in families (%)
Residents with income below the poverty level (%) - White
Residents with income below the poverty level (%) - Black or African American
Residents with income below the poverty level (%) - Asian
Residents with income below the poverty level (%) - Hispanic or Latino
Residents with income below the poverty level (%) - American Indian and Alaska Native
Residents with income below the poverty level (%) - Multirace
Residents with income below the poverty level (%) - Other Race
Air pollution - Air Quality Index (AQI)
Air pollution - CO
Air pollution - NO2
Air pollution - SO2
Air pollution - Ozone
Air pollution - PM10
Air pollution - PM25
Air pollution - Pb
Crime - Murders per 100,000 population
Crime - Rapes per 100,000 population
Crime - Robberies per 100,000 population
Crime - Assaults per 100,000 population
Crime - Burglaries per 100,000 population
Crime - Thefts per 100,000 population
Crime - Auto thefts per 100,000 population
Crime - Arson per 100,000 population
Crime - City-data.com crime index
Crime - Violent crime index
Crime - Property crime index
Crime - Murders per 100,000 population (5 year average)
Crime - Rapes per 100,000 population (5 year average)
Crime - Robberies per 100,000 population (5 year average)
Crime - Assaults per 100,000 population (5 year average)
Crime - Burglaries per 100,000 population (5 year average)
Crime - Thefts per 100,000 population (5 year average)
Crime - Auto thefts per 100,000 population (5 year average)
Crime - Arson per 100,000 population (5 year average)
Crime - City-data.com crime index (5 year average)
Crime - Violent crime index (5 year average)
Crime - Property crime index (5 year average)
1996 Presidential Elections Results (%) - Democratic Party (Clinton)
1996 Presidential Elections Results (%) - Republican Party (Dole)
1996 Presidential Elections Results (%) - Other
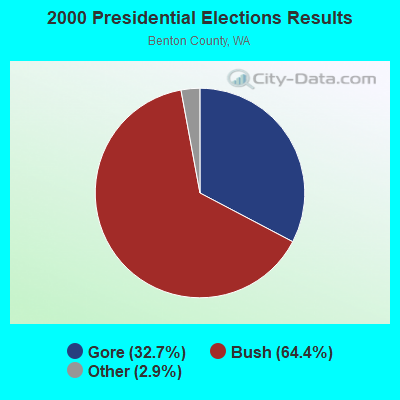
2000 Presidential Elections Results (%) - Democratic Party (Gore)
2000 Presidential Elections Results (%) - Republican Party (Bush)
2000 Presidential Elections Results (%) - Other
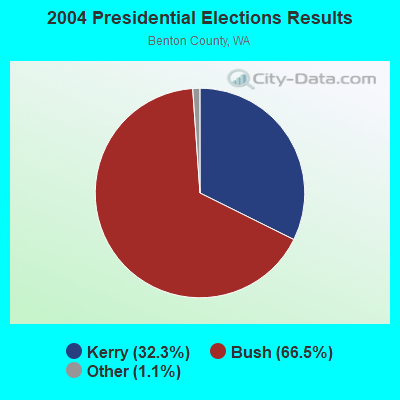
2004 Presidential Elections Results (%) - Democratic Party (Kerry)
2004 Presidential Elections Results (%) - Republican Party (Bush)
2004 Presidential Elections Results (%) - Other
2008 Presidential Elections Results (%) - Democratic Party (Obama)
2008 Presidential Elections Results (%) - Republican Party (McCain)
2008 Presidential Elections Results (%) - Other
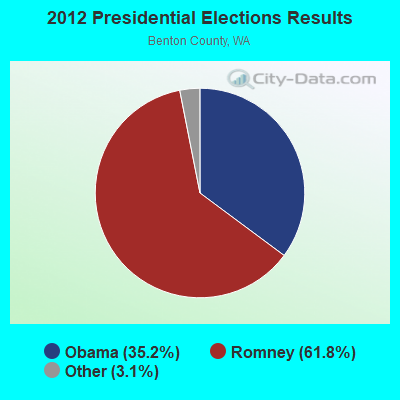
2012 Presidential Elections Results (%) - Democratic Party (Obama)
2012 Presidential Elections Results (%) - Republican Party (Romney)
2012 Presidential Elections Results (%) - Other
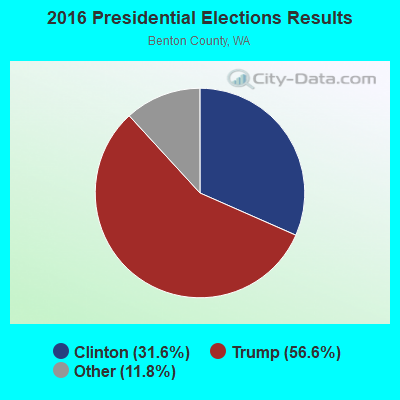
2016 Presidential Elections Results (%) - Democratic Party (Clinton)
2016 Presidential Elections Results (%) - Republican Party (Trump)
2016 Presidential Elections Results (%) - Other
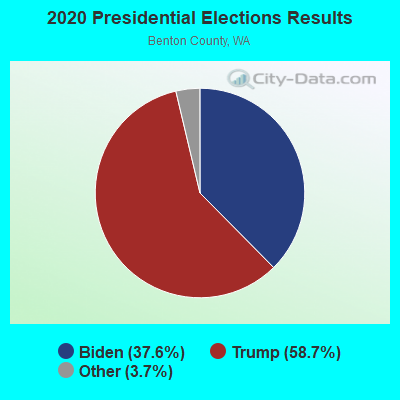
2020 Presidential Elections Results (%) - Democratic Party (Biden)
2020 Presidential Elections Results (%) - Republican Party (Trump)
2020 Presidential Elections Results (%) - Other
Ancestries Reported - Arab (%)
Ancestries Reported - Czech (%)
Ancestries Reported - Danish (%)
Ancestries Reported - Dutch (%)
Ancestries Reported - English (%)
Ancestries Reported - French (%)
Ancestries Reported - French Canadian (%)
Ancestries Reported - German (%)
Ancestries Reported - Greek (%)
Ancestries Reported - Hungarian (%)
Ancestries Reported - Irish (%)
Ancestries Reported - Italian (%)
Ancestries Reported - Lithuanian (%)
Ancestries Reported - Norwegian (%)
Ancestries Reported - Polish (%)
Ancestries Reported - Portuguese (%)
Ancestries Reported - Russian (%)
Ancestries Reported - Scotch-Irish (%)
Ancestries Reported - Scottish (%)
Ancestries Reported - Slovak (%)
Ancestries Reported - Subsaharan African (%)
Ancestries Reported - Swedish (%)
Ancestries Reported - Swiss (%)
Ancestries Reported - Ukrainian (%)
Ancestries Reported - United States (%)
Ancestries Reported - Welsh (%)
Ancestries Reported - West Indian (%)
Ancestries Reported - Other (%)
Educational Attainment - No schooling completed (%)
Educational Attainment - Less than high school (%)
Educational Attainment - High school or equivalent (%)
Educational Attainment - Less than 1 year of college (%)
Educational Attainment - 1 or more years of college (%)
Educational Attainment - Associate degree (%)
Educational Attainment - Bachelor's degree (%)
Educational Attainment - Master's degree (%)
Educational Attainment - Professional school degree (%)
Educational Attainment - Doctorate degree (%)
School Enrollment - Nursery, preschool (%)
School Enrollment - Kindergarten (%)
School Enrollment - Grade 1 to 4 (%)
School Enrollment - Grade 5 to 8 (%)
School Enrollment - Grade 9 to 12 (%)
School Enrollment - College undergrad (%)
School Enrollment - Graduate or professional (%)
School Enrollment - Not enrolled in school (%)
School enrollment - Public schools (%)
School enrollment - Private schools (%)
School enrollment - Not enrolled (%)
Median number of rooms in houses and condos
Median number of rooms in apartments
Housing units lacking complete plumbing facilities (%)
Housing units lacking complete kitchen facilities (%)
Density of houses
Urban houses (%)
Rural houses (%)
Households with people 60 years and over (%)
Households with people 65 years and over (%)
Households with people 75 years and over (%)
Households with one or more nonrelatives (%)
Households with no nonrelatives (%)
Population in households (%)
Family households (%)
Nonfamily households (%)
Population in families (%)
Family households with own children (%)
Median number of bedrooms in owner occupied houses
Mean number of bedrooms in owner occupied houses
Median number of bedrooms in renter occupied houses
Mean number of bedrooms in renter occupied houses
Median number of vehichles in owner occupied houses
Mean number of vehichles in owner occupied houses
Median number of vehichles in renter occupied houses
Mean number of vehichles in renter occupied houses
Mortgage status - with mortgage (%)
Mortgage status - with second mortgage (%)
Mortgage status - with home equity loan (%)
Mortgage status - with both second mortgage and home equity loan (%)
Mortgage status - without a mortgage (%)
Average family size
Average family size - White
Average family size - Black or African American
Average family size - Asian
Average family size - Hispanic or Latino
Average family size - American Indian and Alaska Native
Average family size - Multirace
Average family size - Other Race
Geographical mobility - Same house 1 year ago (%)
Geographical mobility - Moved within same county (%)
Geographical mobility - Moved from different county within same state (%)
Geographical mobility - Moved from different state (%)
Geographical mobility - Moved from abroad (%)
Place of birth - Born in state of residence (%)
Place of birth - Born in other state (%)
Place of birth - Native, outside of US (%)
Place of birth - Foreign born (%)
Housing units in structures - 1, detached (%)
Housing units in structures - 1, attached (%)
Housing units in structures - 2 (%)
Housing units in structures - 3 or 4 (%)
Housing units in structures - 5 to 9 (%)
Housing units in structures - 10 to 19 (%)
Housing units in structures - 20 to 49 (%)
Housing units in structures - 50 or more (%)
Housing units in structures - Mobile home (%)
Housing units in structures - Boat, RV, van, etc. (%)
House/condo owner moved in on average (years ago)
Renter moved in on average (years ago)
Year householder moved into unit - Moved in 1999 to March 2000 (%)
Year householder moved into unit - Moved in 1995 to 1998 (%)
Year householder moved into unit - Moved in 1990 to 1994 (%)
Year householder moved into unit - Moved in 1980 to 1989 (%)
Year householder moved into unit - Moved in 1970 to 1979 (%)
Year householder moved into unit - Moved in 1969 or earlier (%)
Means of transportation to work - Drove car alone (%)
Means of transportation to work - Carpooled (%)
Means of transportation to work - Public transportation (%)
Means of transportation to work - Bus or trolley bus (%)
Means of transportation to work - Streetcar or trolley car (%)
Means of transportation to work - Subway or elevated (%)
Means of transportation to work - Railroad (%)
Means of transportation to work - Ferryboat (%)
Means of transportation to work - Taxicab (%)
Means of transportation to work - Motorcycle (%)
Means of transportation to work - Bicycle (%)
Means of transportation to work - Walked (%)
Means of transportation to work - Other means (%)
Working at home (%)
Industry diversity
Most Common Industries - Agriculture, forestry, fishing and hunting, and mining (%)
Most Common Industries - Agriculture, forestry, fishing and hunting (%)
Most Common Industries - Mining, quarrying, and oil and gas extraction (%)
Most Common Industries - Construction (%)
Most Common Industries - Manufacturing (%)
Most Common Industries - Wholesale trade (%)
Most Common Industries - Retail trade (%)
Most Common Industries - Transportation and warehousing, and utilities (%)
Most Common Industries - Transportation and warehousing (%)
Most Common Industries - Utilities (%)
Most Common Industries - Information (%)
Most Common Industries - Finance and insurance, and real estate and rental and leasing (%)
Most Common Industries - Finance and insurance (%)
Most Common Industries - Real estate and rental and leasing (%)
Most Common Industries - Professional, scientific, and management, and administrative and waste management services (%)
Most Common Industries - Professional, scientific, and technical services (%)
Most Common Industries - Management of companies and enterprises (%)
Most Common Industries - Administrative and support and waste management services (%)
Most Common Industries - Educational services, and health care and social assistance (%)
Most Common Industries - Educational services (%)
Most Common Industries - Health care and social assistance (%)
Most Common Industries - Arts, entertainment, and recreation, and accommodation and food services (%)
Most Common Industries - Arts, entertainment, and recreation (%)
Most Common Industries - Accommodation and food services (%)
Most Common Industries - Other services, except public administration (%)
Most Common Industries - Public administration (%)
Occupation diversity
Most Common Occupations - Management, business, science, and arts occupations (%)
Most Common Occupations - Management, business, and financial occupations (%)
Most Common Occupations - Management occupations (%)
Most Common Occupations - Business and financial operations occupations (%)
Most Common Occupations - Computer, engineering, and science occupations (%)
Most Common Occupations - Computer and mathematical occupations (%)
Most Common Occupations - Architecture and engineering occupations (%)
Most Common Occupations - Life, physical, and social science occupations (%)
Most Common Occupations - Education, legal, community service, arts, and media occupations (%)
Most Common Occupations - Community and social service occupations (%)
Most Common Occupations - Legal occupations (%)
Most Common Occupations - Education, training, and library occupations (%)
Most Common Occupations - Arts, design, entertainment, sports, and media occupations (%)
Most Common Occupations - Healthcare practitioners and technical occupations (%)
Most Common Occupations - Health diagnosing and treating practitioners and other technical occupations (%)
Most Common Occupations - Health technologists and technicians (%)
Most Common Occupations - Service occupations (%)
Most Common Occupations - Healthcare support occupations (%)
Most Common Occupations - Protective service occupations (%)
Most Common Occupations - Fire fighting and prevention, and other protective service workers including supervisors (%)
Most Common Occupations - Law enforcement workers including supervisors (%)
Most Common Occupations - Food preparation and serving related occupations (%)
Most Common Occupations - Building and grounds cleaning and maintenance occupations (%)
Most Common Occupations - Personal care and service occupations (%)
Most Common Occupations - Sales and office occupations (%)
Most Common Occupations - Sales and related occupations (%)
Most Common Occupations - Office and administrative support occupations (%)
Most Common Occupations - Natural resources, construction, and maintenance occupations (%)
Most Common Occupations - Farming, fishing, and forestry occupations (%)
Most Common Occupations - Construction and extraction occupations (%)
Most Common Occupations - Installation, maintenance, and repair occupations (%)
Most Common Occupations - Production, transportation, and material moving occupations (%)
Most Common Occupations - Production occupations (%)
Most Common Occupations - Transportation occupations (%)
Most Common Occupations - Material moving occupations (%)
People in Group quarters - Institutionalized population (%)
People in Group quarters - Correctional institutions (%)
People in Group quarters - Federal prisons and detention centers (%)
People in Group quarters - Halfway houses (%)
People in Group quarters - Local jails and other confinement facilities (including police lockups) (%)
People in Group quarters - Military disciplinary barracks (%)
People in Group quarters - State prisons (%)
People in Group quarters - Other types of correctional institutions (%)
People in Group quarters - Nursing homes (%)
People in Group quarters - Hospitals/wards, hospices, and schools for the handicapped (%)
People in Group quarters - Hospitals/wards and hospices for chronically ill (%)
People in Group quarters - Hospices or homes for chronically ill (%)
People in Group quarters - Military hospitals or wards for chronically ill (%)
People in Group quarters - Other hospitals or wards for chronically ill (%)
People in Group quarters - Hospitals or wards for drug/alcohol abuse (%)
People in Group quarters - Mental (Psychiatric) hospitals or wards (%)
People in Group quarters - Schools, hospitals, or wards for the mentally retarded (%)
People in Group quarters - Schools, hospitals, or wards for the physically handicapped (%)
People in Group quarters - Institutions for the deaf (%)
People in Group quarters - Institutions for the blind (%)
People in Group quarters - Orthopedic wards and institutions for the physically handicapped (%)
People in Group quarters - Wards in general hospitals for patients who have no usual home elsewhere (%)
People in Group quarters - Wards in military hospitals for patients who have no usual home elsewhere (%)
People in Group quarters - Juvenile institutions (%)
People in Group quarters - Long-term care (%)
People in Group quarters - Homes for abused, dependent, and neglected children (%)
People in Group quarters - Residential treatment centers for emotionally disturbed children (%)
People in Group quarters - Training schools for juvenile delinquents (%)
People in Group quarters - Short-term care, detention or diagnostic centers for delinquent children (%)
People in Group quarters - Type of juvenile institution unknown (%)
People in Group quarters - Noninstitutionalized population (%)
People in Group quarters - College dormitories (includes college quarters off campus) (%)
People in Group quarters - Military quarters (%)
People in Group quarters - On base (%)
People in Group quarters - Barracks, unaccompanied personnel housing (UPH), (Enlisted/Officer), ;and similar group living quarters for military personnel (%)
People in Group quarters - Transient quarters for temporary residents (%)
People in Group quarters - Military ships (%)
People in Group quarters - Group homes (%)
People in Group quarters - Homes or halfway houses for drug/alcohol abuse (%)
People in Group quarters - Homes for the mentally ill (%)
People in Group quarters - Homes for the mentally retarded (%)
People in Group quarters - Homes for the physically handicapped (%)
People in Group quarters - Other group homes (%)
People in Group quarters - Religious group quarters (%)
People in Group quarters - Dormitories (%)
People in Group quarters - Agriculture workers' dormitories on farms (%)
People in Group quarters - Job Corps and vocational training facilities (%)
People in Group quarters - Other workers' dormitories (%)
People in Group quarters - Crews of maritime vessels (%)
People in Group quarters - Other nonhousehold living situations (%)
People in Group quarters - Other noninstitutional group quarters (%)
Residents speaking English at home (%)
Residents speaking English at home - Born in the United States (%)
Residents speaking English at home - Native, born elsewhere (%)
Residents speaking English at home - Foreign born (%)
Residents speaking Spanish at home (%)
Residents speaking Spanish at home - Born in the United States (%)
Residents speaking Spanish at home - Native, born elsewhere (%)
Residents speaking Spanish at home - Foreign born (%)
Residents speaking other language at home (%)
Residents speaking other language at home - Born in the United States (%)
Residents speaking other language at home - Native, born elsewhere (%)
Residents speaking other language at home - Foreign born (%)
Class of Workers - Employee of private company (%)
Class of Workers - Self-employed in own incorporated business (%)
Class of Workers - Private not-for-profit wage and salary workers (%)
Class of Workers - Local government workers (%)
Class of Workers - State government workers (%)
Class of Workers - Federal government workers (%)
Class of Workers - Self-employed workers in own not incorporated business and Unpaid family workers (%)
House heating fuel used in houses and condos - Utility gas (%)
House heating fuel used in houses and condos - Bottled, tank, or LP gas (%)
House heating fuel used in houses and condos - Electricity (%)
House heating fuel used in houses and condos - Fuel oil, kerosene, etc. (%)
House heating fuel used in houses and condos - Coal or coke (%)
House heating fuel used in houses and condos - Wood (%)
House heating fuel used in houses and condos - Solar energy (%)
House heating fuel used in houses and condos - Other fuel (%)
House heating fuel used in houses and condos - No fuel used (%)
House heating fuel used in apartments - Utility gas (%)
House heating fuel used in apartments - Bottled, tank, or LP gas (%)
House heating fuel used in apartments - Electricity (%)
House heating fuel used in apartments - Fuel oil, kerosene, etc. (%)
House heating fuel used in apartments - Coal or coke (%)
House heating fuel used in apartments - Wood (%)
House heating fuel used in apartments - Solar energy (%)
House heating fuel used in apartments - Other fuel (%)
House heating fuel used in apartments - No fuel used (%)
Armed forces status - In Armed Forces (%)
Armed forces status - Civilian (%)
Armed forces status - Civilian - Veteran (%)
Armed forces status - Civilian - Nonveteran (%)
Fatal accidents locations in years 2005-2021
Fatal accidents locations in 2005
Fatal accidents locations in 2006
Fatal accidents locations in 2007
Fatal accidents locations in 2008
Fatal accidents locations in 2009
Fatal accidents locations in 2010
Fatal accidents locations in 2011
Fatal accidents locations in 2012
Fatal accidents locations in 2013
Fatal accidents locations in 2014
Fatal accidents locations in 2015
Fatal accidents locations in 2016
Fatal accidents locations in 2017
Fatal accidents locations in 2018
Fatal accidents locations in 2019
Fatal accidents locations in 2020
Fatal accidents locations in 2021
Alcohol use - People drinking some alcohol every month (%)
Alcohol use - People not drinking at all (%)
Alcohol use - Average days/month drinking alcohol
Alcohol use - Average drinks/week
Alcohol use - Average days/year people drink much
Audiometry - Average condition of hearing (%)
Audiometry - People that can hear a whisper from across a quiet room (%)
Audiometry - People that can hear normal voice from across a quiet room (%)
Audiometry - Ears ringing, roaring, buzzing (%)
Audiometry - Had a job exposure to loud noise (%)
Audiometry - Had off-work exposure to loud noise (%)
Blood Pressure & Cholesterol - Has high blood pressure (%)
Blood Pressure & Cholesterol - Checking blood pressure at home (%)
Blood Pressure & Cholesterol - Frequently checking blood cholesterol (%)
Blood Pressure & Cholesterol - Has high cholesterol level (%)
Consumer Behavior - Money monthly spent on food at supermarket/grocery store
Consumer Behavior - Money monthly spent on food at other stores
Consumer Behavior - Money monthly spent on eating out
Consumer Behavior - Money monthly spent on carryout/delivered foods
Consumer Behavior - Income spent on food at supermarket/grocery store (%)
Consumer Behavior - Income spent on food at other stores (%)
Consumer Behavior - Income spent on eating out (%)
Consumer Behavior - Income spent on carryout/delivered foods (%)
Current Health Status - General health condition (%)
Current Health Status - Blood donors (%)
Current Health Status - Has blood ever tested for HIV virus (%)
Current Health Status - Left-handed people (%)
Dermatology - People using sunscreen (%)
Diabetes - Diabetics (%)
Diabetes - Had a blood test for high blood sugar (%)
Diabetes - People taking insulin (%)
Diet Behavior & Nutrition - Diet health (%)
Diet Behavior & Nutrition - Milk product consumption (# of products/month)
Diet Behavior & Nutrition - Meals not home prepared (#/week)
Diet Behavior & Nutrition - Meals from fast food or pizza place (#/week)
Diet Behavior & Nutrition - Ready-to-eat foods (#/month)
Diet Behavior & Nutrition - Frozen meals/pizza (#/month)
Drug Use - People that ever used marijuana or hashish (%)
Drug Use - Ever used hard drugs (%)
Drug Use - Ever used any form of cocaine (%)
Drug Use - Ever used heroin (%)
Drug Use - Ever used methamphetamine (%)
Health Insurance - People covered by health insurance (%)
Kidney Conditions-Urology - Avg. # of times urinating at night
Medical Conditions - People with asthma (%)
Medical Conditions - People with anemia (%)
Medical Conditions - People with psoriasis (%)
Medical Conditions - People with overweight (%)
Medical Conditions - Elderly people having difficulties in thinking or remembering (%)
Medical Conditions - People who ever received blood transfusion (%)
Medical Conditions - People having trouble seeing even with glass/contacts (%)
Medical Conditions - People with arthritis (%)
Medical Conditions - People with gout (%)
Medical Conditions - People with congestive heart failure (%)
Medical Conditions - People with coronary heart disease (%)
Medical Conditions - People with angina pectoris (%)
Medical Conditions - People who ever had heart attack (%)
Medical Conditions - People who ever had stroke (%)
Medical Conditions - People with emphysema (%)
Medical Conditions - People with thyroid problem (%)
Medical Conditions - People with chronic bronchitis (%)
Medical Conditions - People with any liver condition (%)
Medical Conditions - People who ever had cancer or malignancy (%)
Mental Health - People who have little interest in doing things (%)
Mental Health - People feeling down, depressed, or hopeless (%)
Mental Health - People who have trouble sleeping or sleeping too much (%)
Mental Health - People feeling tired or having little energy (%)
Mental Health - People with poor appetite or overeating (%)
Mental Health - People feeling bad about themself (%)
Mental Health - People who have trouble concentrating on things (%)
Mental Health - People moving or speaking slowly or too fast (%)
Mental Health - People having thoughts they would be better off dead (%)
Oral Health - Average years since last visit a dentist
Oral Health - People embarrassed because of mouth (%)
Oral Health - People with gum disease (%)
Oral Health - General health of teeth and gums (%)
Oral Health - Average days a week using dental floss/device
Oral Health - Average days a week using mouthwash for dental problem
Oral Health - Average number of teeth
Pesticide Use - Households using pesticides to control insects (%)
Pesticide Use - Households using pesticides to kill weeds (%)
Physical Activity - People doing vigorous-intensity work activities (%)
Physical Activity - People doing moderate-intensity work activities (%)
Physical Activity - People walking or bicycling (%)
Physical Activity - People doing vigorous-intensity recreational activities (%)
Physical Activity - People doing moderate-intensity recreational activities (%)
Physical Activity - Average hours a day doing sedentary activities
Physical Activity - Average hours a day watching TV or videos
Physical Activity - Average hours a day using computer
Physical Functioning - People having limitations keeping them from working (%)
Physical Functioning - People limited in amount of work they can do (%)
Physical Functioning - People that need special equipment to walk (%)
Physical Functioning - People experiencing confusion/memory problems (%)
Physical Functioning - People requiring special healthcare equipment (%)
Prescription Medications - Average number of prescription medicines taking
Preventive Aspirin Use - Adults 40+ taking low-dose aspirin (%)
Reproductive Health - Vaginal deliveries (%)
Reproductive Health - Cesarean deliveries (%)
Reproductive Health - Deliveries resulted in a live birth (%)
Reproductive Health - Pregnancies resulted in a delivery (%)
Reproductive Health - Women breastfeeding newborns (%)
Reproductive Health - Women that had a hysterectomy (%)
Reproductive Health - Women that had both ovaries removed (%)
Reproductive Health - Women that have ever taken birth control pills (%)
Reproductive Health - Women taking birth control pills (%)
Reproductive Health - Women that have ever used Depo-Provera or injectables (%)
Reproductive Health - Women that have ever used female hormones (%)
Sexual Behavior - People 18+ that ever had sex (vaginal, anal, or oral) (%)
Sexual Behavior - Males 18+ that ever had vaginal sex with a woman (%)
Sexual Behavior - Males 18+ that ever performed oral sex on a woman (%)
Sexual Behavior - Males 18+ that ever had anal sex with a woman (%)
Sexual Behavior - Males 18+ that ever had any sex with a man (%)
Sexual Behavior - Females 18+ that ever had vaginal sex with a man (%)
Sexual Behavior - Females 18+ that ever performed oral sex on a man (%)
Sexual Behavior - Females 18+ that ever had anal sex with a man (%)
Sexual Behavior - Females 18+ that ever had any kind of sex with a woman (%)
Sexual Behavior - Average age people first had sex
Sexual Behavior - Average number of female sex partners in lifetime (males 18+)
Sexual Behavior - Average number of female vaginal sex partners in lifetime (males 18+)
Sexual Behavior - Average age people first performed oral sex on a woman (18+)
Sexual Behavior - Average number of woman performed oral sex on in lifetime (18+)
Sexual Behavior - Average number of male sex partners in lifetime (males 18+)
Sexual Behavior - Average number of male anal sex partners in lifetime (males 18+)
Sexual Behavior - Average age people first performed oral sex on a man (18+)
Sexual Behavior - Average number of male oral sex partners in lifetime (18+)
Sexual Behavior - People using protection when performing oral sex (%)
Sexual Behavior - Average number of times people have vaginal or anal sex a year
Sexual Behavior - People having sex without condom (%)
Sexual Behavior - Average number of male sex partners in lifetime (females 18+)
Sexual Behavior - Average number of male vaginal sex partners in lifetime (females 18+)
Sexual Behavior - Average number of female sex partners in lifetime (females 18+)
Sexual Behavior - Circumcised males 18+ (%)
Sleep Disorders - Average hours sleeping at night
Sleep Disorders - People that has trouble sleeping (%)
Smoking-Cigarette Use - People smoking cigarettes (%)
Taste & Smell - People 40+ having problems with smell (%)
Taste & Smell - People 40+ having problems with taste (%)
Taste & Smell - People 40+ that ever had wisdom teeth removed (%)
Taste & Smell - People 40+ that ever had tonsils teeth removed (%)
Taste & Smell - People 40+ that ever had a loss of consciousness because of a head injury (%)
Taste & Smell - People 40+ that ever had a broken nose or other serious injury to face or skull (%)
Taste & Smell - People 40+ that ever had two or more sinus infections (%)
Weight - Average height (inches)
Weight - Average weight (pounds)
Weight - Average BMI
Weight - People that are obese (%)
Weight - People that ever were obese (%)
Weight - People trying to lose weight (%)
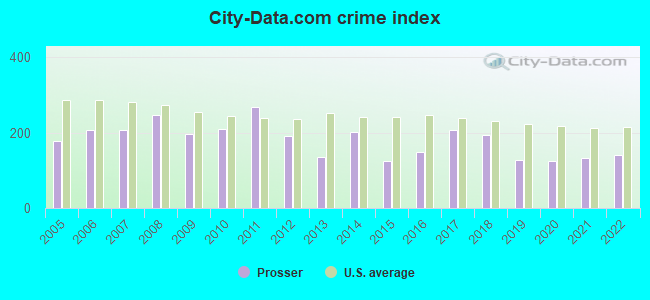
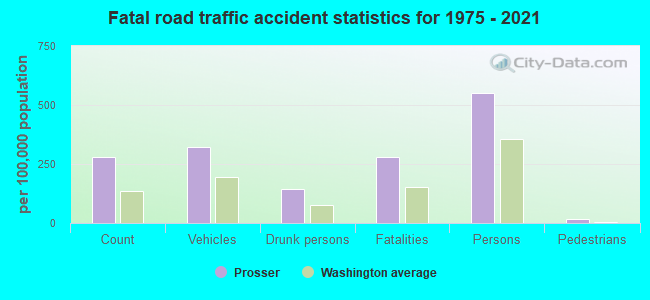
Officers per 1,000 residents here:
1.70Washington average:
1.35
Latest news from Prosser, WA collected exclusively by city-data.com from local newspapers, TV, and radio stations
Ancestries: English (8.4%), American (4.8%), German (3.3%), French (2.9%), European (2.7%), Dutch (2.4%).
Current Local Time:
Land area: 4.30 square miles.
Population density: 1,452 people per square mile (low).
1,060 residents are foreign born (14.5% Latin America , 1.9% Asia ).
This city:
16.8%Washington:
14.9%
Median real estate property taxes paid for housing units with mortgages in 2022: $2,583 (0.9%)Median real estate property taxes paid for housing units with no mortgage in 2022: $2,307 (0.8%)
Nearest city with pop. 50,000+: Kennewick, WA
Nearest city with pop. 200,000+: Portland, OR
Nearest city with pop. 1,000,000+: Los Angeles, CA
Nearest cities:
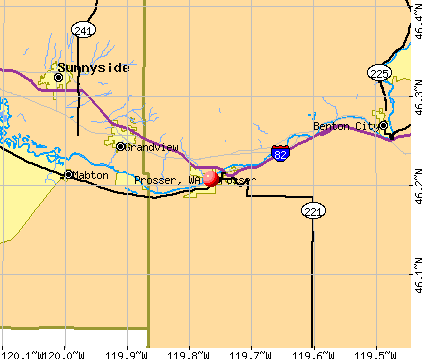
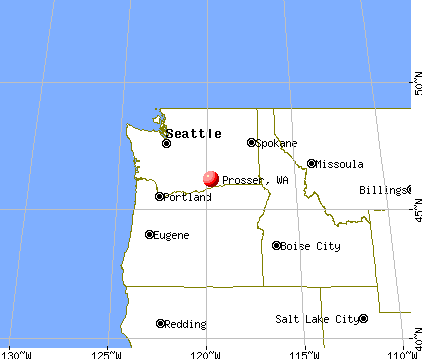
Latitude: 46.21 N, Longitude: 119.77 W
Daytime population change due to commuting: +306 (+4.9%)Workers who live and work in this city: 1,097 (42.5%)
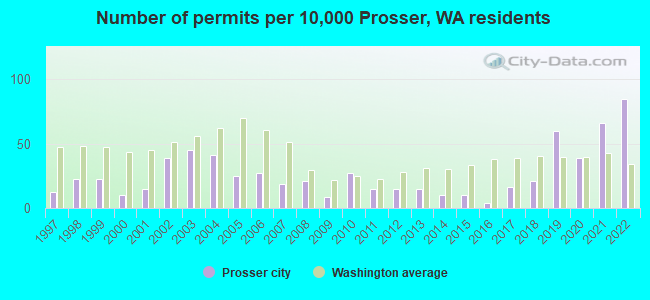
Single-family new house construction building permits:
2022: 41 buildings , average cost: $327,4002021: 32 buildings , average cost: $278,5002020: 19 buildings , average cost: $273,4002019: 29 buildings , average cost: $258,2002018: 10 buildings , average cost: $282,2002017: 8 buildings , average cost: $225,3002016: 2 buildings , average cost: $300,5002015: 5 buildings , average cost: $199,5002014: 5 buildings , average cost: $159,3002013: 7 buildings , average cost: $178,8002012: 7 buildings , average cost: $171,3002011: 7 buildings , average cost: $141,7002010: 13 buildings , average cost: $175,9002009: 4 buildings , average cost: $182,4002008: 10 buildings , average cost: $217,5002007: 9 buildings , average cost: $290,0002006: 13 buildings , average cost: $218,2002005: 12 buildings , average cost: $210,7002004: 20 buildings , average cost: $142,7002003: 22 buildings , average cost: $150,1002002: 19 buildings , average cost: $138,2002001: 7 buildings , average cost: $156,7002000: 5 buildings , average cost: $128,0001999: 11 buildings , average cost: $118,3001998: 11 buildings , average cost: $109,4001997: 6 buildings , average cost: $88,200Unemployment in December 2023:
Population change in the 1990s: +308 (+6.8%).
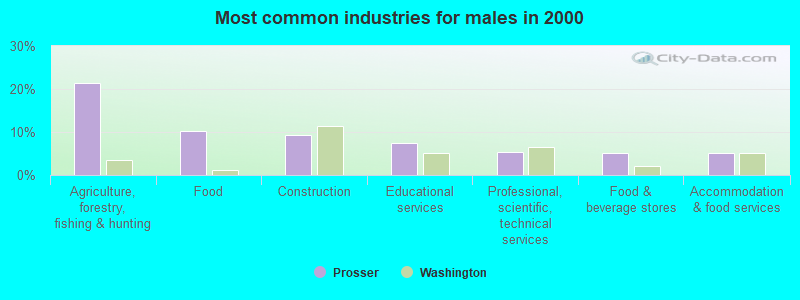
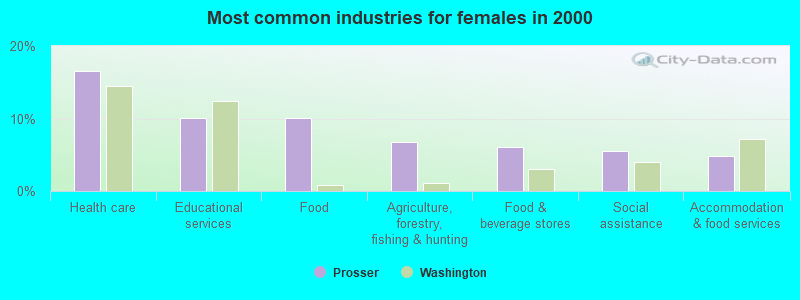
Most common industries in Prosser, WA (%)
Both Males Females
Agriculture, forestry, fishing & hunting (14.6%)
Food (10.2%)
Health care (8.7%)
Educational services (8.6%)
Construction (6.2%)
Food & beverage stores (5.5%)
Professional, scientific, technical services (5.0%)
Agriculture, forestry, fishing & hunting (21.4%)
Food (10.3%)
Construction (9.3%)
Educational services (7.3%)
Professional, scientific, technical services (5.3%)
Food & beverage stores (5.1%)
Accommodation & food services (5.1%)
Health care (16.6%)
Educational services (10.1%)
Food (10.0%)
Agriculture, forestry, fishing & hunting (6.7%)
Food & beverage stores (6.0%)
Social assistance (5.5%)
Accommodation & food services (4.8%)
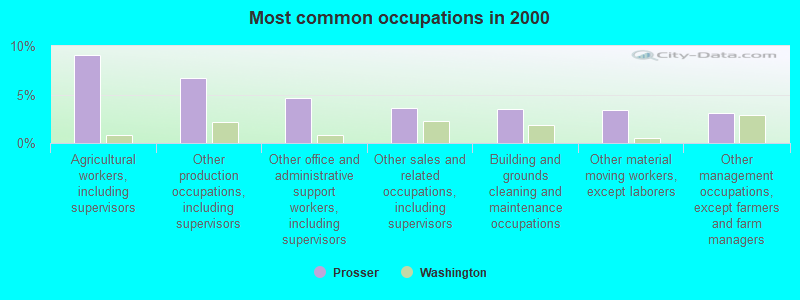
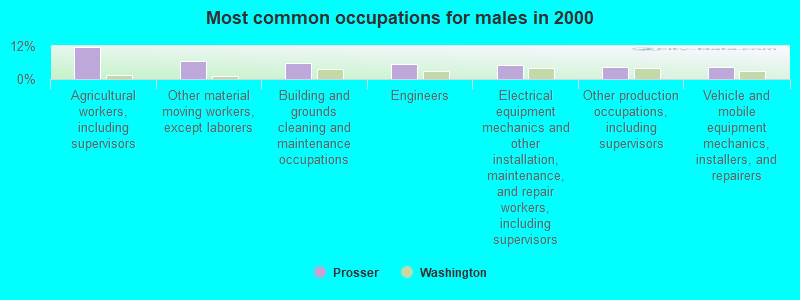
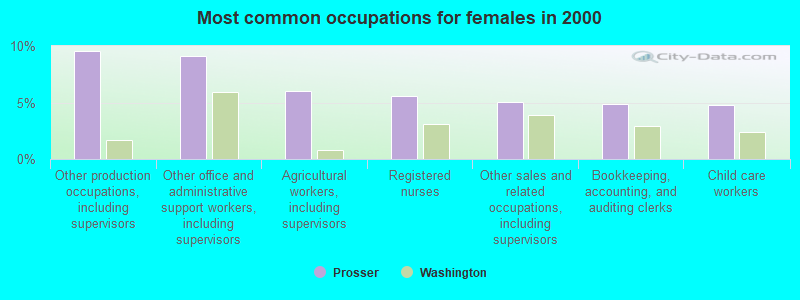
Most common occupations in Prosser, WA (%)
Both Males Females
Agricultural workers, including supervisors (9.1%)
Other production occupations, including supervisors (6.7%)
Other office and administrative support workers, including supervisors (4.6%)
Other sales and related occupations, including supervisors (3.6%)
Building and grounds cleaning and maintenance occupations (3.5%)
Other material moving workers, except laborers (3.4%)
Other management occupations, except farmers and farm managers (3.1%)
Agricultural workers, including supervisors (11.8%)
Other material moving workers, except laborers (6.4%)
Building and grounds cleaning and maintenance occupations (6.0%)
Engineers (5.6%)
Electrical equipment mechanics and other installation, maintenance, and repair workers, including supervisors (5.1%)
Other production occupations, including supervisors (4.3%)
Vehicle and mobile equipment mechanics, installers, and repairers (4.3%)
Other production occupations, including supervisors (9.6%)
Other office and administrative support workers, including supervisors (9.1%)
Agricultural workers, including supervisors (6.0%)
Registered nurses (5.6%)
Other sales and related occupations, including supervisors (5.0%)
Bookkeeping, accounting, and auditing clerks (4.9%)
Child care workers (4.8%)
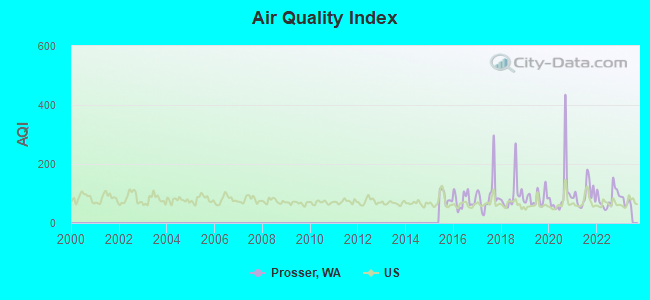
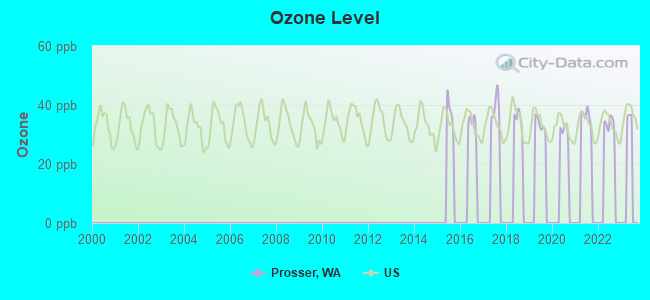
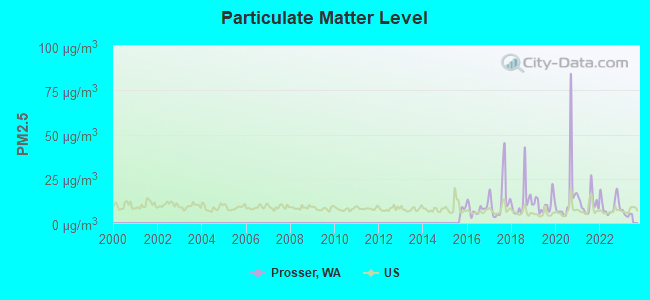
Air pollution and air quality trends(lower is better)
AQI Ozone PM2.5
Earthquake activity:
Prosser-area historical earthquake activity is significantly above Washington state average. It is 1367% greater than the overall U.S. average. On 4/13/1949 at 19:55:42, a magnitude 7.0 (7.0 UK, Class: Major, Intensity: VIII - XII) earthquake occurred 148.4 miles away from the city center, causing $80,000,000 total damage On 2/28/2001 at 18:54:32, a magnitude 6.8 (6.5 MB, 6.6 MS, 6.8 MW, Class: Strong, Intensity: VII - IX) earthquake occurred 146.9 miles away from the city center, causing $2,000,000,000 total damage and $305,000,000 insured lossesOn 2/28/2001 at 18:54:32, a magnitude 6.8 (6.8 MD, Depth: 32.2 mi) earthquake occurred 154.9 miles away from Prosser center On 4/29/1965 at 15:28:43, a magnitude 6.6 (6.6 UK) earthquake occurred 143.8 miles away from Prosser center, causing $28,000,000 total damage On 10/28/1983 at 14:06:06, a magnitude 7.3 (6.2 MB, 7.3 MS, 7.0 MW) earthquake occurred 326.0 miles away from Prosser center, causing 2 deaths ( 2 shaking deaths) and 3 injuries, causing $15,000,000 total damage On 10/3/1915 at 06:52:48, a magnitude 7.6 (7.6 UK) earthquake occurred 410.8 miles away from Prosser center Magnitude types: body-wave magnitude (MB), duration magnitude (MD), surface-wave magnitude (MS), moment magnitude (MW) Natural disasters: The number of natural disasters in Benton County (16) is near the US average (15).Major Disasters (Presidential) Declared: 11Emergencies Declared: 2Floods: 9, Storms: 5, Mudslides: 3, Winter Storms: 3, Fires: 2, Landslides: 2, Drought: 1, Earthquake: 1, Heavy Rain: 1, Hurricane: 1, Snow: 1, Volcanic Eruption: 1, Other: 1 (Note: some incidents may be assigned to more than one category). Hospitals and medical centers in Prosser: PROSSER MEMORIAL HOSPITAL (Voluntary non-profit - Other, provides emergency services, 723 MEMORIAL STREET) PROSSER MEMORIAL HOME HEALTH (1239 MEADE AVENUE)
PROSSER MEMORIAL HOSPITAL (723 MEMORIAL STREET)
Amtrak station near Prosser: 13 miles: SUNNYSIDE (OUTPOST TEXACO, EXIT 69, I-82) - Bus Station Colleges/universities with over 2000 students nearest to Prosser:
Columbia Basin College (about 32 miles; Pasco, WA ; Full-time enrollment: 5,111)
Yakima Valley Community College (about 45 miles; Yakima, WA ; FT enrollment: 3,632)
Central Washington University (about 67 miles; Ellensburg, WA ; FT enrollment: 10,960)
Walla Walla Community College (about 72 miles; Walla Walla, WA ; FT enrollment: 4,263)
Wenatchee Valley College (about 89 miles; Wenatchee, WA ; FT enrollment: 2,951)
Eastern Oregon University (about 102 miles; La Grande, OR ; FT enrollment: 3,127)
Washington State University (about 130 miles; Pullman, WA ; FT enrollment: 25,055)
Public high schools in Prosser:
Public elementary/middle schools in Prosser:
See full list of schools located in Prosser User-submitted facts and corrections:
Birthplace of Dan Gore - football player, Boise State
I wanted to let you know that your listing "Attractions" with "Wineries" does not list C R Sandidge Wines located at 2880 Lee Road Suite "A". All the other wineries are listed except them.
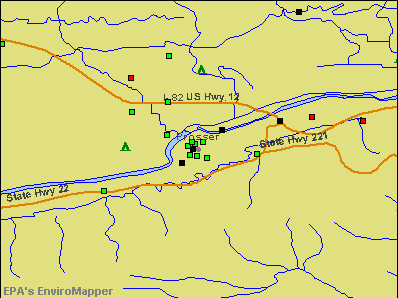
Notable locations in Prosser: (A) , Prosser Fire District 3 Station 310 (B) . Display/hide their locations on the map
Park in Prosser: (1) . Display/hide its location on the map
Tourist attractions:
Hotels:
Birthplace of: Kellen Moore - Football player, Mel Stottlemyre, Jr. - Baseball player and coach, Alex Kirk - College basketball player (Washington State Cougars), Brian Prior - Episcopal priest, Kelly Blair LaBounty - Olympic heptathalete.
Benton County has a predicted average indoor radon screening level between 2 and 4 pCi/L (pico curies per liter) - Moderate Potential Drinking water stations with addresses in Prosser and their reported violations in the past:
ALDERDALE WATER ASSN (Population served: 103, Groundwater):
Past monitoring violations:
Follow-up Or Routine LCR Tap M/R - In JAN-01-2006, Contaminant: Lead and Copper Rule
One routine major monitoring violation
19 regular monitoring violations
Drinking water stations with addresses in Prosser that have no violations reported:
MC CORKLES MARKET (Population served: 106, Primary Water Source Type: Groundwater)
Average household size: This city:
2.8 peopleWashington:
2.5 people
Percentage of family households: This city:
69.0%Whole state:
64.4%
Percentage of households with unmarried partners: This city:
6.7%Whole state:
7.7%
Likely homosexual households (counted as self-reported same-sex unmarried-partner households)
Lesbian couples: 0.3% of all households Gay men: 0.1% of all households
30 people in nursing facilities/skilled-nursing facilities in 2010people in other noninstitutional facilities in 2010people in nursing homes in 2000
Banks with branches in Prosser (2011 data):
AmericanWest Bank: Prosser Financial Center at 1115 Mead Avenue, branch established on 1989/02/08. Info updated 2011/12/12: Bank assets: $2,274.6 mil, Deposits: $1,889.1 mil, headquarters in Spokane, WA, positive income , Commercial Lending Specialization, 76 total offices , Holding Company: Skbhc Holdings Llc
U.S. Bank National Association: Prosser Branch at 1022 Meade Avenue, branch established on 1935/12/16. Info updated 2012/01/30: Bank assets: $330,470.8 mil, Deposits: $236,091.5 mil, headquarters in Cincinnati, OH, positive income , 3121 total offices , Holding Company: U.S. Bancorp
Yakima Federal Savings and Loan Association: Prosser Branch at 601 Market Street, branch established on 1905/01/01. Info updated 2011/07/21: Bank assets: $1,754.4 mil, Deposits: $1,384.6 mil, headquarters in Yakima, WA, positive income , Mortgage Lending Specialization, 10 total offices
For population 15 years and over in Prosser:
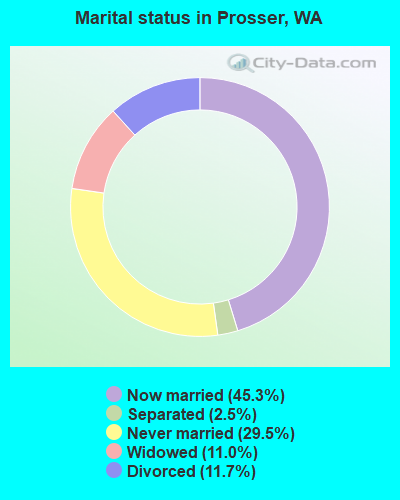
Never married: 29.5%Now married: 45.3%Separated: 2.5%Widowed: 11.0%Divorced: 11.7% For population 25 years and over in Prosser:
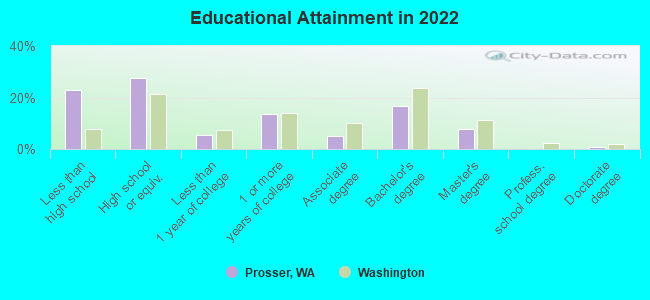
High school or higher: 80.0%Bachelor's degree or higher: 25.8%Graduate or professional degree: 9.2%Unemployed: 6.6%Mean travel time to work (commute): 17.2 minutes
Education Gini index (Inequality in education) Here:
17.3Washington average:
11.6
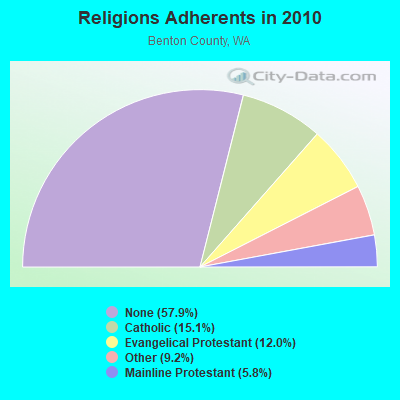
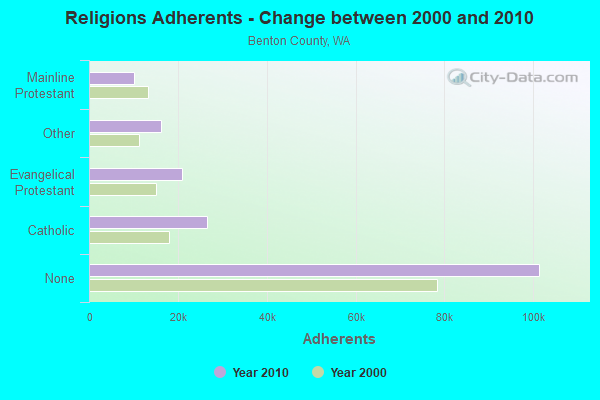
Religion statistics for Prosser, WA (based on Benton County data)
Religion Adherents Congregations Catholic 26,500 5 Evangelical Protestant 20,943 86 Other 16,145 43 Mainline Protestant 10,217 28 None 101,372 -
Source: Clifford Grammich, Kirk Hadaway, Richard Houseal, Dale E.Jones, Alexei Krindatch, Richie Stanley and Richard H.Taylor. 2012. 2010 U.S.Religion Census: Religious Congregations & Membership Study. Association of Statisticians of American Religious Bodies. Jones, Dale E., et al. 2002. Congregations and Membership in the United States 2000. Nashville, TN: Glenmary Research Center. Graphs represent county-level data
Food Environment Statistics: Number of grocery stores : 19Benton County :
1.20 / 10,000 pop.State :
2.06 / 10,000 pop.
Number of supercenters and club stores : 4Benton County :
0.25 / 10,000 pop.Washington :
0.19 / 10,000 pop.
Number of convenience stores (no gas) : 10Benton County :
0.63 / 10,000 pop.State :
1.18 / 10,000 pop.
Number of convenience stores (with gas) : 54This county :
3.40 / 10,000 pop.Washington :
2.67 / 10,000 pop.
Number of full-service restaurants : 97Benton County :
6.11 / 10,000 pop.State :
8.26 / 10,000 pop.
Adult diabetes rate : Benton County :
8.2%Washington :
7.7%
Adult obesity rate : Benton County :
27.5%State :
25.7%
Low-income preschool obesity rate : Benton County :
9.9%Washington :
13.9%
Health and Nutrition: Healthy diet rate : Prosser:
47.6%Washington:
49.9%
Average overall health of teeth and gums : Prosser:
45.7%Washington:
47.2%
People feeling badly about themselves : People not drinking alcohol at all : Here:
10.3%Washington:
10.5%
Average hours sleeping at night : General health condition : Prosser:
54.4%Washington:
56.8%
Average condition of hearing : Here:
78.5%Washington:
79.4%
More about Health and Nutrition of Prosser, WA Residents
Local government employment and payroll (March 2022)
Function
Full-time employees
Monthly full-time payroll
Average yearly full-time wage
Part-time employees
Monthly part-time payroll
Police Protection - Officers
16 $110,096 $82,572 0 $0 Other Government Administration
15 $113,198 $90,558 0 $0 Financial Administration
5 $27,451 $65,882 0 $0 Water Supply
5 $18,438 $44,251 0 $0 Sewerage
5 $35,529 $85,270 0 $0 Streets and Highways
4 $16,505 $49,515 0 $0
Totals for Government
50 $321,218 $77,092 0 $0
Prosser government finances - Expenditure in 2018 (per resident):
Construction - Regular Highways: $157,000 ($25.15)
Parks and Recreation: $62,000 ($9.93)Current Operations - Sewerage: $1,973,000 ($316.08)
Police Protection: $1,641,000 ($262.90)Water Utilities: $1,484,000 ($237.74)Solid Waste Management: $1,182,000 ($189.36)Regular Highways: $768,000 ($123.04)Parks and Recreation: $682,000 ($109.26)Central Staff Services: $520,000 ($83.31)Financial Administration: $489,000 ($78.34)Natural Resources - Other: $446,000 ($71.45)Health - Other: $257,000 ($41.17)Protective Inspection and Regulation - Other: $205,000 ($32.84)General Public Buildings: $148,000 ($23.71)General - Other: $107,000 ($17.14)Judicial and Legal Services: $73,000 ($11.69)Libraries: $28,000 ($4.49)General - Interest on Debt: $157,000 ($25.15)
Intergovernmental to Local - Other - Libraries: $175,000 ($28.04)
Other - Judicial and Legal Services: $112,000 ($17.94)Other - Local Fire Protection: $100,000 ($16.02)Other - Correctional Institutions: $88,000 ($14.10)Other - Police Protection: $37,000 ($5.93)Other - Financial Administration: $21,000 ($3.36)Other - Regular Highways: $15,000 ($2.40)Other - General - Other: $14,000 ($2.24)Other - Natural Resources - Other: $8,000 ($1.28)Other - Sewerage: $8,000 ($1.28)Other - Water Utilities: $8,000 ($1.28)Other - Solid Waste Management: $8,000 ($1.28)Other - Health - Other: $2,000 ($0.32)Other - Parks and Recreation: $1,000 ($0.16)Other Capital Outlay - Sewerage: $109,000 ($17.46)
Police Protection: $104,000 ($16.66)Water Utilities: $75,000 ($12.02)Solid Waste Management: $44,000 ($7.05)Parks and Recreation: $17,000 ($2.72)General - Other: $2,000 ($0.32)Total Salaries and Wages: $3,127,000 ($500.96)
Water Utilities - Interest on Debt: $273,000 ($43.74)
Prosser government finances - Revenue in 2018 (per resident):
Charges - Sewerage: $2,656,000 ($425.50)
Solid Waste Management: $1,117,000 ($178.95)Natural Resources - Other: $350,000 ($56.07)Other: $169,000 ($27.07)Parks and Recreation: $144,000 ($23.07)Regular Highways: $100,000 ($16.02)Federal Intergovernmental - Health and Hospitals: $115,000 ($18.42)
Local Intergovernmental - Other: $9,000 ($1.44)
Miscellaneous - Fines and Forfeits: $141,000 ($22.59)
General Revenue - Other: $62,000 ($9.93)Rents: $52,000 ($8.33)Donations From Private Sources: $8,000 ($1.28)Special Assessments: $3,000 ($0.48)Interest Earnings: $0 ($0.00)Revenue - Water Utilities: $2,099,000 ($336.27)
State Intergovernmental - Other: $234,000 ($37.49)
Highways: $197,000 ($31.56)Health and Hospitals: $154,000 ($24.67)General Local Government Support: $79,000 ($12.66)Tax - Public Utilities Sales: $2,007,000 ($321.53)
General Sales and Gross Receipts: $1,906,000 ($305.35)Property: $1,177,000 ($188.56)Documentary and Stock Transfer: $140,000 ($22.43)Other Selective Sales: $127,000 ($20.35)Other License: $85,000 ($13.62)Occupation and Business License - Other: $57,000 ($9.13)
Prosser government finances - Debt in 2018 (per resident):
Long Term Debt - Beginning Outstanding - Unspecified Public Purpose: $19,706,000 ($3157.00)
Outstanding Unspecified Public Purpose: $18,159,000 ($2909.16)Retired Unspecified Public Purpose: $1,611,000 ($258.09)Issue, Unspecified Public Purpose: $64,000 ($10.25)
Businesses in Prosser, WA
Name Count Name Count
AutoZone 1 H&R Block 1 Best Western 1 KFC 1 Burger King 1 McDonald's 1 Chevrolet 1 Starbucks 1 Curves 1 Subway 1 FedEx 1 Taco Bell 1 Ford 1 True Value 1
Strongest AM radio stations in Prosser:
KZXR (1310 AM; 5 kW; PROSSER, WA; Owner: MOON BROADCASTING PROSSER LLC)
KZTS (1210 AM; 10 kW; SUNNYSIDE, WA; Owner: BUTTERFIELD BROADCASTING CORPORATION)
KFLD (870 AM; 10 kW; PASCO, WA; Owner: CAPSTAR TX LIMITED PARTNERSHIP)
KTBI (810 AM; daytime; 50 kW; EPHRATA, WA; Owner: TACOMA BROADCASTERS, INCORPORATED)
KONA (610 AM; 5 kW; KENNEWICK-RICHLAND-P, WA; Owner: COMMONWEALTH LICENSE SUBSIDIARY, LLC)
KALE (960 AM; 5 kW; RICHLAND, WA; Owner: NEW NORTHWEST BROADCASTERS, LLC)
KYAK (930 AM; 10 kW; YAKIMA, WA)
KPOJ (620 AM; 50 kW; PORTLAND, OR; Owner: CITICASTERS LICENSES, L.P.)
KXL (750 AM; 50 kW; PORTLAND, OR; Owner: ROSE CITY RADIO CORPORATION)
KOHU (1360 AM; 4 kW; HERMISTON, OR; Owner: WESTEND RADIO, LLC)
KPAM (860 AM; 50 kW; TROUTDALE, OR; Owner: PAMPLIN BROADCASTING-OREGON, INC.)
KIRO (710 AM; 50 kW; SEATTLE, WA; Owner: ENTERCOM SEATTLE LICENSE, LLC)
KYXE (1020 AM; 5 kW; SELAH, WA; Owner: BUTTERFIELD BROADCASTING CORPORATION)
Strongest FM radio stations in Prosser:
KMNA (101.7 FM; PROSSER, WA; Owner: MOON BROADCASTING PROSSER LLC)
K204DH (88.7 FM; HANFORD, WA; Owner: CALVARY CHAPEL OF TWIN FALLS, INC.)
KLES (98.7 FM; MABTON, WA; Owner: ON-AIR FAMILY, LLC)
KARY-FM (100.9 FM; GRANDVIEW, WA; Owner: NEW NORTHWEST BROADCASTERS, LLC)
KZTB (96.7 FM; SUNNYSIDE, WA; Owner: BUTTERFIELD BROADCASTING CORPORATION)
KONA-FM (105.3 FM; KENNEWICK, WA; Owner: COMMONWEALTH LICENSE SUBSIDIARY, LLC)
KXRX (97.1 FM; WALLA WALLA, WA; Owner: CAPSTAR TX LIMITED PARTNERSHIP)
KFAE-FM (89.1 FM; RICHLAND, WA; Owner: WASHINGTON STATE UNIVERSITY)
KIOK (94.9 FM; RICHLAND, WA; Owner: NEW NORTHWEST BROADCASTERS, LLC)
KORD-FM (102.7 FM; RICHLAND, WA; Owner: CAPSTAR TX LIMITED PARTNERSHIP)
KEGX (106.5 FM; RICHLAND, WA; Owner: NEW NORTHWEST BROADCASTERS, LLC)
KEYW (98.3 FM; PASCO, WA; Owner: CAPSTAR TX LIMITED PARTNERSHIP)
KXDD (104.1 FM; YAKIMA, WA; Owner: NEW NORTHWEST BROADCASTERS, LLC)
KGDN (101.3 FM; PASCO, WA; Owner: WEST PASCO FINE ARTS RADIO)
K261CG (100.1 FM; PASCO, WA; Owner: NORTHWEST CHICANO RADIO NETWORK)
KRCW (96.3 FM; ROYAL CITY, WA; Owner: FARMWORKER EDUCATIONAL RADIO NETWORK, INC.)
KOLU (90.1 FM; PASCO, WA; Owner: RIVERVIEW BAPTIST CHRISTIAN SCHOOLS)
KBLD (91.7 FM; KENNEWICK, WA; Owner: CSN INTERNATIONAL)
KFFM (107.3 FM; YAKIMA, WA; Owner: CITICASTERS LICENSES, L.P.)
KGSG (93.7 FM; PASCO, WA; Owner: GOSPEL MUSIC BROADCASTING CORP.)
TV broadcast stations around Prosser:
K08LU (Channel 8; SUNNYSIDE-GRANDVIEW, WA; Owner: RON BEVINS)
K13WP (Channel 13; SUNNYSIDE, ETC., WA; Owner: RON BEVINS)
K05JO (Channel 5; SUNNYSIDE & PROSSER, WA; Owner: THREE ANGELS BROADCASTING NETWORK)
K10NQ (Channel 10; PROSSER, ETC., WA; Owner: MOUNTAIN LICENSES, L.P.)
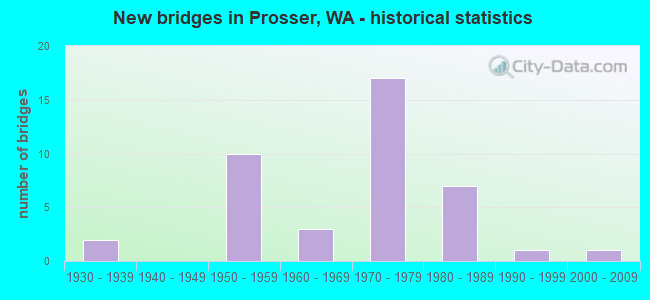
National Bridge Inventory (NBI) Statistics 41 Number of bridges594ft / 181m Total length $68,925,000 Total costs236,919 Total average daily traffic35,681 Total average daily truck traffic
New bridges - historical statistics
2 1930-1939 10 1950-1959 3 1960-1969 17 1970-1979 7 1980-1989 1 1990-1999 1 2000-2009
See full National Bridge Inventory statistics for Prosser, WA
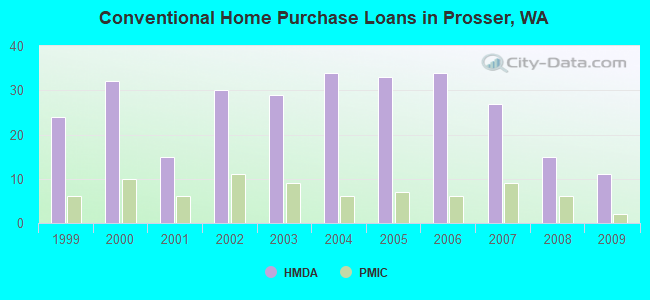
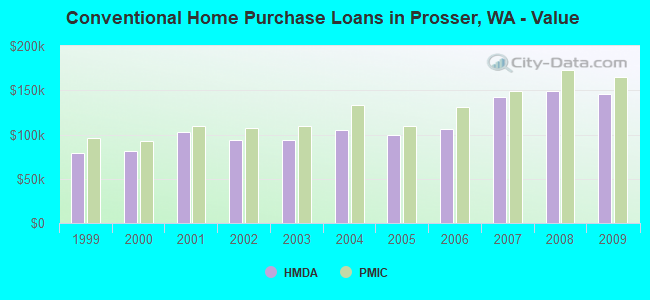
Home Mortgage Disclosure Act Aggregated Statistics For Year 2009(Based on 3 partial tracts) A) FHA, FSA/RHS & VA B) Conventional C) Refinancings D) Home Improvement Loans F) Non-occupant Loans on G) Loans On Manufactured Number Average Value Number Average Value Number Average Value Number Average Value Number Average Value Number Average Value
LOANS ORIGINATED 11 $146,894 11 $146,279 41 $150,137 6 $81,570 4 $95,290 4 $97,545 APPLICATIONS APPROVED, NOT ACCEPTED 1 $132,100 1 $67,340 5 $139,062 2 $107,615 0 $0 1 $43,820 APPLICATIONS DENIED 1 $194,930 2 $60,895 18 $134,071 3 $70,883 3 $100,633 2 $86,350 APPLICATIONS WITHDRAWN 1 $85,710 1 $351,840 11 $124,311 1 $29,000 0 $0 1 $150,470 FILES CLOSED FOR INCOMPLETENESS 0 $0 1 $66,700 3 $142,843 0 $0 1 $112,450 0 $0
Aggregated Statistics For Year 2008(Based on 3 partial tracts) A) FHA, FSA/RHS & VA B) Conventional C) Refinancings D) Home Improvement Loans F) Non-occupant Loans on G) Loans On Manufactured Number Average Value Number Average Value Number Average Value Number Average Value Number Average Value Number Average Value
LOANS ORIGINATED 9 $134,572 15 $149,050 21 $124,722 4 $104,472 5 $109,742 3 $112,877 APPLICATIONS APPROVED, NOT ACCEPTED 1 $72,170 1 $61,540 4 $130,572 0 $0 1 $58,320 1 $105,680 APPLICATIONS DENIED 1 $53,490 3 $98,163 22 $124,340 3 $73,033 2 $88,925 0 $0 APPLICATIONS WITHDRAWN 0 $0 2 $112,930 8 $154,616 1 $62,830 1 $226,830 0 $0 FILES CLOSED FOR INCOMPLETENESS 0 $0 0 $0 3 $110,193 1 $109,230 0 $0 0 $0
Aggregated Statistics For Year 2007(Based on 3 partial tracts) A) FHA, FSA/RHS & VA B) Conventional C) Refinancings D) Home Improvement Loans F) Non-occupant Loans on G) Loans On Manufactured Number Average Value Number Average Value Number Average Value Number Average Value Number Average Value Number Average Value
LOANS ORIGINATED 4 $105,922 27 $142,114 22 $121,689 5 $35,120 6 $112,018 3 $90,430 APPLICATIONS APPROVED, NOT ACCEPTED 1 $86,030 3 $151,970 9 $125,336 1 $104,390 1 $183,330 2 $89,410 APPLICATIONS DENIED 0 $0 6 $116,852 29 $142,023 6 $81,087 2 $116,635 4 $93,278 APPLICATIONS WITHDRAWN 0 $0 3 $135,110 15 $127,548 1 $43,500 1 $110,190 1 $94,400 FILES CLOSED FOR INCOMPLETENESS 0 $0 1 $92,150 4 $132,342 0 $0 0 $0 0 $0
Aggregated Statistics For Year 2006(Based on 3 partial tracts) A) FHA, FSA/RHS & VA B) Conventional C) Refinancings D) Home Improvement Loans E) Loans on Dwellings For 5+ Families F) Non-occupant Loans on G) Loans On Manufactured Number Average Value Number Average Value Number Average Value Number Average Value Number Average Value Number Average Value Number Average Value
LOANS ORIGINATED 5 $101,428 34 $106,080 24 $105,789 5 $80,744 1 $539,690 5 $112,512 4 $68,308 APPLICATIONS APPROVED, NOT ACCEPTED 1 $99,560 5 $81,002 8 $101,976 2 $74,910 0 $0 1 $123,720 1 $116,640 APPLICATIONS DENIED 1 $136,610 6 $104,662 37 $112,770 7 $74,659 0 $0 1 $117,280 8 $107,736 APPLICATIONS WITHDRAWN 1 $145,630 6 $94,352 24 $108,608 2 $80,550 0 $0 1 $102,460 1 $108,900 FILES CLOSED FOR INCOMPLETENESS 0 $0 1 $159,490 5 $144,474 0 $0 0 $0 0 $0 0 $0
Aggregated Statistics For Year 2005(Based on 3 partial tracts) A) FHA, FSA/RHS & VA B) Conventional C) Refinancings D) Home Improvement Loans F) Non-occupant Loans on G) Loans On Manufactured Number Average Value Number Average Value Number Average Value Number Average Value Number Average Value Number Average Value
LOANS ORIGINATED 4 $96,418 33 $99,589 35 $110,303 6 $64,547 6 $101,815 5 $85,640 APPLICATIONS APPROVED, NOT ACCEPTED 0 $0 4 $82,645 7 $80,411 2 $33,025 0 $0 1 $63,150 APPLICATIONS DENIED 0 $0 7 $90,493 40 $100,575 7 $33,371 0 $0 5 $77,328 APPLICATIONS WITHDRAWN 0 $0 3 $82,160 29 $122,358 5 $129,654 2 $100,690 0 $0 FILES CLOSED FOR INCOMPLETENESS 0 $0 1 $48,010 4 $125,658 0 $0 0 $0 1 $30,930
Aggregated Statistics For Year 2004(Based on 3 partial tracts) A) FHA, FSA/RHS & VA B) Conventional C) Refinancings D) Home Improvement Loans F) Non-occupant Loans on G) Loans On Manufactured Number Average Value Number Average Value Number Average Value Number Average Value Number Average Value Number Average Value
LOANS ORIGINATED 6 $94,673 34 $104,933 33 $115,006 5 $51,488 6 $102,513 4 $94,808 APPLICATIONS APPROVED, NOT ACCEPTED 0 $0 4 $98,512 9 $101,136 0 $0 1 $92,470 2 $77,810 APPLICATIONS DENIED 1 $46,720 7 $89,710 33 $111,237 6 $39,255 2 $94,405 3 $69,703 APPLICATIONS WITHDRAWN 1 $58,960 5 $64,504 34 $105,833 1 $54,770 2 $100,045 2 $117,765 FILES CLOSED FOR INCOMPLETENESS 0 $0 0 $0 3 $105,360 1 $19,650 0 $0 0 $0
Aggregated Statistics For Year 2003(Based on 3 partial tracts) A) FHA, FSA/RHS & VA B) Conventional C) Refinancings D) Home Improvement Loans F) Non-occupant Loans on Number Average Value Number Average Value Number Average Value Number Average Value Number Average Value
LOANS ORIGINATED 7 $99,651 29 $93,516 75 $103,422 5 $45,882 5 $77,456 APPLICATIONS APPROVED, NOT ACCEPTED 0 $0 2 $114,540 8 $95,935 1 $52,200 0 $0 APPLICATIONS DENIED 0 $0 5 $102,072 30 $108,431 4 $24,325 1 $99,560 APPLICATIONS WITHDRAWN 1 $55,420 3 $96,660 21 $99,698 0 $0 1 $78,290 FILES CLOSED FOR INCOMPLETENESS 0 $0 0 $0 1 $75,390 0 $0 0 $0
Aggregated Statistics For Year 2002(Based on 3 partial tracts) A) FHA, FSA/RHS & VA B) Conventional C) Refinancings D) Home Improvement Loans F) Non-occupant Loans on Number Average Value Number Average Value Number Average Value Number Average Value Number Average Value
LOANS ORIGINATED 9 $107,042 30 $93,309 45 $94,269 5 $26,420 5 $70,820 APPLICATIONS APPROVED, NOT ACCEPTED 0 $0 3 $91,397 11 $85,939 0 $0 1 $41,890 APPLICATIONS DENIED 0 $0 5 $81,388 22 $90,685 1 $17,080 1 $60,250 APPLICATIONS WITHDRAWN 0 $0 0 $0 22 $96,338 0 $0 1 $38,660 FILES CLOSED FOR INCOMPLETENESS 0 $0 1 $140,160 3 $76,683 0 $0 0 $0
Aggregated Statistics For Year 2001(Based on 3 partial tracts) A) FHA, FSA/RHS & VA B) Conventional C) Refinancings D) Home Improvement Loans F) Non-occupant Loans on Number Average Value Number Average Value Number Average Value Number Average Value Number Average Value
LOANS ORIGINATED 7 $95,326 15 $102,395 31 $95,070 2 $12,245 1 $89,250 APPLICATIONS APPROVED, NOT ACCEPTED 0 $0 2 $75,395 6 $68,413 0 $0 1 $40,600 APPLICATIONS DENIED 1 $49,940 6 $67,715 21 $79,768 3 $23,520 1 $26,740 APPLICATIONS WITHDRAWN 0 $0 2 $75,395 15 $92,901 1 $44,140 1 $65,730 FILES CLOSED FOR INCOMPLETENESS 0 $0 2 $41,885 3 $96,017 1 $20,300 0 $0
Aggregated Statistics For Year 2000(Based on 3 partial tracts) A) FHA, FSA/RHS & VA B) Conventional C) Refinancings D) Home Improvement Loans F) Non-occupant Loans on Number Average Value Number Average Value Number Average Value Number Average Value Number Average Value
LOANS ORIGINATED 7 $86,949 32 $81,527 12 $69,810 6 $13,693 7 $79,169 APPLICATIONS APPROVED, NOT ACCEPTED 1 $59,610 5 $99,946 6 $58,318 2 $19,815 1 $53,490 APPLICATIONS DENIED 1 $105,360 23 $65,659 16 $67,179 4 $24,165 2 $67,340 APPLICATIONS WITHDRAWN 0 $0 3 $78,187 13 $74,602 1 $11,600 0 $0 FILES CLOSED FOR INCOMPLETENESS 0 $0 1 $94,730 4 $83,530 0 $0 0 $0
Aggregated Statistics For Year 1999(Based on 3 partial tracts) A) FHA, FSA/RHS & VA B) Conventional C) Refinancings D) Home Improvement Loans F) Non-occupant Loans on Number Average Value Number Average Value Number Average Value Number Average Value Number Average Value
LOANS ORIGINATED 6 $94,473 24 $78,750 29 $74,224 4 $20,910 3 $49,327 APPLICATIONS APPROVED, NOT ACCEPTED 1 $77,850 7 $90,536 6 $88,575 1 $38,280 0 $0 APPLICATIONS DENIED 1 $100,690 19 $65,965 17 $87,578 7 $24,724 1 $52,760 APPLICATIONS WITHDRAWN 0 $0 2 $68,200 11 $52,203 1 $26,060 0 $0 FILES CLOSED FOR INCOMPLETENESS 0 $0 1 $69,170 4 $68,682 0 $0 0 $0
Detailed HMDA statistics for the following Tracts:
0117.00
Private Mortgage Insurance Companies Aggregated Statistics For Year 2009(Based on 3 partial tracts) A) Conventional B) Refinancings C) Non-occupant Loans on Number Average Value Number Average Value Number Average Value
LOANS ORIGINATED 2 $164,485 3 $264,203 0 $0 APPLICATIONS APPROVED, NOT ACCEPTED 1 $194,930 0 $0 1 $92,790 APPLICATIONS DENIED 0 $0 0 $0 0 $0 APPLICATIONS WITHDRAWN 0 $0 1 $138,550 0 $0 FILES CLOSED FOR INCOMPLETENESS 0 $0 0 $0 0 $0
Aggregated Statistics For Year 2008(Based on 3 partial tracts) A) Conventional B) Refinancings C) Non-occupant Loans on Number Average Value Number Average Value Number Average Value
LOANS ORIGINATED 6 $173,183 3 $124,047 1 $122,440 APPLICATIONS APPROVED, NOT ACCEPTED 1 $90,540 1 $100,530 0 $0 APPLICATIONS DENIED 0 $0 0 $0 0 $0 APPLICATIONS WITHDRAWN 0 $0 0 $0 0 $0 FILES CLOSED FOR INCOMPLETENESS 0 $0 0 $0 0 $0
Aggregated Statistics For Year 2007(Based on 3 partial tracts) A) Conventional B) Refinancings C) Non-occupant Loans on Number Average Value Number Average Value Number Average Value
LOANS ORIGINATED 9 $149,250 3 $131,673 1 $65,730 APPLICATIONS APPROVED, NOT ACCEPTED 1 $100,530 1 $123,720 0 $0 APPLICATIONS DENIED 0 $0 0 $0 0 $0 APPLICATIONS WITHDRAWN 0 $0 0 $0 0 $0 FILES CLOSED FOR INCOMPLETENESS 0 $0 0 $0 0 $0
Aggregated Statistics For Year 2006(Based on 3 partial tracts) A) Conventional B) Refinancings C) Non-occupant Loans on Number Average Value Number Average Value Number Average Value
LOANS ORIGINATED 6 $131,082 1 $133,710 1 $122,440 APPLICATIONS APPROVED, NOT ACCEPTED 0 $0 0 $0 0 $0 APPLICATIONS DENIED 0 $0 0 $0 0 $0 APPLICATIONS WITHDRAWN 0 $0 0 $0 0 $0 FILES CLOSED FOR INCOMPLETENESS 0 $0 0 $0 0 $0
Aggregated Statistics For Year 2005(Based on 3 partial tracts) A) Conventional B) Refinancings C) Non-occupant Loans on Number Average Value Number Average Value Number Average Value
LOANS ORIGINATED 7 $109,870 4 $116,152 1 $44,790 APPLICATIONS APPROVED, NOT ACCEPTED 1 $46,400 0 $0 0 $0 APPLICATIONS DENIED 0 $0 0 $0 0 $0 APPLICATIONS WITHDRAWN 0 $0 0 $0 0 $0 FILES CLOSED FOR INCOMPLETENESS 0 $0 0 $0 0 $0
Aggregated Statistics For Year 2004(Based on 3 partial tracts) A) Conventional B) Refinancings D) Loans On Manufactured Number Average Value Number Average Value Number Average Value
LOANS ORIGINATED 6 $133,068 4 $152,480 1 $125,340 APPLICATIONS APPROVED, NOT ACCEPTED 0 $0 1 $162,710 0 $0 APPLICATIONS DENIED 0 $0 0 $0 0 $0 APPLICATIONS WITHDRAWN 0 $0 1 $58,000 0 $0 FILES CLOSED FOR INCOMPLETENESS 0 $0 0 $0 0 $0
Aggregated Statistics For Year 2003(Based on 3 partial tracts) A) Conventional B) Refinancings C) Non-occupant Loans on Number Average Value Number Average Value Number Average Value
LOANS ORIGINATED 9 $110,049 9 $116,816 2 $74,750 APPLICATIONS APPROVED, NOT ACCEPTED 1 $122,760 0 $0 0 $0 APPLICATIONS DENIED 0 $0 0 $0 0 $0 APPLICATIONS WITHDRAWN 0 $0 0 $0 0 $0 FILES CLOSED FOR INCOMPLETENESS 0 $0 0 $0 0 $0
Aggregated Statistics For Year 2002(Based on 3 partial tracts) A) Conventional B) Refinancings C) Non-occupant Loans on Number Average Value Number Average Value Number Average Value
LOANS ORIGINATED 11 $107,878 6 $110,407 1 $33,830 APPLICATIONS APPROVED, NOT ACCEPTED 2 $61,220 1 $118,890 0 $0 APPLICATIONS DENIED 0 $0 1 $84,090 0 $0 APPLICATIONS WITHDRAWN 0 $0 0 $0 0 $0 FILES CLOSED FOR INCOMPLETENESS 0 $0 0 $0 0 $0
Aggregated Statistics For Year 2001(Based on 3 partial tracts) A) Conventional B) Refinancings Number Average Value Number Average Value
LOANS ORIGINATED 6 $109,978 4 $120,020 APPLICATIONS APPROVED, NOT ACCEPTED 1 $184,620 1 $130,810 APPLICATIONS DENIED 0 $0 0 $0 APPLICATIONS WITHDRAWN 0 $0 0 $0 FILES CLOSED FOR INCOMPLETENESS 0 $0 0 $0
Aggregated Statistics For Year 2000(Based on 3 partial tracts) A) Conventional B) Refinancings Number Average Value Number Average Value
LOANS ORIGINATED 10 $92,987 1 $109,550 APPLICATIONS APPROVED, NOT ACCEPTED 0 $0 0 $0 APPLICATIONS DENIED 0 $0 0 $0 APPLICATIONS WITHDRAWN 1 $46,070 0 $0 FILES CLOSED FOR INCOMPLETENESS 0 $0 0 $0
Aggregated Statistics For Year 1999(Based on 3 partial tracts) A) Conventional B) Refinancings Number Average Value Number Average Value
LOANS ORIGINATED 6 $96,348 4 $109,780 APPLICATIONS APPROVED, NOT ACCEPTED 0 $0 0 $0 APPLICATIONS DENIED 1 $47,930 0 $0 APPLICATIONS WITHDRAWN 0 $0 0 $0 FILES CLOSED FOR INCOMPLETENESS 0 $0 0 $0
Detailed PMIC statistics for the following Tracts:
0117.00
Fire-safe hotels and motels in Prosser, Washington:
Best Western The Inn At Horse Heaven, 259 Merlot Dr, Prosser, Washington 99350 Phone: (509) 786-7977, Fax: (509) 786-7236
Holiday Inn Express, 680 Wine Country Rd, Prosser, Washington 99350 Phone: (877) 320-8454, Fax: (509) 786-1015
All 2 fire-safe hotels and motels in Prosser, Washington
Most common first names in Prosser, WA among deceased individuals Name Count Lived (average)
John 60 75.5 years William 39 77.9 years Robert 38 71.0 years Mary 34 82.3 years James 34 73.0 years Frank 23 75.0 years Dorothy 22 79.2 years Walter 19 71.9 years Charles 19 74.1 years George 19 77.4 years
Most common last names in Prosser, WA among deceased individuals Last name Count Lived (average)
Davis 17 71.5 years Jones 16 77.1 years Anderson 15 81.9 years Smith 15 70.6 years Wilson 14 77.4 years Williams 14 70.1 years Martin 13 80.9 years Johnson 11 81.3 years Evans 11 76.7 years Clark 11 74.3 years
Prosser compared to Washington state average:
Median house value below state average. Unemployed percentage below state average. Black race population percentage significantly below state average. Hispanic race population percentage significantly above state average. Length of stay since moving in significantly above state average.
#23 on the list of "Top 101 cities with the most people driving a car to work alone (population 5,000+)"
#60 on the list of "Top 101 cities with largest percentage of males in industries: agriculture, forestry, fishing and hunting (population 5,000+)"
#66 on the list of "Top 101 cities with largest percentage of males in occupations: farming, fishing, and forestry occupations (population 5,000+)"
#74 on the list of "Top 101 cities with largest percentage of females in occupations: health technologists and technicians (population 5,000+)"
#19 on the list of "Top 101 counties with the largest number of people moving in compared to moving out (pop. 50,000+)"
#29 on the list of "Top 101 counties with the highest average weight of females"
#35 on the list of "Top 101 counties with the highest percentage of residents that keep firearms around their homes"
#56 on the list of "Top 101 counties with the largest increase in the number of births per 1000 residents 2000-2006 to 2007-2013 (pop 50,000+)"
#67 on the list of "Top 101 counties with the lowest percentage of residents that drank alcohol in the past 30 days"
Top Patent Applicants
Thomas M. Burke (4)
William Edward Howell (4)
Ralph Eric Leber (2)
Matthew David Whiting (2)
Matthew D. Whiting (2)
Chun Fang (1)
Tom Michael Ashley (1)
John Barth (1)
Mark De Kleine (1)
Leo A. Kucek (1)
Total of 21 patent applications in 2008-2024.


 Recent articles from our blog. Our writers, many of them Ph.D. graduates or candidates, create easy-to-read articles on a wide variety of topics.

 (29.0 miles
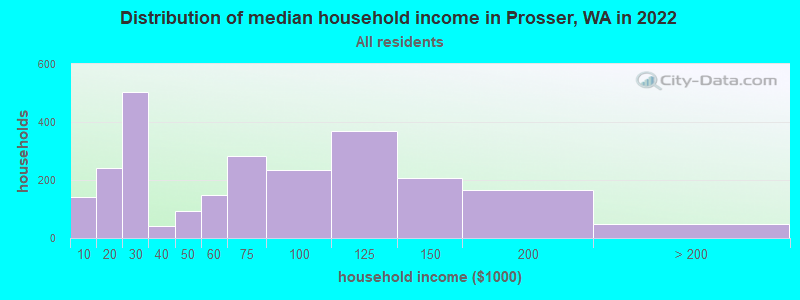


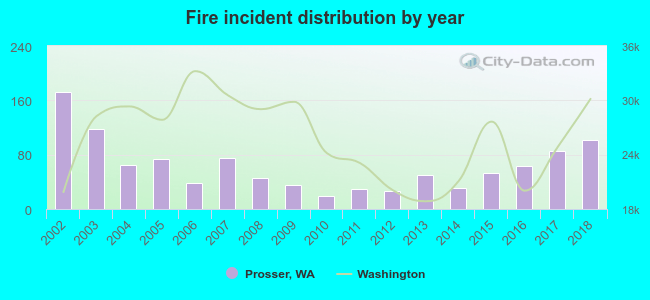 Based on the data from the years 2002 - 2018 the average number of fire incidents per year is 64. The highest number of reported fire incidents - 173 took place in 2002, and the least - 19 in 2010. The data has a decreasing trend.
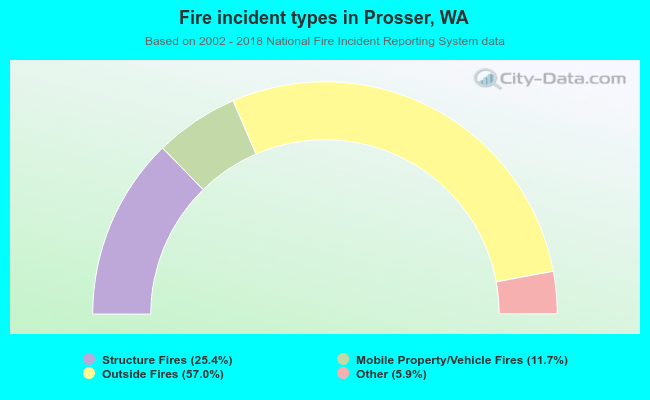 When looking into fire subcategories, the most reports belonged to: Outside Fires (57.0%), and Structure Fires (25.4%).