Carrollton, Georgia
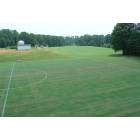
Carrollton: Practice Fields and Observatory @ the University of West Georgia

Carrollton: Sunrise West of Carrollton on Tyus Road

Carrollton: University of West Georgia Front Campus
Carrollton: University of West Georgia West Georgia Drive
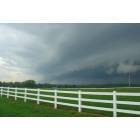
Carrollton: July 07 Rain Storm Moving in over Mary Walker's Farm

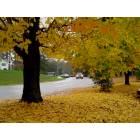
Carrollton: Spring 07 Maple Street on Front Campus of the University of West Georgia
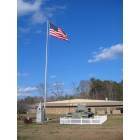
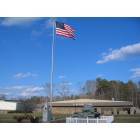
Carrollton: VFW Post 7404 - Carrollton
Carrollton: VFW Post 7404 - Carrollton
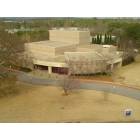
Carrollton: University of West Georgia Townsend Performing Arts Center
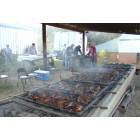
Carrollton: Legendary Old Camp UMC Bar-B-Que every 3rd Saturday in October
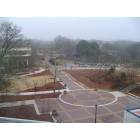
Carrollton: University of West Georgia Middle Campus
- see
31
more - add
your


Submit your own pictures of this city and show them to the world
- OSM Map
- General Map
- Google Map
- MSN Map
Population change since 2000: +37.4%
| Males: 12,522 | |
| Females: 14,740 |
| Median resident age: | 26.9 years |
| Georgia median age: | 37.6 years |
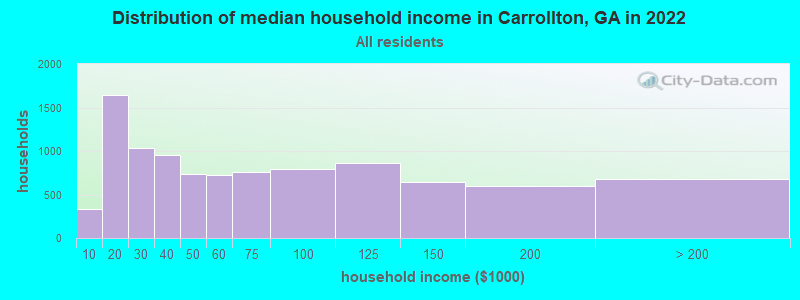
| Carrollton: | $50,703 |
| GA: | $72,837 |
Estimated per capita income in 2022: $31,311 (it was $16,803 in 2000)
Carrollton city income, earnings, and wages data
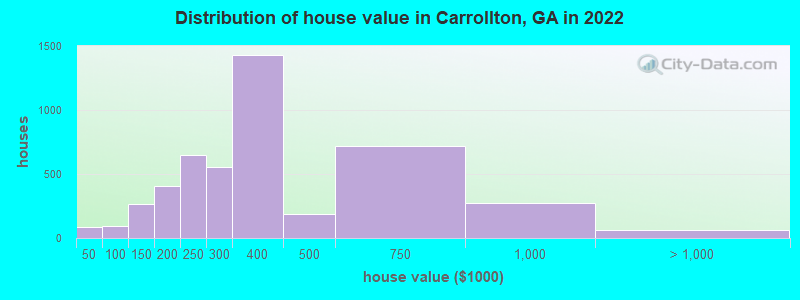
Estimated median house or condo value in 2022: $345,563 (it was $102,400 in 2000)
| Carrollton: | $345,563 |
| GA: | $297,400 |
Median gross rent in 2022: $995.
(21.8% for White Non-Hispanic residents, 44.3% for Black residents, 43.6% for Hispanic or Latino residents, 66.9% for American Indian residents, 38.9% for other race residents, 34.9% for two or more races residents)
Detailed information about poverty and poor residents in Carrollton, GA


Compare current foreclosures in Carrollton, GA:
| Photo | Address | Area | Beds / Baths | Price | Details |
|---|---|---|---|---|---|

|
#1
Silver Pine Ct
Carrollton, GA 30116
|
1,833 sq. feet
|
2 baths 3 beds |
show details | |

|
#2
Christian Ln
Carrollton, GA 30116
|
1,330 sq. feet
|
2 baths 3 beds |
show details | |

|
#3
Woodland Way
Carrollton, GA 30116
|
1,400 sq. feet
|
2 baths 3 beds |
show details | |

|
#4
Henson Cir
Carrollton, GA 30117
|
1,405 sq. feet
|
2 baths 3 beds |
show details | |

|
#5
Happy Hill Rd
Carrollton, GA 30116
|
1,216 sq. feet
|
1 baths 3 beds |
show details | |

|
#6
Providence Dr
Carrollton, GA 30116
|
1,323 sq. feet
|
2 baths 3 beds |
show details | |

|
#7
Clem Lowell Rd
Carrollton, GA 30116
|
2,288 sq. feet
|
2 baths 3 beds |
show details | |

|
#8
Lambert Overlook Cir
Carrollton, GA 30117
|
1,230 sq. feet
|
2 baths 3 beds |
show details | |

|
#9
Clarion Dr
Carrollton, GA 30116
|
1,912 sq. feet
|
3 baths 4 beds |
show details | |

|
#10
Jennifer Ln
Carrollton, GA 30116
|
2,796 sq. feet
|
2 baths 3 beds |
show details |
| Photo | Address | Area | Beds / Baths | Price | Details |
|---|---|---|---|---|---|

|
#11
Folds Rd
Carrollton, GA 30116
|
1,008 sq. feet
|
1 baths 3 beds |
show details | |

|
#12
Harris Rd
Carrollton, GA 30116
|
1,420 sq. feet
|
1 baths 3 beds |
show details | |

|
#13
Camp Ln
Carrollton, GA 30117
|
2,062 sq. feet
|
3 baths 3 beds |
show details | |

|
#14
Lambert Overlook Cir
Carrollton, GA 30117
|
1,240 sq. feet
|
2 baths 3 beds |
show details | |

|
#15
Center Point Rd
Carrollton, GA 30117
|
1,504 sq. feet
|
2 baths 3 beds |
show details | |

|
#16
Tyler Ln
Carrollton, GA 30117
|
1,640 sq. feet
|
2 baths 3 beds |
show details | |

|
#17
Tyus Carrollton Rd
Carrollton, GA 30117
|
1,448 sq. feet
|
1 baths 3 beds |
show details | |

|
#18
Burns Rd
Carrollton, GA 30117
|
1,416 sq. feet
|
2 baths 3 beds |
show details | |

|
#19
Mount Zion Rd
Carrollton, GA 30117
|
1,216 sq. feet
|
1 baths 2 beds |
show details | |

|
#20
Mertis Ln
Carrollton, GA 30116
|
1,604 sq. feet
|
2 baths 3 beds |
show details |
| Photo | Address | Area | Beds / Baths | Price | Details |
|---|---|---|---|---|---|

|
#21
Liberty Church Rd
Carrollton, GA 30116
|
840 sq. feet
|
1 baths 2 beds |
show details | |

|
#22
Charlcie Ct
Carrollton, GA 30117
|
1,280 sq. feet
|
2 baths 3 beds |
show details | |

|
#23
Yosemite Ct
Carrollton, GA 30117
|
1,500 sq. feet
|
3 baths 4 beds |
show details | |

|
#24
Cross Plains Hulett Rd
Carrollton, GA 30116
|
1,851 sq. feet
|
2 baths 3 beds |
show details | |

|
#25
Maple St
Carrollton, GA 30117
|
1,486 sq. feet
|
2 baths 3 beds |
show details | |

|
#26
Cross Plains Hulett Rd
Carrollton, GA 30116
|
2,920 sq. feet
|
2 baths 3 beds |
show details | |

|
#27
King Dr
Carrollton, GA 30116
|
1,454 sq. feet
|
2 baths 3 beds |
show details | |

|
#28
Peek Dr
Carrollton, GA 30116
|
3,134 sq. feet
|
2 baths 3 beds |
show details | |

|
#29
Simonton Mill Rd
Carrollton, GA 30117
|
1,352 sq. feet
|
1 baths 3 beds |
show details | |

|
#30
Springflower Dr
Carrollton, GA 30116
|
1,704 sq. feet
|
2 baths 3 beds |
show details |
| Photo | Address | Area | Beds / Baths | Price | Details |
|---|---|---|---|---|---|

|
#31
Pine Hill Dr
Carrollton, GA 30116
|
1,420 sq. feet
|
1 baths 3 beds |
show details | |

|
#32
Old Airport Rd
Carrollton, GA 30116
|
1,315 sq. feet
|
1 baths 3 beds |
show details | |

|
#33
E Highway 166
Carrollton, GA 30116
|
1,472 sq. feet
|
1 baths 2 beds |
show details | |

|
#34
Cumberland Dr
Carrollton, GA 30117
|
2,712 sq. feet
|
2 baths 3 beds |
show details | |

|
#35
Oak Grove Rd
Carrollton, GA 30117
|
1,874 sq. feet
|
2 baths 3 beds |
show details | |

|
#36
Mount Zion Rd
Carrollton, GA 30117
|
720 sq. feet
|
1 baths 2 beds |
show details | |

|
#37
Davenport Mill Rd
Carrollton, GA 30117
|
1,389 sq. feet
|
1 baths 3 beds |
show details | |

|
#38
Castlegate Cir
Carrollton, GA 30116
|
1,764 sq. feet
|
1 baths 3 beds |
show details | |

|
#39
Rome St
Carrollton, GA 30117
|
1,880 sq. feet
|
2 baths 3 beds |
show details | |

|
#40
Folds Rd
Carrollton, GA 30116
|
1,884 sq. feet
|
2 baths 3 beds |
show details |
| Photo | Address | Area | Beds / Baths | Price | Details |
|---|---|---|---|---|---|

|
#41
W Honeysuckle Ln
Carrollton, GA 30116
|
2,820 sq. feet
|
3 baths 4 beds |
show details | |

|
#42
Lovvorn Rd
Carrollton, GA 30117
|
432 sq. feet
|
5 baths 7 beds |
show details | |

|
#43
Cedar St
Carrollton, GA 30117
|
1,902 sq. feet
|
2 baths 3 beds |
show details | |

|
#44
Meadow Cir
Carrollton, GA 30117
|
1,608 sq. feet
|
2 baths 4 beds |
show details | |

|
#45
Oak Grove Rd
Carrollton, GA 30117
|
2,886 sq. feet
|
2 baths 4 beds |
show details | |

|
#46
Cross Plains Hulett Rd
Carrollton, GA 30116
|
1,196 sq. feet
|
2 baths 3 beds |
show details | |

|
#47
Fairlawn Dr
Carrollton, GA 30117
|
1,423 sq. feet
|
- baths 3 beds |
show details | |

|
#48
Oak Grove Church Rd
Carrollton, GA 30117
|
1,524 sq. feet
|
- baths 3 beds |
show details | |

|
#49
Ballard Bridge Rd
Carrollton, GA 30117
|
936 sq. feet
|
- baths 3 beds |
show details | |

|
Check over 1 million property listings on Foreclosure.com!
|
browse all offers | |||


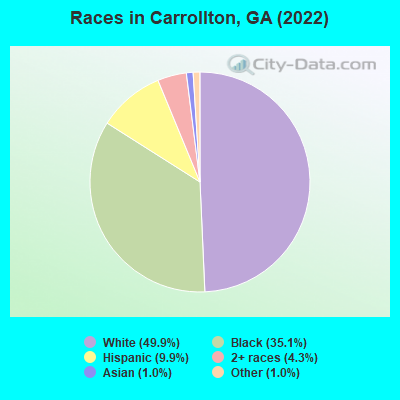
- 13,77949.9%White alone
- 9,69935.1%Black alone
- 2,7359.9%Hispanic
- 1,1794.3%Two or more races
- 2721.0%Asian alone
- 2721.0%Other race alone
- 150.05%American Indian alone
Races in Carrollton detailed stats: ancestries, foreign born residents, place of birth
According to our research of Georgia and other state lists, there were 175 registered sex offenders living in Carrollton, Georgia as of April 27, 2024.
The ratio of all residents to sex offenders in Carrollton is 151 to 1.
Type |
2009 |
2010 |
2011 |
2012 |
2013 |
2014 |
2015 |
2016 |
2017 |
2018 |
2019 |
2020 |
2021 |
2022 |
|---|---|---|---|---|---|---|---|---|---|---|---|---|---|---|
| Murders (per 100,000) | 2 (8.4) | 2 (8.2) | 1 (4.0) | 2 (8.1) | 1 (4.0) | 1 (4.0) | 2 (7.3) | 1 (3.8) | 0 (0.0) | 1 (3.7) | 0 (0.0) | 0 (0.0) | 1 (3.6) | 0 (0.0) |
| Rapes (per 100,000) | 11 (46.5) | 12 (49.2) | 17 (68.8) | 11 (44.4) | 14 (55.6) | 8 (31.6) | 9 (33.0) | 10 (37.6) | 14 (51.9) | 19 (69.9) | 13 (48.6) | 1 (3.6) | 28 (100.8) | 9 (32.3) |
| Robberies (per 100,000) | 25 (105.6) | 27 (110.7) | 25 (101.2) | 42 (169.5) | 31 (123.2) | 22 (86.9) | 25 (91.5) | 27 (101.5) | 38 (141.0) | 26 (95.6) | 11 (41.2) | 0 (0.0) | 14 (50.4) | 10 (35.9) |
| Assaults (per 100,000) | 270 (1,140) | 276 (1,132) | 66 (267.1) | 101 (407.7) | 78 (310.0) | 79 (312.1) | 93 (340.5) | 100 (376.0) | 94 (348.8) | 114 (419.3) | 52 (194.6) | 0 (0.0) | 97 (349.1) | 85 (305.3) |
| Burglaries (per 100,000) | 229 (967.1) | 254 (1,041) | 210 (849.9) | 225 (908.2) | 147 (584.2) | 162 (639.9) | 160 (585.9) | 125 (470.0) | 149 (552.9) | 129 (474.5) | 96 (359.2) | 1 (3.6) | 64 (230.3) | 53 (190.3) |
| Thefts (per 100,000) | 1,004 (4,240) | 1,117 (4,580) | 900 (3,642) | 838 (3,383) | 895 (3,557) | 1,007 (3,978) | 979 (3,585) | 957 (3,599) | 961 (3,566) | 951 (3,498) | 660 (2,470) | 12 (43.5) | 813 (2,926) | 651 (2,338) |
| Auto thefts (per 100,000) | 65 (274.5) | 40 (164.0) | 37 (149.7) | 30 (121.1) | 48 (190.7) | 35 (138.3) | 61 (223.4) | 34 (127.9) | 53 (196.7) | 42 (154.5) | 32 (119.7) | 0 (0.0) | 72 (259.1) | 32 (114.9) |
| Arson (per 100,000) | 8 (33.8) | 10 (41.0) | 10 (40.5) | 2 (8.1) | 3 (11.9) | 4 (15.8) | 2 (7.3) | 2 (7.5) | 1 (3.7) | 2 (7.4) | 3 (11.2) | 0 (0.0) | 4 (14.4) | 1 (3.6) |
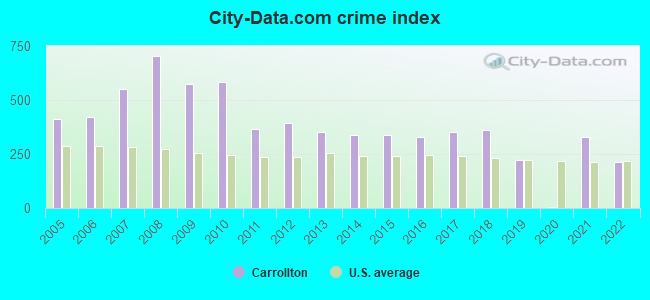
| City-Data.com crime index | 573.0 | 584.5 | 364.1 | 392.6 | 349.8 | 336.6 | 338.9 | 330.4 | 350.7 | 361.3 | 223.7 | 4.9 | 326.6 | 213.7 |
The City-Data.com crime index weighs serious crimes and violent crimes more heavily. Higher means more crime, U.S. average is 246.1. It adjusts for the number of visitors and daily workers commuting into cities.
Crime rate in Carrollton detailed stats: murders, rapes, robberies, assaults, burglaries, thefts, arson
Full-time law enforcement employees in 2021, including police officers: 87 (73 officers - 64 male; 9 female).
| Officers per 1,000 residents here: | 2.63 |
| Georgia average: | 2.45 |
 Recent articles from our blog. Our writers, many of them Ph.D. graduates or candidates, create easy-to-read articles on a wide variety of topics.


 | Moving to Carrollton, Georgia area (10 replies) |
| Found a job in Carrollton (15 replies) |
| Quaint main street hotels near Carrollton (0 replies) |
| Looking at Georgia to move from NY (8 replies) |
| Carrollton Georgia Comments (5 replies) |
| Exurban development Vs. Urbanization (35 replies) |
Latest news from Carrollton, GA collected exclusively by city-data.com from local newspapers, TV, and radio stations
Ancestries: American (29.7%), English (6.9%), Irish (4.2%), German (2.1%), European (2.0%), Scandinavian (1.4%).
Current Local Time: EST time zone
Elevation: 1110 feet
Land area: 20.2 square miles.
Population density: 1,351 people per square mile (low).
1,782 residents are foreign born (5.0% Latin America, 0.7% Asia).
| This city: | 6.5% |
| Georgia: | 10.4% |
Median real estate property taxes paid for housing units with mortgages in 2022: $1,982 (0.6%)
Median real estate property taxes paid for housing units with no mortgage in 2022: $1,292 (0.4%)
Nearest city with pop. 50,000+: Marietta, GA  (40.2 miles , pop. 58,748).
Nearest city with pop. 200,000+: Atlanta, GA (40.7 miles , pop. 416,474).
Nearest city with pop. 1,000,000+: Chicago, IL (588.7 miles , pop. 2,896,016).
Nearest cities:
), )Latitude: 33.58 N, Longitude: 85.08 W
Daytime population change due to commuting: +15,681 (+56.8%)
Workers who live and work in this city: 8,293 (64.9%)
Area codes: 678, 770

Carrollton, Georgia accommodation & food services, waste management - Economy and Business Data
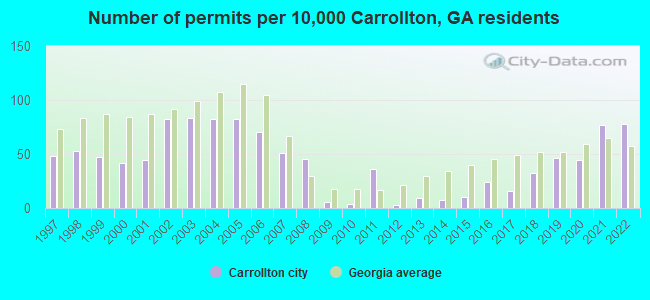
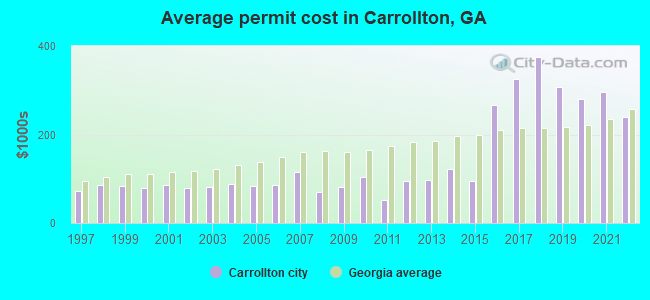
Single-family new house construction building permits:
- 2022: 154 buildings, average cost: $239,700
- 2021: 152 buildings, average cost: $296,500
- 2020: 87 buildings, average cost: $280,800
- 2019: 91 buildings, average cost: $307,300
- 2018: 64 buildings, average cost: $374,600
- 2017: 31 buildings, average cost: $326,300
- 2016: 47 buildings, average cost: $267,000
- 2015: 20 buildings, average cost: $94,400
- 2014: 14 buildings, average cost: $121,400
- 2013: 18 buildings, average cost: $98,400
- 2012: 6 buildings, average cost: $95,700
- 2011: 72 buildings, average cost: $50,600
- 2010: 8 buildings, average cost: $103,000
- 2009: 12 buildings, average cost: $81,000
- 2008: 90 buildings, average cost: $69,400
- 2007: 101 buildings, average cost: $115,000
- 2006: 138 buildings, average cost: $87,200
- 2005: 163 buildings, average cost: $83,100
- 2004: 163 buildings, average cost: $88,800
- 2003: 164 buildings, average cost: $80,600
- 2002: 162 buildings, average cost: $78,400
- 2001: 88 buildings, average cost: $87,100
- 2000: 83 buildings, average cost: $79,200
- 1999: 93 buildings, average cost: $82,600
- 1998: 105 buildings, average cost: $85,500
- 1997: 96 buildings, average cost: $72,600
| Here: | 3.3% |
| Georgia: | 2.9% |
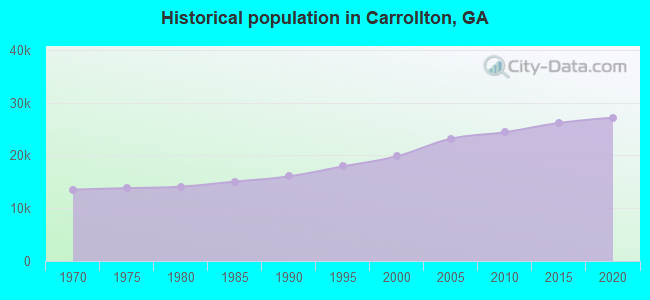
Population change in the 1990s: +3,312 (+20.0%).
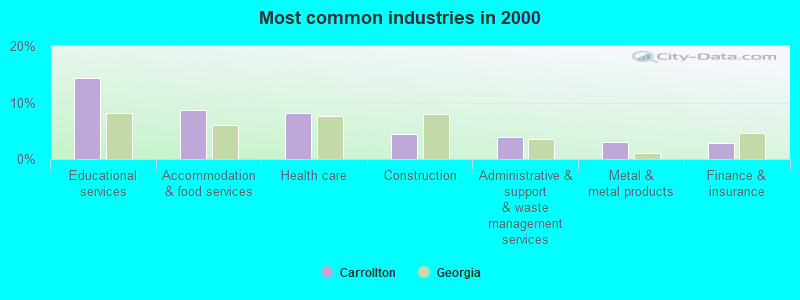
- Educational services (14.4%)
- Accommodation & food services (8.6%)
- Health care (8.2%)
- Construction (4.3%)
- Administrative & support & waste management services (3.9%)
- Metal & metal products (3.0%)
- Finance & insurance (2.9%)
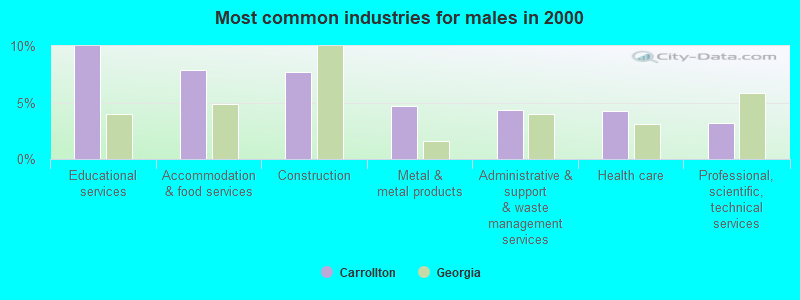
- Educational services (10.0%)
- Accommodation & food services (7.9%)
- Construction (7.7%)
- Metal & metal products (4.7%)
- Administrative & support & waste management services (4.4%)
- Health care (4.2%)
- Professional, scientific, technical services (3.2%)
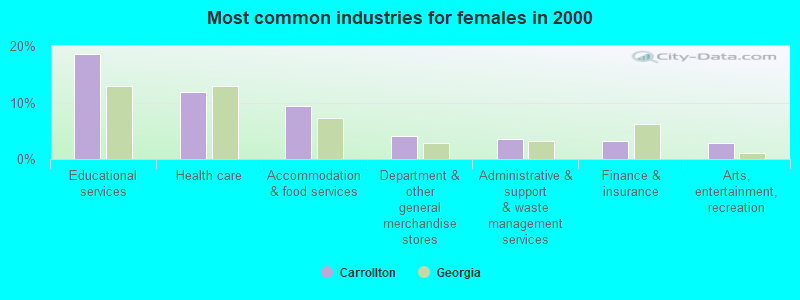
- Educational services (18.5%)
- Health care (11.9%)
- Accommodation & food services (9.3%)
- Department & other general merchandise stores (4.0%)
- Administrative & support & waste management services (3.5%)
- Finance & insurance (3.2%)
- Arts, entertainment, recreation (2.8%)
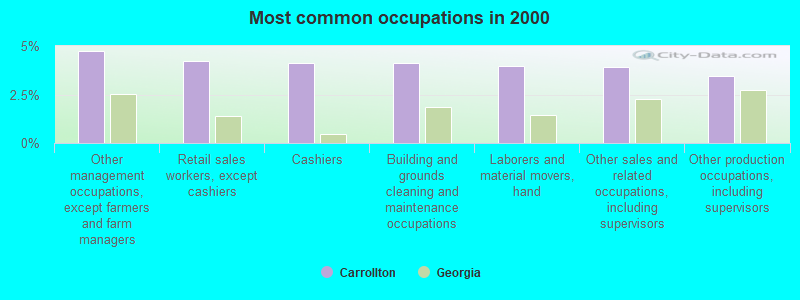
- Other management occupations, except farmers and farm managers (4.8%)
- Retail sales workers, except cashiers (4.2%)
- Cashiers (4.1%)
- Building and grounds cleaning and maintenance occupations (4.1%)
- Laborers and material movers, hand (4.0%)
- Other sales and related occupations, including supervisors (3.9%)
- Other production occupations, including supervisors (3.5%)
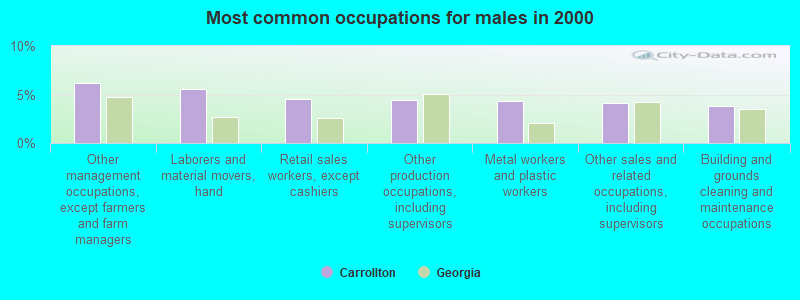
- Other management occupations, except farmers and farm managers (6.1%)
- Laborers and material movers, hand (5.6%)
- Retail sales workers, except cashiers (4.5%)
- Other production occupations, including supervisors (4.5%)
- Metal workers and plastic workers (4.3%)
- Other sales and related occupations, including supervisors (4.1%)
- Building and grounds cleaning and maintenance occupations (3.8%)
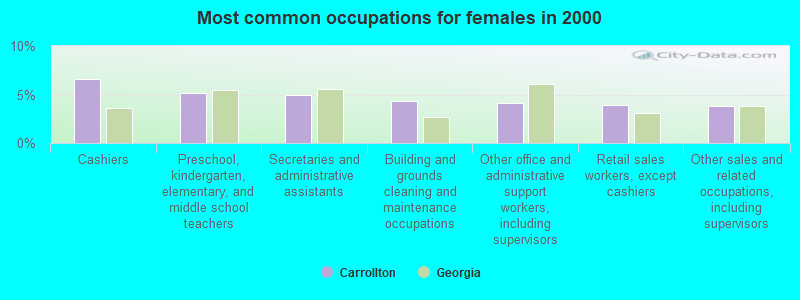
- Cashiers (6.6%)
- Preschool, kindergarten, elementary, and middle school teachers (5.2%)
- Secretaries and administrative assistants (5.0%)
- Building and grounds cleaning and maintenance occupations (4.4%)
- Other office and administrative support workers, including supervisors (4.2%)
- Retail sales workers, except cashiers (3.9%)
- Other sales and related occupations, including supervisors (3.8%)
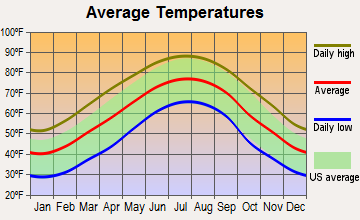
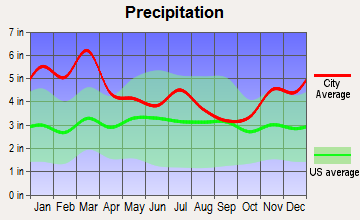
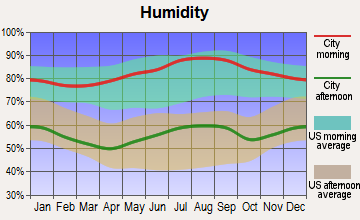
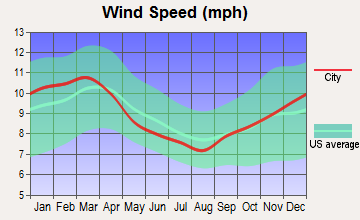
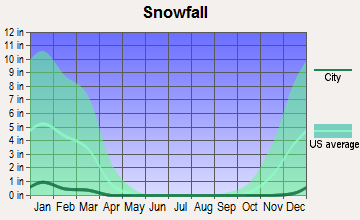
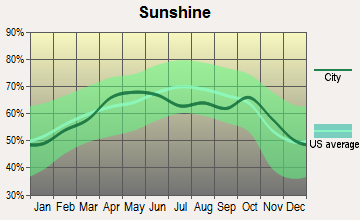
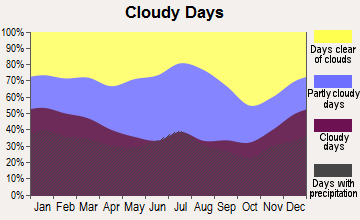
Average climate in Carrollton, Georgia
Based on data reported by over 4,000 weather stations
(lower is better)
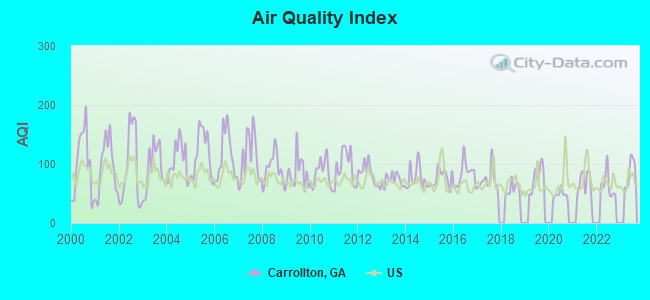
Air Quality Index (AQI) level in 2022 was 63.8. This is about average.
| City: | 63.8 |
| U.S.: | 72.6 |
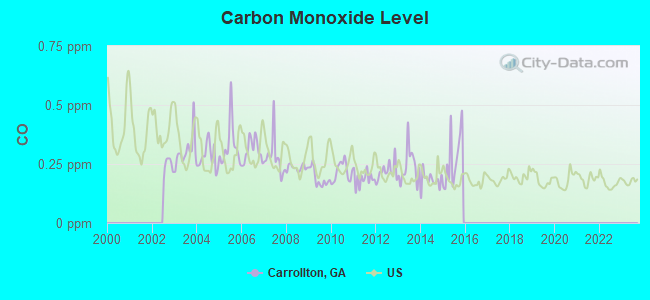
Carbon Monoxide (CO) [ppm] level in 2015 was 0.248. This is about average. Closest monitor was 24.1 miles away from the city center.
| City: | 0.248 |
| U.S.: | 0.251 |
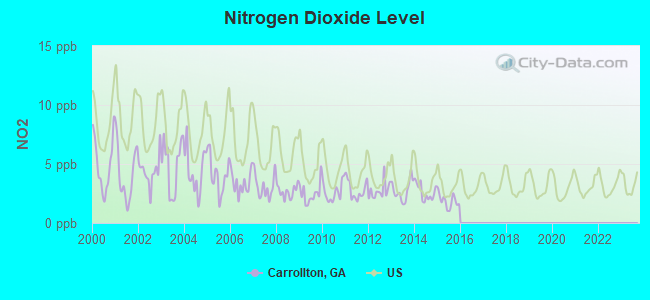
Nitrogen Dioxide (NO2) [ppb] level in 2015 was 1.87. This is significantly better than average. Closest monitor was 24.1 miles away from the city center.
| City: | 1.87 |
| U.S.: | 5.11 |
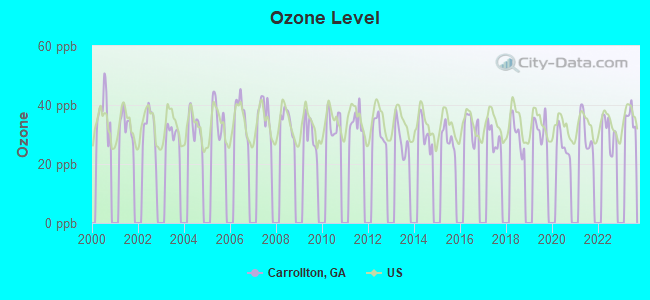
Ozone [ppb] level in 2022 was 31.1. This is about average. Closest monitor was 20.5 miles away from the city center.
| City: | 31.1 |
| U.S.: | 33.3 |
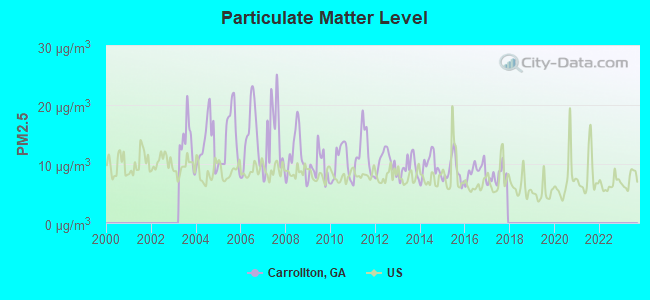
Particulate Matter (PM2.5) [µg/m3] level in 2017 was 7.90. This is about average. Closest monitor was 24.1 miles away from the city center.
| City: | 7.90 |
| U.S.: | 8.11 |
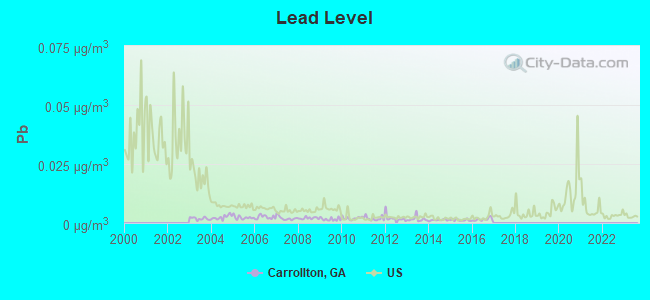
Lead (Pb) [µg/m3] level in 2016 was 0.00153. This is significantly better than average. Closest monitor was 1.3 miles away from the city center.
| City: | 0.00153 |
| U.S.: | 0.00931 |
Tornado activity:
Carrollton-area historical tornado activity is above Georgia state average. It is 81% greater than the overall U.S. average.
On 11/22/1992, a category F4 (max. wind speeds 207-260 mph) tornado 33.1 miles away from the Carrollton city center injured 46 people and caused between $5,000,000 and $50,000,000 in damages.
On 12/24/1964, a category F3 (max. wind speeds 158-206 mph) tornado 10.6 miles away from the city center injured one person and caused between $50,000 and $500,000 in damages.
Earthquake activity:
Carrollton-area historical earthquake activity is significantly above Georgia state average. It is 70% greater than the overall U.S. average.On 4/29/2003 at 08:59:39, a magnitude 4.9 (4.4 MB, 4.6 MW, 4.9 LG, Class: Light, Intensity: IV - V) earthquake occurred 70.6 miles away from the city center
On 4/29/2003 at 08:59:39, a magnitude 4.6 (4.6 MW, Depth: 12.3 mi) earthquake occurred 70.7 miles away from the city center
On 1/18/1999 at 07:00:53, a magnitude 4.8 (4.8 MB, 4.0 LG, Depth: 0.6 mi) earthquake occurred 126.2 miles away from the city center
On 8/2/1974 at 08:52:09, a magnitude 4.9 (4.3 MB, 4.9 LG) earthquake occurred 150.3 miles away from Carrollton center
On 11/30/1973 at 07:48:41, a magnitude 4.7 (4.7 MB, 4.6 ML) earthquake occurred 166.0 miles away from Carrollton center
On 10/24/1997 at 08:35:17, a magnitude 4.9 (4.8 MB, 4.2 MS, 4.9 LG, Depth: 6.2 mi) earthquake occurred 213.0 miles away from the city center
Magnitude types: regional Lg-wave magnitude (LG), body-wave magnitude (MB), local magnitude (ML), surface-wave magnitude (MS), moment magnitude (MW)
Natural disasters:
The number of natural disasters in Carroll County (16) is near the US average (15).Major Disasters (Presidential) Declared: 11
Emergencies Declared: 4
Causes of natural disasters: Floods: 6, Storms: 5, Tornadoes: 4, Winter Storms: 4, Hurricanes: 3, Heavy Rains: 2, Drought: 1, Snowfall: 1, Tropical Storm: 1, Wind: 1, Other: 1 (Note: some incidents may be assigned to more than one category).
Main business address for: WGNB CORP (NATIONAL COMMERCIAL BANKS).
Hospitals in Carrollton:
- HOSPICE CARE-A PART OF TANNER (710 DIXIE STREET)
- TANNER MEDICAL CENTER - CARROLLTON (Government - Hospital District or Authority, 705 DIXIE STREET)
Nursing Homes in Carrollton:
- BAGWELL NH (443 BAGWELL RD)
- CARROLL CONVALESCENT CENTER (2327 N HIGHWAY 27)
- CARROLLTON MANOR (2466 OAK GROVE CHURCH ROAD BOX 1216)
- CARROLLTON MANOR, INCORPORATED (2455 OAK GROVE CHURCH ROAD)
- CARROLLTON NURSING AND REHAB CTR (2327 NORTH HIGHWAY 27)
- OAKS OF CARROLLTON, THE (921 OLD NEWNAN ROAD)
- PINE KNOLL NH (PO BOX 189)
- PINE KNOLL NURSING AND REHAB CTR (156 PINE KNOLL DRIVE)
- TANNER MED CTR SUBACUTE CARE U (705 DIXIE STREET)
Dialysis Facilities in Carrollton:
- FRESENIUS MEDICAL CARE CARROL COUNTY (157 CLINIC AVENUE)
- NORTH CARROLLTON DIALYSIS (195 PARKWOOD CIR)
Home Health Centers in Carrollton:
Airports and heliports located in Carrollton:
- West Georgia Regional - O V Gray Field Airport (CTJ) (Runways: 1, Itinerant Ops: 12,000, Local Ops: 12,000, Military Ops: 500)
- C&r Farm Airport (78GA) (Runways: 1)
- Falcons Aerie Airport (8GA8) (Runways: 1)
- Flying W Farms Airport (6GA8) (Runways: 1)
- Wilson International Airport (27GA) (Runways: 1)
- Tanner Medical Center Heliport (3GA2)
College/University in Carrollton:
Other colleges/universities with over 2000 students near Carrollton:
- West Georgia Technical College (about 10 miles; Waco, GA; Full-time enrollment: 4,768)
- Chattahoochee Technical College (about 39 miles; Marietta, GA; FT enrollment: 8,173)
- Atlanta Metropolitan State College (about 40 miles; Atlanta, GA; FT enrollment: 2,437)
- Atlanta Technical College (about 40 miles; Atlanta, GA; FT enrollment: 4,217)
- Morehouse College (about 40 miles; Atlanta, GA; FT enrollment: 2,379)
- Clark Atlanta University (about 40 miles; Atlanta, GA; FT enrollment: 3,201)
- Spelman College (about 41 miles; Atlanta, GA; FT enrollment: 2,383)
Public high schools in Carrollton:
- CARROLLTON HIGH SCHOOL (Students: 1,193, Location: 202 TROJAN DR, Grades: 9-12)
- CENTRAL HIGH SCHOOL (Location: 113 CENTRAL HIGH RD, Grades: 9-12)
- MT. ZION HIGH SCHOOL (Location: 280 EUREKA CHURCH RD, Grades: 9-12)
Private high schools in Carrollton:
Public elementary/middle schools in Carrollton:
- CENTRAL ELEMENTARY SCHOOL (Students: 1,002, Location: 175 PRIMARY SCHOOL RD, Grades: PK-5)
- CARROLLTON JR. HIGH SCHOOL (Students: 948, Location: 510 BEN SCOTT BLVD, Grades: 7-8)
- SAND HILL ELEMENTARY SCHOOL (Students: 777, Location: 45 SANDHILL SCHOOL RD, Grades: PK-5)
- SHARP CREEK ELEMENTARY SCHOOL (Students: 730, Location: 115 OLD MUSE RD, Grades: PK-5)
- CARROLLTON ELEMENTARY SCHOOL (Students: 615, Location: 401 BEN SCOTT BLVD, Grades: PK-3)
- MOUNT ZION ELEMENTARY SCHOOL (Location: 260 EUREKA CHURCH RD, Grades: PK-5)
- CENTRAL MIDDLE SCHOOL (Location: 155 WHOOPING CREEK RD, Grades: 6-8)
- MT. ZION MIDDLE SCHOOL (Location: 132 MOUNT ZION ST, Grades: 6-8)
- CARROLLTON MIDDLE-UPPER ELEMENTARY SCHOOL (Location: 151 TOM REEVES DR, Grades: 4-6)
Private elementary/middle school in Carrollton:
Library in Carrollton:
User-submitted facts and corrections:
- The official name of the university located in Carrollton, GA is "University of West Georgia." The name you have listed, "State University of West Georgia" was changed in 2003. added by Larry
- Strongest AM radio stations covering Carrollton - WVCC 720AM, 10,000 watts Newnan, GA owned by Clear Channel Strongest FM stations covering Carrollton - WMGP - 98.1 FM 25,000 Watts Hogansville, GA owned by Clear Channel
Points of interest:
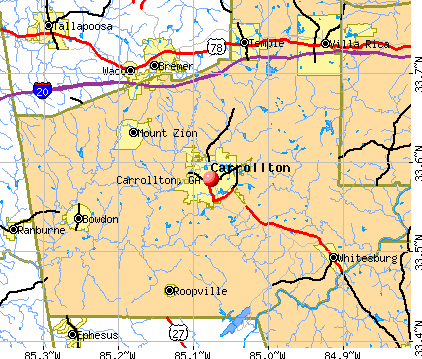
Notable locations in Carrollton: Sunset Hills Country Club (A), Carrollton Waterworks (B), Carrollton Industrial Park (C), Carrollton Fire Department Station 22 (D), Carroll County Fire / Rescue Headquarters (E), Carrollton Fire Department (F), Carrollton City Hall (G), Carroll County Jail (H), Carroll County Courthouse (I), Neva Lomason Memorial Library (J), Irvine Sullivan Ingram Library (K). Display/hide their locations on the map
Shopping Center: West Georgia Shopping Center (1). Display/hide its location on the map
Main business address in Carrollton: WGNB CORP (A). Display/hide its location on the map
Churches in Carrollton include: Moores Chapel Methodist Church (A), Mount Zion Baptist Church (B), Peachtree Baptist Church (C), Saint Andrew Methodist Church (D), Saint Margarets Episcopal Church (E), Saint Paul African Methodist Episcopal Church (F), Tabernacle Baptist Church (G), West Carrollton Baptist Church (H), West View Baptist Church (I). Display/hide their locations on the map
Cemeteries: King Street Cemetery (1), Stripling Chapel Cemetery (2), Carrollton City Cemetery (3). Display/hide their locations on the map
Reservoirs: Lake Carroll (A), Sunset Hills Country Club Lake (B), Richards Lake (C), Barnes Lake (D), Moore Lake (E). Display/hide their locations on the map
Streams, rivers, and creeks: Curtis Creek (A), Buck Creek (B), Pine Tucky Branch (C), Camp Creek (D). Display/hide their locations on the map
Parks in Carrollton include: South Carrollton Residential Historic District (1), Adamson Square (2), Grisham Stadium (3). Display/hide their locations on the map
Tourist attraction: Carrollton Area Convention & Visitors Bureau (104 North Lakeshore Drive) (1). Display/hide its approximate location on the map
Hotels: Crossroads Days Inn (180 Centennial Rd) (1), Banning Mills Historic Country N & Conference Center (205 Horseshoe Dam Road) (2), Budget Inn of Carrollton (405 Columbia Drive) (3), Hampton Inn (102 South Cottage Hill Road) (4), Country Hearth Inn - Carrollton (901 Highway 27 South) (5), Efficiency Lodge (780 Bankhead Highway) (6), Hampton Inn Carrollton- GA (102 South Cottage Hill Road) (7). Display/hide their approximate locations on the map
Courts: Carroll County - State Court Clerk Civil (323 Newnan Street Ofc) (1), Carroll County - State Court Judge- Judge of State Court (323 Newnan Street Ofc) (2), Carroll County - State Court Solicitor- Solicitor's Office (323 Newnan Street Ofc) (3), Carroll County - Magistrate Court (323 Newnan Street Ofc) (4), Carroll County - Superior Court- Judge John Simpson (323 Newnan Street Ofc) (5), Carroll County - Traffic Court Fines- State Court Fines- Fines State C (323 Newnan Street Ofc) (6), Ga Superior Court Clerks Authority (311 Newnan Street) (7), Carroll County - Clerk of Juvenile Court- Superior Court- Judge Aubrey D (323 Newnan Street Ofc) (8), Carroll County - Deed Records- Court House- Notary Public Appointment (323 Newnan Street Ofc) (9). Display/hide their approximate locations on the map
Birthplace of: Jamie Henderson - 2005 NFL player (New York Jets, born: Jan 1, 1979), Reggie Brown - 2005 NFL player (Philadelphia Eagles, born: Jan 13, 1981), Tommy West (American football) - Football player and coach, Corey Crowder - Basketball player, Don Wix - Politician, Red Roberts - Baseball player, Steve Moore (racing driver) - Racing driver, Steve Thomas - College basketball player (Middle Tenn. St. Blue Raiders).
Drinking water stations with addresses in Carrollton and their reported violations in the past:
CARROLL COUNTY (Population served: 35,770, Surface water):Past monitoring violations:CARROLLTON (Population served: 24,310, Surface water):
- Record Keeping - In OCT-10-2007, Contaminant: IESWTR. Follow-up actions: St Compliance achieved (JAN-31-2010), St Public Notif requested (MAR-25-2010), St AO (w/penalty) issued (MAR-25-2010), St Public Notif received (MAY-06-2010), St Admin Penalty assessed (MAY-06-2010)
- Follow-up Or Routine LCR Tap M/R - In OCT-01-1999, Contaminant: Lead and Copper Rule. Follow-up actions: St Compliance achieved (OCT-03-2001), St Intentional no-action (SEP-23-2003)
Past health violations:COOKS MOBILE HOME PARK (Population served: 104, Groundwater):Past monitoring violations:
- MCL, Monthly (TCR) - In MAY-2013, Contaminant: Coliform. Follow-up actions: St Public Notif requested (JUN-06-2013), St Violation/Reminder Notice (JUN-06-2013), St Public Notif received (JUL-26-2013)
- Monitoring of Treatment (SWTR-Filter) - In JUL-2011. Follow-up actions: St Compliance achieved (AUG-01-2011), St Public Notif requested (DEC-06-2012), St Violation/Reminder Notice (DEC-06-2012)
- Monitoring of Treatment (SWTR-Filter) - In AUG-2010. Follow-up actions: St Compliance achieved (SEP-02-2010), St Public Notif requested (SEP-15-2010), St Violation/Reminder Notice (SEP-15-2010)
- Follow-up Or Routine LCR Tap M/R - In OCT-01-1996, Contaminant: Lead and Copper Rule. Follow-up actions: St Compliance achieved (AUG-19-2002), St Intentional no-action (SEP-23-2003)
Past monitoring violations:
- One routine major monitoring violation
| This city: | 2.5 people |
| Georgia: | 2.6 people |
| This city: | 54.6% |
| Whole state: | 68.5% |
| This city: | 6.9% |
| Whole state: | 5.9% |
Likely homosexual households (counted as self-reported same-sex unmarried-partner households)
- Lesbian couples: 0.3% of all households
- Gay men: 0.2% of all households
People in group quarters in Carrollton in 2010:
- 2,382 people in college/university student housing
- 776 people in local jails and other municipal confinement facilities
- 106 people in nursing facilities/skilled-nursing facilities
- 21 people in emergency and transitional shelters (with sleeping facilities) for people experiencing homelessness
- 21 people in group homes intended for adults
People in group quarters in Carrollton in 2000:
- 2,104 people in college dormitories (includes college quarters off campus)
- 485 people in local jails and other confinement facilities (including police lockups)
- 268 people in nursing homes
- 71 people in other noninstitutional group quarters
- 44 people in other nonhousehold living situations
- 9 people in homes for the mentally retarded
Banks with most branches in Carrollton (2011 data):
- Synovus Bank: Bankhead Branch, Southpark Branch, College Street Branch. Info updated 2011/01/25: Bank assets: $26,863.3 mil, Deposits: $22,415.0 mil, headquarters in Columbus, GA, positive income, Commercial Lending Specialization, 296 total offices, Holding Company: Synovus Financial Corp.
- Community & Southern Bank: Motor Bank Branch, First Tuesday Mall Branch, at 201 Maple Street. Info updated 2010/09/20: Bank assets: $2,188.5 mil, Deposits: $1,690.2 mil, local headquarters, positive income, Commercial Lending Specialization, 39 total offices, Holding Company: Community & Southern Holdings, Inc.
- CertusBank, National Association: Carrollton Branch at 100 Tom Reeve Drive, branch established on 2003/11/03; Courier Service at 100 Tom Reeve Drive, branch established on 2010/01/04. Info updated 2011/05/23: Bank assets: $1,817.6 mil, Deposits: $1,457.3 mil, headquarters in Easley, SC, positive income, Commercial Lending Specialization, 36 total offices, Holding Company: Certusholdings, Inc.
- Branch Banking and Trust Company: Mcintosh Plaza Branch at 1119 South Park Street, branch established on 1991/09/16; Carrollton Main Branch at 110 Dixie Street, branch established on 1929/01/01. Info updated 2010/03/29: Bank assets: $168,867.6 mil, Deposits: $127,549.5 mil, headquarters in Winston Salem, NC, positive income, Commercial Lending Specialization, 1793 total offices, Holding Company: Bb&T Corporation
- SunTrust Bank: Crossroads Branch at 1371 South Park Street, branch established on 1988/07/22. Info updated 2010/05/27: Bank assets: $171,291.7 mil, Deposits: $129,833.2 mil, headquarters in Atlanta, GA, positive income, Commercial Lending Specialization, 1716 total offices, Holding Company: Suntrust Banks, Inc.
- Wells Fargo Bank, National Association: Carrollton Branch at 848 Bankhead Why, branch established on 1986/06/30. Info updated 2011/04/05: Bank assets: $1,161,490.0 mil, Deposits: $905,653.0 mil, headquarters in Sioux Falls, SD, positive income, 6395 total offices, Holding Company: Wells Fargo & Company
- Bank of America, National Association: Maple Street Branch at 600 Maple Street, branch established on 1965/05/10. Info updated 2009/11/18: Bank assets: $1,451,969.3 mil, Deposits: $1,077,176.8 mil, headquarters in Charlotte, NC, positive income, 5782 total offices, Holding Company: Bank Of America Corporation
- United Community Bank: Ucb West Georgia Branch at 119 Maple Street, branch established on 1997/03/03. Info updated 2009/06/23: Bank assets: $6,977.4 mil, Deposits: $6,170.1 mil, headquarters in Blairsville, GA, negative income in the last year, Commercial Lending Specialization, 106 total offices, Holding Company: United Community Banks, Inc.
- CharterBank: Mcintosh Commercial Bank Branch at 820 Dixie Street, branch established on 2002/11/05. Info updated 2011/09/12: Bank assets: $1,115.4 mil, Deposits: $869.2 mil, headquarters in West Point, GA, positive income, Commercial Lending Specialization, 23 total offices
For population 15 years and over in Carrollton:
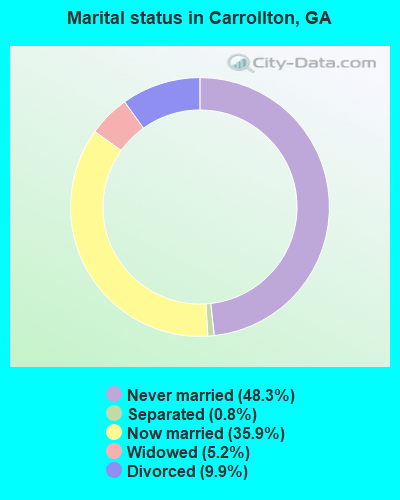
- Never married: 48.3%
- Now married: 35.9%
- Separated: 0.8%
- Widowed: 5.2%
- Divorced: 9.9%
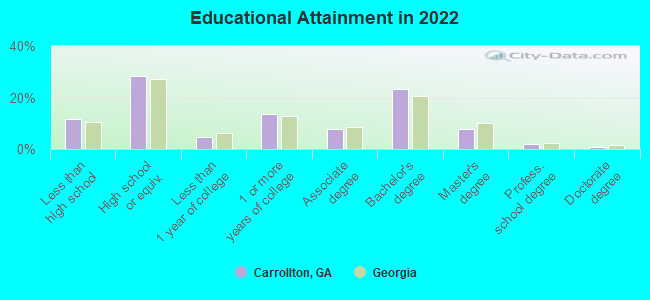
For population 25 years and over in Carrollton:
- High school or higher: 86.4%
- Bachelor's degree or higher: 31.1%
- Graduate or professional degree: 9.7%
- Unemployed: 6.8%
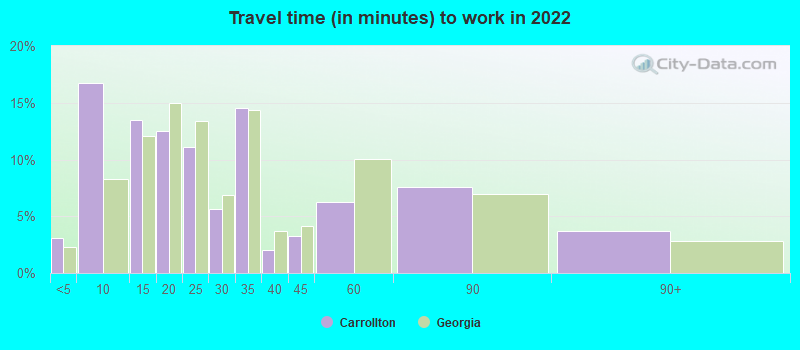
- Mean travel time to work (commute): 19.0 minutes
| Here: | 12.1 |
| Georgia average: | 12.2 |
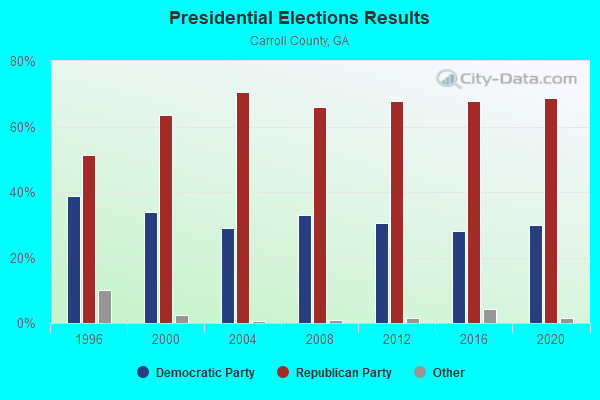
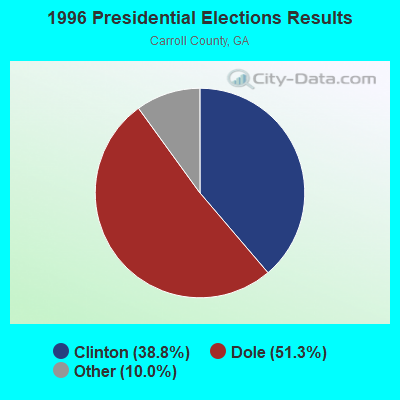
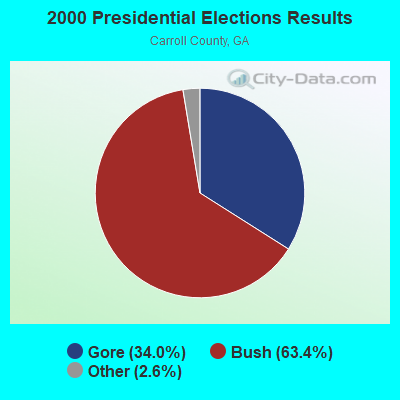

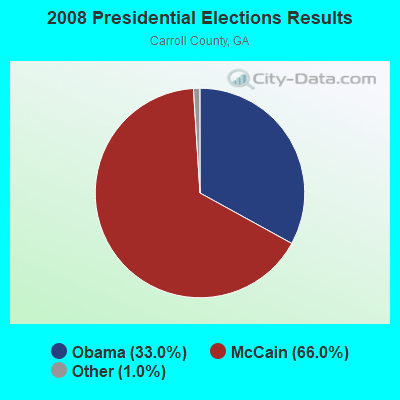

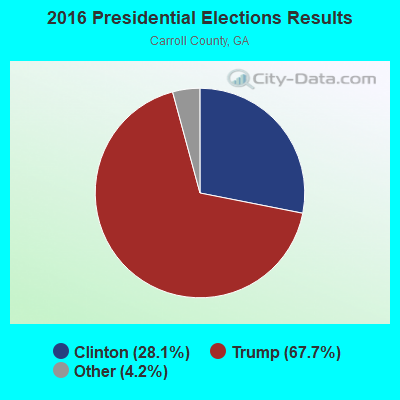
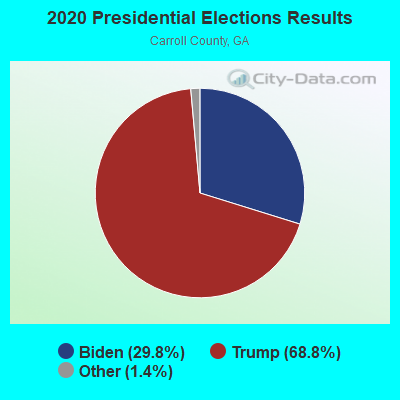
Graphs represent county-level data. Detailed 2008 Election Results
Neighborhoods in Carrollton:
(Carrollton, Georgia Neighborhood Map)Religion statistics for Carrollton, GA (based on Carroll County data)
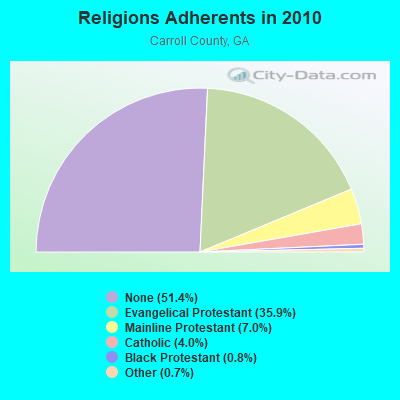
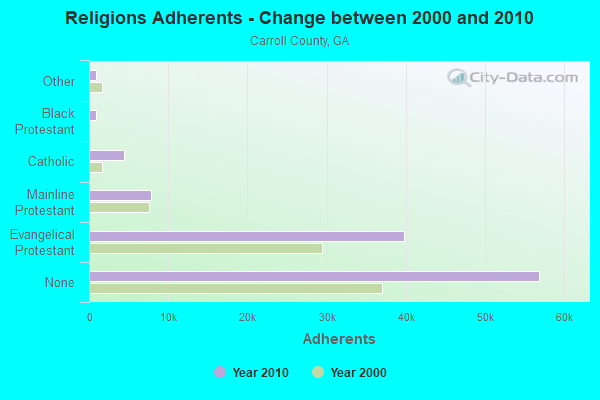
| Religion | Adherents | Congregations |
|---|---|---|
| Evangelical Protestant | 39,730 | 116 |
| Mainline Protestant | 7,792 | 28 |
| Catholic | 4,462 | 1 |
| Black Protestant | 867 | 6 |
| Other | 826 | 3 |
| None | 56,850 | - |
Food Environment Statistics:
| Carroll County: | 1.88 / 10,000 pop. |
| Georgia: | 1.91 / 10,000 pop. |
| Carroll County: | 0.09 / 10,000 pop. |
| State: | 0.15 / 10,000 pop. |
| Carroll County: | 1.16 / 10,000 pop. |
| Georgia: | 0.86 / 10,000 pop. |
| Carroll County: | 5.81 / 10,000 pop. |
| Georgia: | 5.12 / 10,000 pop. |
| Here: | 6.53 / 10,000 pop. |
| Georgia: | 7.41 / 10,000 pop. |
| Carroll County: | 10.6% |
| State: | 10.4% |
| Carroll County: | 30.8% |
| Georgia: | 27.8% |
| Carroll County: | 13.1% |
| Georgia: | 14.6% |
Health and Nutrition:
| This city: | 47.2% |
| Georgia: | 48.9% |
| Carrollton: | 44.6% |
| Georgia: | 46.5% |
| This city: | 28.6 |
| Georgia: | 28.9 |
| This city: | 20.4% |
| Georgia: | 20.4% |
| This city: | 12.6% |
| Georgia: | 10.8% |
| Here: | 6.8 |
| Georgia: | 6.7 |
| Here: | 30.7% |
| Georgia: | 33.5% |
| Carrollton: | 55.1% |
| Georgia: | 56.2% |
| Here: | 80.8% |
| Georgia: | 80.8% |
More about Health and Nutrition of Carrollton, GA Residents
| Local government employment and payroll (March 2022) | |||||
| Function | Full-time employees | Monthly full-time payroll | Average yearly full-time wage | Part-time employees | Monthly part-time payroll |
|---|---|---|---|---|---|
| Police Protection - Officers | 74 | $329,247 | $53,391 | 0 | $0 |
| Firefighters | 63 | $287,383 | $54,740 | 0 | $0 |
| Parks and Recreation | 52 | $193,639 | $44,686 | 90 | $56,307 |
| Solid Waste Management | 42 | $168,230 | $48,066 | 0 | $0 |
| Other Government Administration | 20 | $102,037 | $61,222 | 0 | $0 |
| Sewerage | 17 | $73,178 | $51,655 | 0 | $0 |
| Water Supply | 16 | $70,299 | $52,724 | 0 | $0 |
| Judicial and Legal | 9 | $31,343 | $41,791 | 3 | $365 |
| Streets and Highways | 6 | $37,607 | $75,214 | 0 | $0 |
| Financial Administration | 6 | $32,763 | $65,526 | 1 | $380 |
| Other and Unallocable | 4 | $22,236 | $66,708 | 0 | $0 |
| Housing and Community Development (Local) | 1 | $3,966 | $47,592 | 0 | $0 |
| Police - Other | 0 | $0 | 10 | $14,512 | |
| Totals for Government | 310 | $1,351,928 | $52,333 | 104 | $71,564 |
Carrollton government finances - Expenditure in 2021 (per resident):
- Construction - General Public Buildings: $1,892,000 ($69.40)
- Current Operations - Police Protection: $8,673,000 ($318.14)
Water Utilities: $7,132,000 ($261.61)
Parks and Recreation: $5,662,000 ($207.69)
Local Fire Protection: $5,643,000 ($206.99)
Solid Waste Management: $5,233,000 ($191.95)
Sewerage: $5,149,000 ($188.87)
General - Other: $2,519,000 ($92.40)
General Public Buildings: $1,256,000 ($46.07)
Central Staff Services: $1,197,000 ($43.91)
Financial Administration: $766,000 ($28.10)
Housing and Community Development: $421,000 ($15.44)
Libraries: $300,000 ($11.00)
Judicial and Legal Services: $292,000 ($10.71)
Regular Highways: $147,000 ($5.39)
Protective Inspection and Regulation - Other: $91,000 ($3.34)
- General - Interest on Debt: $252,000 ($9.24)
- Intergovernmental to Local - Other - Correctional Institutions: $9,000 ($0.33)
- Other Capital Outlay - Regular Highways: $4,674,000 ($171.45)
Parks and Recreation: $1,681,000 ($61.66)
Local Fire Protection: $552,000 ($20.25)
Police Protection: $373,000 ($13.68)
General - Other: $320,000 ($11.74)
General Public Building: $87,000 ($3.19)
Financial Administration: $22,000 ($0.81)
- Water Utilities - Interest on Debt: $67,000 ($2.46)
Carrollton government finances - Revenue in 2021 (per resident):
- Charges - Sewerage: $9,876,000 ($362.26)
Solid Waste Management: $5,088,000 ($186.63)
Other: $1,171,000 ($42.95)
Parks and Recreation: $1,091,000 ($40.02)
- Federal Intergovernmental - Other: $749,000 ($27.47)
- Local Intergovernmental - Other: $7,170,000 ($263.00)
General Local Government Support: $5,782,000 ($212.09)
- Miscellaneous - Fines and Forfeits: $1,089,000 ($39.95)
General Revenue - Other: $512,000 ($18.78)
Rents: $153,000 ($5.61)
Donations From Private Sources: $138,000 ($5.06)
Interest Earnings: $57,000 ($2.09)
Sale of Property: $4,000 ($0.15)
- Revenue - Water Utilities: $5,282,000 ($193.75)
- State Intergovernmental - Other: $2,513,000 ($92.18)
General Local Government Support: $18,000 ($0.66)
- Tax - Property: $5,374,000 ($197.12)
Public Utilities Sales: $2,537,000 ($93.06)
Insurance Premiums Sales: $1,958,000 ($71.82)
Occupation and Business License - Other: $1,467,000 ($53.81)
Alcoholic Beverage Sales: $842,000 ($30.89)
Other Selective Sales: $772,000 ($28.32)
Alcoholic Beverage License: $289,000 ($10.60)
Other License: $275,000 ($10.09)
Other: $211,000 ($7.74)
Carrollton government finances - Debt in 2021 (per resident):
- Long Term Debt - Beginning Outstanding - Public Debt for Private Purpose: $422,147,000 ($15484.81)
Outstanding Nonguaranteed - Industrial Revenue: $374,086,000 ($13721.88)
Retired Nonguaranteed - Public Debt for Private Purpose: $48,061,000 ($1762.93)
Beginning Outstanding - Unspecified Public Purpose: $6,470,000 ($237.33)
Outstanding Unspecified Public Purpose: $4,233,000 ($155.27)
Retired Unspecified Public Purpose: $2,238,000 ($82.09)
Carrollton government finances - Cash and Securities in 2021 (per resident):
- Other Funds - Cash and Securities: $30,240,000 ($1109.24)
- Sinking Funds - Cash and Securities: $374,086,000 ($13721.88)
| Businesses in Carrollton, GA | ||||
| Name | Count | Name | Count | |
|---|---|---|---|---|
| AT&T | 1 | Kroger | 1 | |
| Ace Hardware | 1 | La-Z-Boy | 1 | |
| Advance Auto Parts | 1 | Lane Furniture | 2 | |
| Applebee's | 1 | Little Caesars Pizza | 1 | |
| Arby's | 1 | Long John Silver's | 1 | |
| AutoZone | 2 | Lowe's | 1 | |
| Bath & Body Works | 1 | McDonald's | 3 | |
| Best Western | 1 | New Balance | 1 | |
| Blockbuster | 1 | Nike | 3 | |
| Burger King | 2 | Nissan | 1 | |
| CVS | 2 | Payless | 1 | |
| Chevrolet | 1 | Penske | 1 | |
| Chick-Fil-A | 2 | Pizza Hut | 2 | |
| Church's Chicken | 1 | Publix Super Markets | 1 | |
| ColorTyme | 1 | Quiznos | 2 | |
| Curves | 1 | RadioShack | 1 | |
| DHL | 1 | Rite Aid | 1 | |
| Dairy Queen | 1 | Ruby Tuesday | 1 | |
| Domino's Pizza | 2 | Rue21 | 1 | |
| Econo Lodge | 1 | Ryan's Grill | 1 | |
| Famous Footwear | 1 | SONIC Drive-In | 1 | |
| FedEx | 11 | Sears | 1 | |
| Ford | 1 | Staples | 1 | |
| GNC | 1 | Subway | 6 | |
| GameStop | 1 | Super 8 | 1 | |
| Goodwill | 4 | T-Mobile | 2 | |
| H&R Block | 2 | T.J.Maxx | 1 | |
| Hardee's | 1 | Taco Bell | 2 | |
| Hilton | 1 | Target | 1 | |
| Hobby Lobby | 1 | U-Haul | 7 | |
| Holiday Inn | 1 | UPS | 14 | |
| Home Depot | 1 | Verizon Wireless | 1 | |
| IHOP | 1 | Waffle House | 3 | |
| Jones New York | 1 | Walgreens | 1 | |
| KFC | 1 | Walmart | 1 | |
| Kmart | 1 | |||
Strongest AM radio stations in Carrollton:
- WKNG (1060 AM; daytime; 50 kW; TALLAPOOSA, GA; Owner: WKNG, INC.)
- WLBB (1330 AM; 0 kW; CARROLLTON, GA; Owner: WYAI, INC.)
- WGST (640 AM; 50 kW; ATLANTA, GA; Owner: CITICASTERS LICENSES, L.P.)
- WMLB (1160 AM; 50 kW; EAST POINT, GA; Owner: ATLANTA AREA BROADCASTING, INC.)
- WNSI (810 AM; 50 kW; JACKSONVILLE, AL; Owner: UNITED BROADCASTING NETWORK, INC.)
- WFTD (1080 AM; daytime; 50 kW; MARIETTA, GA; Owner: PRIETO ENTERPRISES, INC.)
- WAOK (1380 AM; 50 kW; ATLANTA, GA; Owner: INFINITY BROADCASTING OPERATIONS, INC.)
- WSB (750 AM; 50 kW; ATLANTA, GA; Owner: CXR HOLDINGS, INC.)
- WCNN (680 AM; 50 kW; NORTH ATLANTA, GA; Owner: DICKEY BROADCASTING COMPANY)
- WGUN (1010 AM; 50 kW; ATLANTA, GA; Owner: WGUN, INC.)
- WAZX (1550 AM; 50 kW; SMYRNA, GA; Owner: GA-MEX BROADCASTING, INC.)
- WQXI (790 AM; 28 kW; ATLANTA, GA; Owner: JEFFERSON-PILOT COMMUNICATIONS COMPANY OF GEORGIA)
- WGMI (1440 AM; 2 kW; BREMEN, GA; Owner: GARNER MINISTRIES, INC.)
Strongest FM radio stations in Carrollton:
- WBTR-FM (92.1 FM; CARROLLTON, GA; Owner: WYAI, INC.)
- WUWG (90.7 FM; CARROLLTON, GA; Owner: WEST GEORGIA COLLEGE)
- WALR-FM (104.1 FM; LA GRANGE, GA; Owner: CXR HOLDINGS, INC.)
- WMAX-FM (105.3 FM; BOWDON, GA; Owner: CLEAR CHANNEL BROADCASTING LICENSES, INC.)
- WTBJ (91.3 FM; OXFORD, AL; Owner: TRINITY CHRISTIAN ACADEMY)
- WCKS (102.7 FM; FRUITHURST, AL; Owner: WCKS, INC.)
- WJCK (88.3 FM; PIEDMONT, AL; Owner: IMMANUEL BROADCASTING NETWORK, INC.)
- WBZY-FM (96.7 FM; PEACHTREE CITY, GA; Owner: CITICASTERS LICENSES, L.P.)
- WWWQ (100.5 FM; ANNISTON, AL; Owner: WNNX LICO, INC.)
- WNNX (99.7 FM; ATLANTA, GA; Owner: WNNX LICO, INC.)
- WHTA (107.9 FM; HAMPTON, GA; Owner: RADIO ONE LICENSES, LLC)
- WLJS-FM (91.9 FM; JACKSONVILLE, AL; Owner: BD. OF TRUSTEES/JACKSONVILLE STATE UNIVERSITY)
- WRFG (89.3 FM; ATLANTA, GA; Owner: RADIO FREE GEORGIA BROADCASTING FOUNDATION INC)
- WPZE (97.5 FM; FAYETTEVILLE, GA; Owner: ROA LICENSES, LLC)
- WVOK-FM (97.9 FM; OXFORD, AL; Owner: WOODARD BROADCASTING CO. INC.)
- WKHX-FM (101.5 FM; MARIETTA, GA; Owner: ABC, INC.)
- WSB-FM (98.5 FM; ATLANTA, GA; Owner: CXR HOLDINGS, INC.)
- WSTR (94.1 FM; SMYRNA, GA; Owner: JEFFERSON-PILOT COMMUNICATIONS COMPANY OF GEORGIA)
- WVEE (103.3 FM; ATLANTA, GA; Owner: INFINITY BROADCASTING OPERATIONS, INC.)
- WZGC (92.9 FM; ATLANTA, GA; Owner: INFINITY BROADCASTING CORP. OF ATLANTA)
TV broadcast stations around Carrollton:
- W49AD (Channel 49; CARROLLTON, GA; Owner: GEORGIA PUBLIC TELECOMMUNICATIONS COMMISSION)
- W04DB (Channel 4; ATLANTA, GA; Owner: VVILPTV, INC.)
- WUVG (Channel 34; ATHENS, GA; Owner: UNIVISION ATLANTA LLC)
- WAGA (Channel 5; ATLANTA, GA; Owner: FOX TELEVISION STATIONS, INC.)
- WSB-TV (Channel 2; ATLANTA, GA; Owner: WSB-TV HOLDINGS, INC.)
- WXIA-TV (Channel 11; ATLANTA, GA; Owner: GANNETT GEORGIA, L.P.)
- WHSG (Channel 63; MONROE, GA; Owner: TRINITY BROADCASTING NETWORK)
- WATL (Channel 36; ATLANTA, GA; Owner: WATL, LLC)
- WTBS (Channel 17; ATLANTA, GA; Owner: SUPERSTATION, INC.)
- WGCL-TV (Channel 46; ATLANTA, GA; Owner: MEREDITH CORPORATION)
- WUPA (Channel 69; ATLANTA, GA; Owner: VIACOM STATIONS GROUP OF ATLANTA INC.)
- WANN-LP (Channel 32; ATLANTA, GA; Owner: PRISM BROADCASTING NETWORK, INC.)
- WDTA-LP (Channel 53; FAYETTEVILLE, GA; Owner: WORD OF GOD FELLOWSHIP, INC.)
- WPBA (Channel 30; ATLANTA, GA; Owner: BOARD OF EDUCATION OF THE CITY OF ATLANTA)
- National Bridge Inventory (NBI) Statistics
- 53Number of bridges
- 584ft / 178mTotal length
- $83,674,000Total costs
- 433,882Total average daily traffic
- 8,514Total average daily truck traffic
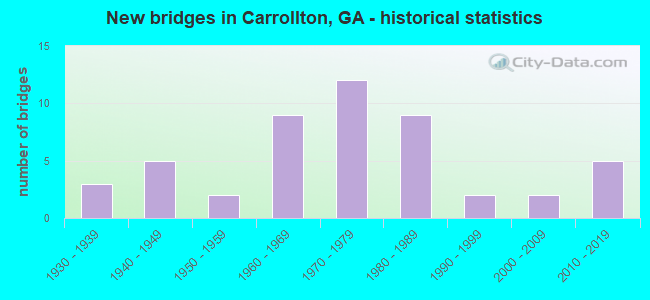
- New bridges - historical statistics
- 31930-1939
- 51940-1949
- 21950-1959
- 91960-1969
- 121970-1979
- 91980-1989
- 21990-1999
- 22000-2009
- 52010-2019
FCC Registered Antenna Towers: 204 (See the full list of FCC Registered Antenna Towers)
FCC Registered Commercial Land Mobile Towers: 1 (See the full list of FCC Registered Commercial Land Mobile Towers in Carrollton, GA)
FCC Registered Private Land Mobile Towers: 13 (See the full list of FCC Registered Private Land Mobile Towers)
FCC Registered Broadcast Land Mobile Towers: 45 (See the full list of FCC Registered Broadcast Land Mobile Towers)
FCC Registered Microwave Towers: 34 (See the full list of FCC Registered Microwave Towers in this town)
FCC Registered Paging Towers: 5 (See the full list of FCC Registered Paging Towers)
FCC Registered Maritime Coast & Aviation Ground Towers: 10 (See the full list of FCC Registered Maritime Coast & Aviation Ground Towers)
FCC Registered Amateur Radio Licenses: 228 (See the full list of FCC Registered Amateur Radio Licenses in Carrollton)
FAA Registered Aircraft Manufacturers and Dealers: 2 (See the full list of FAA Registered Manufacturers and Dealers in Carrollton)
FAA Registered Aircraft: 71 (See the full list of FAA Registered Aircraft)
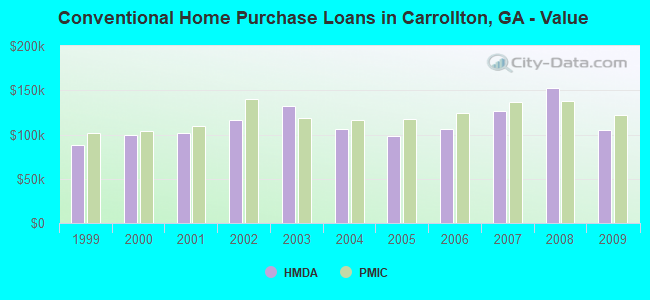
| Home Mortgage Disclosure Act Aggregated Statistics For Year 2009 (Based on 1 full and 7 partial tracts) | ||||||||||||||
| A) FHA, FSA/RHS & VA Home Purchase Loans | B) Conventional Home Purchase Loans | C) Refinancings | D) Home Improvement Loans | E) Loans on Dwellings For 5+ Families | F) Non-occupant Loans on < 5 Family Dwellings (A B C & D) | G) Loans On Manufactured Home Dwelling (A B C & D) | ||||||||
|---|---|---|---|---|---|---|---|---|---|---|---|---|---|---|
| Number | Average Value | Number | Average Value | Number | Average Value | Number | Average Value | Number | Average Value | Number | Average Value | Number | Average Value | |
| LOANS ORIGINATED | 29 | $106,050 | 26 | $104,635 | 146 | $145,261 | 4 | $37,345 | 3 | $4,217,473 | 50 | $102,330 | 5 | $72,240 |
| APPLICATIONS APPROVED, NOT ACCEPTED | 3 | $119,677 | 1 | $109,080 | 14 | $153,176 | 1 | $12,540 | 1 | $4,563,410 | 1 | $224,380 | 0 | $0 |
| APPLICATIONS DENIED | 7 | $128,214 | 7 | $103,574 | 53 | $141,609 | 18 | $15,824 | 0 | $0 | 11 | $56,977 | 3 | $55,027 |
| APPLICATIONS WITHDRAWN | 7 | $102,447 | 4 | $99,600 | 37 | $154,434 | 2 | $62,005 | 0 | $0 | 6 | $94,852 | 0 | $0 |
| FILES CLOSED FOR INCOMPLETENESS | 1 | $95,740 | 1 | $161,000 | 8 | $202,420 | 1 | $29,950 | 0 | $0 | 1 | $82,340 | 0 | $0 |
Detailed HMDA statistics for the following Tracts: 9905.01 , 9905.02, 9906.00, 9907.01, 9907.03, 9910.00, 9911.00
| Private Mortgage Insurance Companies Aggregated Statistics For Year 2009 (Based on 7 partial tracts) | ||||||
| A) Conventional Home Purchase Loans | B) Refinancings | C) Non-occupant Loans on < 5 Family Dwellings (A & B) | ||||
|---|---|---|---|---|---|---|
| Number | Average Value | Number | Average Value | Number | Average Value | |
| LOANS ORIGINATED | 3 | $121,967 | 3 | $195,130 | 0 | $0 |
| APPLICATIONS APPROVED, NOT ACCEPTED | 2 | $214,620 | 1 | $160,260 | 0 | $0 |
| APPLICATIONS DENIED | 0 | $0 | 1 | $214,440 | 0 | $0 |
| APPLICATIONS WITHDRAWN | 0 | $0 | 0 | $0 | 0 | $0 |
| FILES CLOSED FOR INCOMPLETENESS | 1 | $176,290 | 0 | $0 | 1 | $118,040 |
Detailed PMIC statistics for the following Tracts: 9905.01 , 9905.02, 9906.00, 9907.01, 9907.03, 9910.00, 9911.00
2003 - 2018 National Fire Incident Reporting System (NFIRS) incidents
- Fire incident types reported to NFIRS in Carrollton, GA
- 2,77846.3%Outside Fires
- 2,24337.4%Structure Fires
- 93915.7%Mobile Property/Vehicle Fires
- 390.7%Other
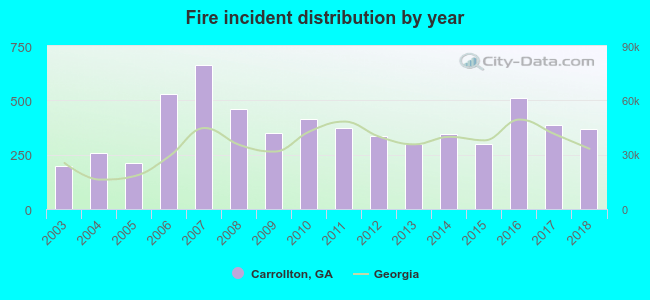 According to the data from the years 2003 - 2018 the average number of fires per year is 375. The highest number of reported fire incidents - 663 took place in 2007, and the least - 199 in 2003. The data has a growing trend.
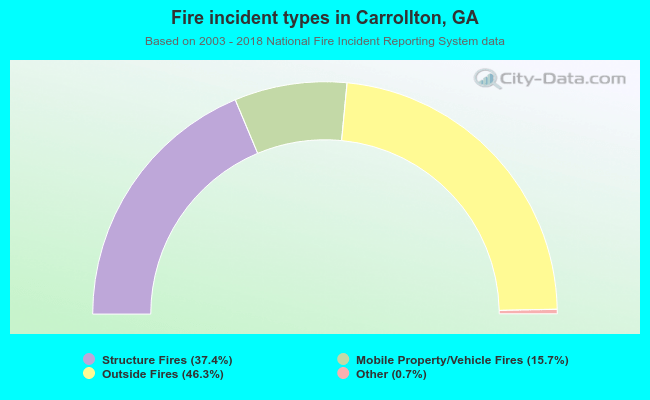 When looking into fire subcategories, the most reports belonged to: Outside Fires (46.3%), and Structure Fires (37.4%).
Fire-safe hotels and motels in Carrollton, Georgia:
- Quality Inn Carrollton, 700 S Park St, Carrollton, Georgia 30117 , Phone: (770) 834-2600, Fax: (770) 836-0713
- Best Western Plus Carrollton Hotel, 104 S Cottage Hill Rd, Carrollton, Georgia 30117 , Phone: (770) 838-0508
- Super 8 by Wyndham Carrollton Georgia, 901 S Park St, Carrollton, Georgia 30117 , Phone: (770) 834-2001, Fax: (770) 834-0999
- Hampton Inn Carrollton Ga, 102 S Cottage Hill Rd, Carrollton, Georgia 30117 , Phone: (770) 838-7722, Fax: (770) 838-7419
- The Carroll Inn, Inc., 1485 Nhighway 27, Carrollton, Georgia 30117 , Phone: (770) 832-9081, Fax: (770) 836-6037
- Americas Best Value Inn, 1111 Bankhead Hwy, Carrollton, Georgia 30116 , Phone: (770) 830-1000, Fax: (770) 830-1110
- Courtyard Carrollton by Marriott, 180 Barnes Ave, Carrollton, Georgia 30117 , Phone: (678) 664-5200
- Holiday Inn Express & Suites Carrollton, 1545 US Hwy 27, Carrollton, Georgia 30117 , Phone: (800) 465-4329
| Most common first names in Carrollton, GA among deceased individuals | ||
| Name | Count | Lived (average) |
|---|---|---|
| James | 326 | 72.0 years |
| Mary | 267 | 78.9 years |
| William | 258 | 73.6 years |
| John | 210 | 73.5 years |
| Robert | 150 | 70.5 years |
| Willie | 138 | 71.7 years |
| Thomas | 99 | 71.7 years |
| Annie | 97 | 80.7 years |
| Henry | 86 | 77.1 years |
| Charles | 82 | 70.8 years |
| Most common last names in Carrollton, GA among deceased individuals | ||
| Last name | Count | Lived (average) |
|---|---|---|
| Smith | 194 | 75.7 years |
| Johnson | 105 | 74.8 years |
| Brown | 92 | 74.0 years |
| Williams | 91 | 73.7 years |
| Phillips | 86 | 72.3 years |
| Jones | 84 | 73.3 years |
| Walker | 79 | 75.0 years |
| Robinson | 75 | 74.3 years |
| Jackson | 65 | 79.2 years |
| Cook | 64 | 75.9 years |
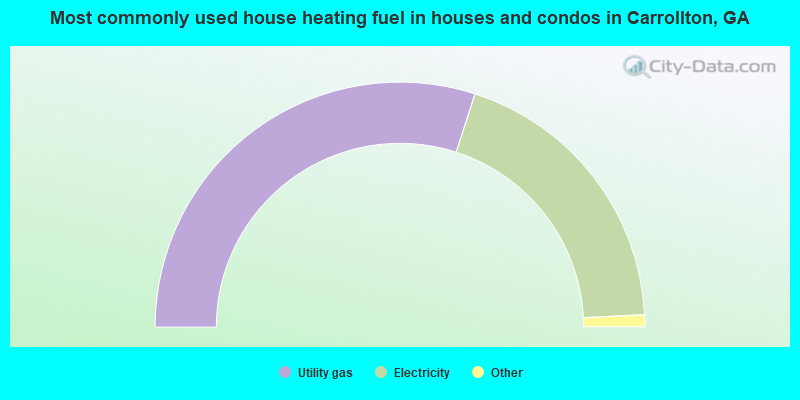
- 60.0%Utility gas
- 38.5%Electricity
- 1.1%Fuel oil, kerosene, etc.
- 0.4%Bottled, tank, or LP gas
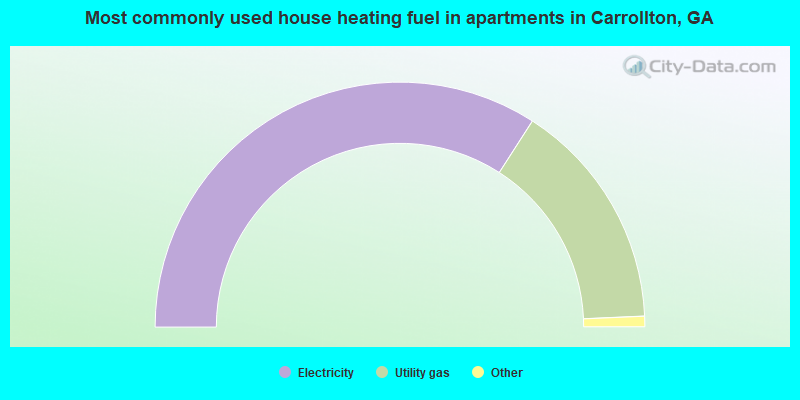
- 68.2%Electricity
- 30.4%Utility gas
- 1.2%Bottled, tank, or LP gas
- 0.2%No fuel used
Carrollton compared to Georgia state average:
- Unemployed percentage below state average.
- Median age significantly below state average.
- Renting percentage above state average.
- Length of stay since moving in below state average.
- Institutionalized population percentage above state average.
- Number of college students significantly above state average.
Carrollton on our top lists:
- #4 on the list of "Top 101 cities with the most full-time park and recreation workers per 1000 residents (population 5,000+)"
- #53 on the list of "Top 101 cities with the most residents born in Honduras (population 500+)"
- #81 on the list of "Top 101 cities with the largest household incomes disparities (population 5,000+)"
- #63 on the list of "Top 101 counties with the smallest number of people without health insurance coverage in 2000 (pop. 50,000+)"

|
|
Total of 178 patent applications in 2008-2024.