Fairfield, Ohio Submit your own pictures of this city and show them to the world
OSM Map
General Map
Google Map
MSN Map
OSM Map
General Map
Google Map
MSN Map
OSM Map
General Map
Google Map
MSN Map
OSM Map
General Map
Google Map
MSN Map
Please wait while loading the map...
Population in 2022: 44,456 (100% urban, 0% rural). Population change since 2000: +5.6%Males: 21,274 Females: 23,182
March 2022 cost of living index in Fairfield: 88.5 (less than average, U.S. average is 100) Percentage of residents living in poverty in 2022: 7.2%for White Non-Hispanic residents , 11.0% for Black residents , 13.1% for Hispanic or Latino residents , 3.6% for other race residents , 11.0% for two or more races residents )
Profiles of local businesses
Business Search - 14 Million verified businesses
Data:
Median household income ($)
Median household income (% change since 2000)
Household income diversity
Ratio of average income to average house value (%)
Ratio of average income to average rent
Median household income ($) - White
Median household income ($) - Black or African American
Median household income ($) - Asian
Median household income ($) - Hispanic or Latino
Median household income ($) - American Indian and Alaska Native
Median household income ($) - Multirace
Median household income ($) - Other Race
Median household income for houses/condos with a mortgage ($)
Median household income for apartments without a mortgage ($)
Races - White alone (%)
Races - White alone (% change since 2000)
Races - Black alone (%)
Races - Black alone (% change since 2000)
Races - American Indian alone (%)
Races - American Indian alone (% change since 2000)
Races - Asian alone (%)
Races - Asian alone (% change since 2000)
Races - Hispanic (%)
Races - Hispanic (% change since 2000)
Races - Native Hawaiian and Other Pacific Islander alone (%)
Races - Native Hawaiian and Other Pacific Islander alone (% change since 2000)
Races - Two or more races (%)
Races - Two or more races (% change since 2000)
Races - Other race alone (%)
Races - Other race alone (% change since 2000)
Racial diversity
Unemployment (%)
Unemployment (% change since 2000)
Unemployment (%) - White
Unemployment (%) - Black or African American
Unemployment (%) - Asian
Unemployment (%) - Hispanic or Latino
Unemployment (%) - American Indian and Alaska Native
Unemployment (%) - Multirace
Unemployment (%) - Other Race
Population density (people per square mile)
Population - Males (%)
Population - Females (%)
Population - Males (%) - White
Population - Males (%) - Black or African American
Population - Males (%) - Asian
Population - Males (%) - Hispanic or Latino
Population - Males (%) - American Indian and Alaska Native
Population - Males (%) - Multirace
Population - Males (%) - Other Race
Population - Females (%) - White
Population - Females (%) - Black or African American
Population - Females (%) - Asian
Population - Females (%) - Hispanic or Latino
Population - Females (%) - American Indian and Alaska Native
Population - Females (%) - Multirace
Population - Females (%) - Other Race
Coronavirus confirmed cases (Apr 27, 2024)
Deaths caused by coronavirus (Apr 27, 2024)
Coronavirus confirmed cases (per 100k population) (Apr 27, 2024)
Deaths caused by coronavirus (per 100k population) (Apr 27, 2024)
Daily increase in number of cases (Apr 27, 2024)
Weekly increase in number of cases (Apr 27, 2024)
Cases doubled (in days) (Apr 27, 2024)
Hospitalized patients (Apr 18, 2022)
Negative test results (Apr 18, 2022)
Total test results (Apr 18, 2022)
COVID Vaccine doses distributed (per 100k population) (Sep 19, 2023)
COVID Vaccine doses administered (per 100k population) (Sep 19, 2023)
COVID Vaccine doses distributed (Sep 19, 2023)
COVID Vaccine doses administered (Sep 19, 2023)
Likely homosexual households (%)
Likely homosexual households (% change since 2000)
Likely homosexual households - Lesbian couples (%)
Likely homosexual households - Lesbian couples (% change since 2000)
Likely homosexual households - Gay men (%)
Likely homosexual households - Gay men (% change since 2000)
Cost of living index
Median gross rent ($)
Median contract rent ($)
Median monthly housing costs ($)
Median house or condo value ($)
Median house or condo value ($ change since 2000)
Mean house or condo value by units in structure - 1, detached ($)
Mean house or condo value by units in structure - 1, attached ($)
Mean house or condo value by units in structure - 2 ($)
Mean house or condo value by units in structure by units in structure - 3 or 4 ($)
Mean house or condo value by units in structure - 5 or more ($)
Mean house or condo value by units in structure - Boat, RV, van, etc. ($)
Mean house or condo value by units in structure - Mobile home ($)
Median house or condo value ($) - White
Median house or condo value ($) - Black or African American
Median house or condo value ($) - Asian
Median house or condo value ($) - Hispanic or Latino
Median house or condo value ($) - American Indian and Alaska Native
Median house or condo value ($) - Multirace
Median house or condo value ($) - Other Race
Median resident age
Resident age diversity
Median resident age - Males
Median resident age - Females
Median resident age - White
Median resident age - Black or African American
Median resident age - Asian
Median resident age - Hispanic or Latino
Median resident age - American Indian and Alaska Native
Median resident age - Multirace
Median resident age - Other Race
Median resident age - Males - White
Median resident age - Males - Black or African American
Median resident age - Males - Asian
Median resident age - Males - Hispanic or Latino
Median resident age - Males - American Indian and Alaska Native
Median resident age - Males - Multirace
Median resident age - Males - Other Race
Median resident age - Females - White
Median resident age - Females - Black or African American
Median resident age - Females - Asian
Median resident age - Females - Hispanic or Latino
Median resident age - Females - American Indian and Alaska Native
Median resident age - Females - Multirace
Median resident age - Females - Other Race
Commute - mean travel time to work (minutes)
Travel time to work - Less than 5 minutes (%)
Travel time to work - Less than 5 minutes (% change since 2000)
Travel time to work - 5 to 9 minutes (%)
Travel time to work - 5 to 9 minutes (% change since 2000)
Travel time to work - 10 to 19 minutes (%)
Travel time to work - 10 to 19 minutes (% change since 2000)
Travel time to work - 20 to 29 minutes (%)
Travel time to work - 20 to 29 minutes (% change since 2000)
Travel time to work - 30 to 39 minutes (%)
Travel time to work - 30 to 39 minutes (% change since 2000)
Travel time to work - 40 to 59 minutes (%)
Travel time to work - 40 to 59 minutes (% change since 2000)
Travel time to work - 60 to 89 minutes (%)
Travel time to work - 60 to 89 minutes (% change since 2000)
Travel time to work - 90 or more minutes (%)
Travel time to work - 90 or more minutes (% change since 2000)
Marital status - Never married (%)
Marital status - Now married (%)
Marital status - Separated (%)
Marital status - Widowed (%)
Marital status - Divorced (%)
Median family income ($)
Median family income (% change since 2000)
Median non-family income ($)
Median non-family income (% change since 2000)
Median per capita income ($)
Median per capita income (% change since 2000)
Median family income ($) - White
Median family income ($) - Black or African American
Median family income ($) - Asian
Median family income ($) - Hispanic or Latino
Median family income ($) - American Indian and Alaska Native
Median family income ($) - Multirace
Median family income ($) - Other Race
Median year house/condo built
Median year apartment built
Year house built - Built 2005 or later (%)
Year house built - Built 2000 to 2004 (%)
Year house built - Built 1990 to 1999 (%)
Year house built - Built 1980 to 1989 (%)
Year house built - Built 1970 to 1979 (%)
Year house built - Built 1960 to 1969 (%)
Year house built - Built 1950 to 1959 (%)
Year house built - Built 1940 to 1949 (%)
Year house built - Built 1939 or earlier (%)
Average household size
Household density (households per square mile)
Average household size - White
Average household size - Black or African American
Average household size - Asian
Average household size - Hispanic or Latino
Average household size - American Indian and Alaska Native
Average household size - Multirace
Average household size - Other Race
Occupied housing units (%)
Vacant housing units (%)
Owner occupied housing units (%)
Renter occupied housing units (%)
Vacancy status - For rent (%)
Vacancy status - For sale only (%)
Vacancy status - Rented or sold, not occupied (%)
Vacancy status - For seasonal, recreational, or occasional use (%)
Vacancy status - For migrant workers (%)
Vacancy status - Other vacant (%)
Residents with income below the poverty level (%)
Residents with income below 50% of the poverty level (%)
Children below poverty level (%)
Poor families by family type - Married-couple family (%)
Poor families by family type - Male, no wife present (%)
Poor families by family type - Female, no husband present (%)
Poverty status for native-born residents (%)
Poverty status for foreign-born residents (%)
Poverty among high school graduates not in families (%)
Poverty among people who did not graduate high school not in families (%)
Residents with income below the poverty level (%) - White
Residents with income below the poverty level (%) - Black or African American
Residents with income below the poverty level (%) - Asian
Residents with income below the poverty level (%) - Hispanic or Latino
Residents with income below the poverty level (%) - American Indian and Alaska Native
Residents with income below the poverty level (%) - Multirace
Residents with income below the poverty level (%) - Other Race
Air pollution - Air Quality Index (AQI)
Air pollution - CO
Air pollution - NO2
Air pollution - SO2
Air pollution - Ozone
Air pollution - PM10
Air pollution - PM25
Air pollution - Pb
Crime - Murders per 100,000 population
Crime - Rapes per 100,000 population
Crime - Robberies per 100,000 population
Crime - Assaults per 100,000 population
Crime - Burglaries per 100,000 population
Crime - Thefts per 100,000 population
Crime - Auto thefts per 100,000 population
Crime - Arson per 100,000 population
Crime - City-data.com crime index
Crime - Violent crime index
Crime - Property crime index
Crime - Murders per 100,000 population (5 year average)
Crime - Rapes per 100,000 population (5 year average)
Crime - Robberies per 100,000 population (5 year average)
Crime - Assaults per 100,000 population (5 year average)
Crime - Burglaries per 100,000 population (5 year average)
Crime - Thefts per 100,000 population (5 year average)
Crime - Auto thefts per 100,000 population (5 year average)
Crime - Arson per 100,000 population (5 year average)
Crime - City-data.com crime index (5 year average)
Crime - Violent crime index (5 year average)
Crime - Property crime index (5 year average)
1996 Presidential Elections Results (%) - Democratic Party (Clinton)
1996 Presidential Elections Results (%) - Republican Party (Dole)
1996 Presidential Elections Results (%) - Other
2000 Presidential Elections Results (%) - Democratic Party (Gore)
2000 Presidential Elections Results (%) - Republican Party (Bush)
2000 Presidential Elections Results (%) - Other
2004 Presidential Elections Results (%) - Democratic Party (Kerry)
2004 Presidential Elections Results (%) - Republican Party (Bush)
2004 Presidential Elections Results (%) - Other
2008 Presidential Elections Results (%) - Democratic Party (Obama)
2008 Presidential Elections Results (%) - Republican Party (McCain)
2008 Presidential Elections Results (%) - Other
2012 Presidential Elections Results (%) - Democratic Party (Obama)
2012 Presidential Elections Results (%) - Republican Party (Romney)
2012 Presidential Elections Results (%) - Other
2016 Presidential Elections Results (%) - Democratic Party (Clinton)
2016 Presidential Elections Results (%) - Republican Party (Trump)
2016 Presidential Elections Results (%) - Other
2020 Presidential Elections Results (%) - Democratic Party (Biden)
2020 Presidential Elections Results (%) - Republican Party (Trump)
2020 Presidential Elections Results (%) - Other
Ancestries Reported - Arab (%)
Ancestries Reported - Czech (%)
Ancestries Reported - Danish (%)
Ancestries Reported - Dutch (%)
Ancestries Reported - English (%)
Ancestries Reported - French (%)
Ancestries Reported - French Canadian (%)
Ancestries Reported - German (%)
Ancestries Reported - Greek (%)
Ancestries Reported - Hungarian (%)
Ancestries Reported - Irish (%)
Ancestries Reported - Italian (%)
Ancestries Reported - Lithuanian (%)
Ancestries Reported - Norwegian (%)
Ancestries Reported - Polish (%)
Ancestries Reported - Portuguese (%)
Ancestries Reported - Russian (%)
Ancestries Reported - Scotch-Irish (%)
Ancestries Reported - Scottish (%)
Ancestries Reported - Slovak (%)
Ancestries Reported - Subsaharan African (%)
Ancestries Reported - Swedish (%)
Ancestries Reported - Swiss (%)
Ancestries Reported - Ukrainian (%)
Ancestries Reported - United States (%)
Ancestries Reported - Welsh (%)
Ancestries Reported - West Indian (%)
Ancestries Reported - Other (%)
Educational Attainment - No schooling completed (%)
Educational Attainment - Less than high school (%)
Educational Attainment - High school or equivalent (%)
Educational Attainment - Less than 1 year of college (%)
Educational Attainment - 1 or more years of college (%)
Educational Attainment - Associate degree (%)
Educational Attainment - Bachelor's degree (%)
Educational Attainment - Master's degree (%)
Educational Attainment - Professional school degree (%)
Educational Attainment - Doctorate degree (%)
School Enrollment - Nursery, preschool (%)
School Enrollment - Kindergarten (%)
School Enrollment - Grade 1 to 4 (%)
School Enrollment - Grade 5 to 8 (%)
School Enrollment - Grade 9 to 12 (%)
School Enrollment - College undergrad (%)
School Enrollment - Graduate or professional (%)
School Enrollment - Not enrolled in school (%)
School enrollment - Public schools (%)
School enrollment - Private schools (%)
School enrollment - Not enrolled (%)
Median number of rooms in houses and condos
Median number of rooms in apartments
Housing units lacking complete plumbing facilities (%)
Housing units lacking complete kitchen facilities (%)
Density of houses
Urban houses (%)
Rural houses (%)
Households with people 60 years and over (%)
Households with people 65 years and over (%)
Households with people 75 years and over (%)
Households with one or more nonrelatives (%)
Households with no nonrelatives (%)
Population in households (%)
Family households (%)
Nonfamily households (%)
Population in families (%)
Family households with own children (%)
Median number of bedrooms in owner occupied houses
Mean number of bedrooms in owner occupied houses
Median number of bedrooms in renter occupied houses
Mean number of bedrooms in renter occupied houses
Median number of vehichles in owner occupied houses
Mean number of vehichles in owner occupied houses
Median number of vehichles in renter occupied houses
Mean number of vehichles in renter occupied houses
Mortgage status - with mortgage (%)
Mortgage status - with second mortgage (%)
Mortgage status - with home equity loan (%)
Mortgage status - with both second mortgage and home equity loan (%)
Mortgage status - without a mortgage (%)
Average family size
Average family size - White
Average family size - Black or African American
Average family size - Asian
Average family size - Hispanic or Latino
Average family size - American Indian and Alaska Native
Average family size - Multirace
Average family size - Other Race
Geographical mobility - Same house 1 year ago (%)
Geographical mobility - Moved within same county (%)
Geographical mobility - Moved from different county within same state (%)
Geographical mobility - Moved from different state (%)
Geographical mobility - Moved from abroad (%)
Place of birth - Born in state of residence (%)
Place of birth - Born in other state (%)
Place of birth - Native, outside of US (%)
Place of birth - Foreign born (%)
Housing units in structures - 1, detached (%)
Housing units in structures - 1, attached (%)
Housing units in structures - 2 (%)
Housing units in structures - 3 or 4 (%)
Housing units in structures - 5 to 9 (%)
Housing units in structures - 10 to 19 (%)
Housing units in structures - 20 to 49 (%)
Housing units in structures - 50 or more (%)
Housing units in structures - Mobile home (%)
Housing units in structures - Boat, RV, van, etc. (%)
House/condo owner moved in on average (years ago)
Renter moved in on average (years ago)
Year householder moved into unit - Moved in 1999 to March 2000 (%)
Year householder moved into unit - Moved in 1995 to 1998 (%)
Year householder moved into unit - Moved in 1990 to 1994 (%)
Year householder moved into unit - Moved in 1980 to 1989 (%)
Year householder moved into unit - Moved in 1970 to 1979 (%)
Year householder moved into unit - Moved in 1969 or earlier (%)
Means of transportation to work - Drove car alone (%)
Means of transportation to work - Carpooled (%)
Means of transportation to work - Public transportation (%)
Means of transportation to work - Bus or trolley bus (%)
Means of transportation to work - Streetcar or trolley car (%)
Means of transportation to work - Subway or elevated (%)
Means of transportation to work - Railroad (%)
Means of transportation to work - Ferryboat (%)
Means of transportation to work - Taxicab (%)
Means of transportation to work - Motorcycle (%)
Means of transportation to work - Bicycle (%)
Means of transportation to work - Walked (%)
Means of transportation to work - Other means (%)
Working at home (%)
Industry diversity
Most Common Industries - Agriculture, forestry, fishing and hunting, and mining (%)
Most Common Industries - Agriculture, forestry, fishing and hunting (%)
Most Common Industries - Mining, quarrying, and oil and gas extraction (%)
Most Common Industries - Construction (%)
Most Common Industries - Manufacturing (%)
Most Common Industries - Wholesale trade (%)
Most Common Industries - Retail trade (%)
Most Common Industries - Transportation and warehousing, and utilities (%)
Most Common Industries - Transportation and warehousing (%)
Most Common Industries - Utilities (%)
Most Common Industries - Information (%)
Most Common Industries - Finance and insurance, and real estate and rental and leasing (%)
Most Common Industries - Finance and insurance (%)
Most Common Industries - Real estate and rental and leasing (%)
Most Common Industries - Professional, scientific, and management, and administrative and waste management services (%)
Most Common Industries - Professional, scientific, and technical services (%)
Most Common Industries - Management of companies and enterprises (%)
Most Common Industries - Administrative and support and waste management services (%)
Most Common Industries - Educational services, and health care and social assistance (%)
Most Common Industries - Educational services (%)
Most Common Industries - Health care and social assistance (%)
Most Common Industries - Arts, entertainment, and recreation, and accommodation and food services (%)
Most Common Industries - Arts, entertainment, and recreation (%)
Most Common Industries - Accommodation and food services (%)
Most Common Industries - Other services, except public administration (%)
Most Common Industries - Public administration (%)
Occupation diversity
Most Common Occupations - Management, business, science, and arts occupations (%)
Most Common Occupations - Management, business, and financial occupations (%)
Most Common Occupations - Management occupations (%)
Most Common Occupations - Business and financial operations occupations (%)
Most Common Occupations - Computer, engineering, and science occupations (%)
Most Common Occupations - Computer and mathematical occupations (%)
Most Common Occupations - Architecture and engineering occupations (%)
Most Common Occupations - Life, physical, and social science occupations (%)
Most Common Occupations - Education, legal, community service, arts, and media occupations (%)
Most Common Occupations - Community and social service occupations (%)
Most Common Occupations - Legal occupations (%)
Most Common Occupations - Education, training, and library occupations (%)
Most Common Occupations - Arts, design, entertainment, sports, and media occupations (%)
Most Common Occupations - Healthcare practitioners and technical occupations (%)
Most Common Occupations - Health diagnosing and treating practitioners and other technical occupations (%)
Most Common Occupations - Health technologists and technicians (%)
Most Common Occupations - Service occupations (%)
Most Common Occupations - Healthcare support occupations (%)
Most Common Occupations - Protective service occupations (%)
Most Common Occupations - Fire fighting and prevention, and other protective service workers including supervisors (%)
Most Common Occupations - Law enforcement workers including supervisors (%)
Most Common Occupations - Food preparation and serving related occupations (%)
Most Common Occupations - Building and grounds cleaning and maintenance occupations (%)
Most Common Occupations - Personal care and service occupations (%)
Most Common Occupations - Sales and office occupations (%)
Most Common Occupations - Sales and related occupations (%)
Most Common Occupations - Office and administrative support occupations (%)
Most Common Occupations - Natural resources, construction, and maintenance occupations (%)
Most Common Occupations - Farming, fishing, and forestry occupations (%)
Most Common Occupations - Construction and extraction occupations (%)
Most Common Occupations - Installation, maintenance, and repair occupations (%)
Most Common Occupations - Production, transportation, and material moving occupations (%)
Most Common Occupations - Production occupations (%)
Most Common Occupations - Transportation occupations (%)
Most Common Occupations - Material moving occupations (%)
People in Group quarters - Institutionalized population (%)
People in Group quarters - Correctional institutions (%)
People in Group quarters - Federal prisons and detention centers (%)
People in Group quarters - Halfway houses (%)
People in Group quarters - Local jails and other confinement facilities (including police lockups) (%)
People in Group quarters - Military disciplinary barracks (%)
People in Group quarters - State prisons (%)
People in Group quarters - Other types of correctional institutions (%)
People in Group quarters - Nursing homes (%)
People in Group quarters - Hospitals/wards, hospices, and schools for the handicapped (%)
People in Group quarters - Hospitals/wards and hospices for chronically ill (%)
People in Group quarters - Hospices or homes for chronically ill (%)
People in Group quarters - Military hospitals or wards for chronically ill (%)
People in Group quarters - Other hospitals or wards for chronically ill (%)
People in Group quarters - Hospitals or wards for drug/alcohol abuse (%)
People in Group quarters - Mental (Psychiatric) hospitals or wards (%)
People in Group quarters - Schools, hospitals, or wards for the mentally retarded (%)
People in Group quarters - Schools, hospitals, or wards for the physically handicapped (%)
People in Group quarters - Institutions for the deaf (%)
People in Group quarters - Institutions for the blind (%)
People in Group quarters - Orthopedic wards and institutions for the physically handicapped (%)
People in Group quarters - Wards in general hospitals for patients who have no usual home elsewhere (%)
People in Group quarters - Wards in military hospitals for patients who have no usual home elsewhere (%)
People in Group quarters - Juvenile institutions (%)
People in Group quarters - Long-term care (%)
People in Group quarters - Homes for abused, dependent, and neglected children (%)
People in Group quarters - Residential treatment centers for emotionally disturbed children (%)
People in Group quarters - Training schools for juvenile delinquents (%)
People in Group quarters - Short-term care, detention or diagnostic centers for delinquent children (%)
People in Group quarters - Type of juvenile institution unknown (%)
People in Group quarters - Noninstitutionalized population (%)
People in Group quarters - College dormitories (includes college quarters off campus) (%)
People in Group quarters - Military quarters (%)
People in Group quarters - On base (%)
People in Group quarters - Barracks, unaccompanied personnel housing (UPH), (Enlisted/Officer), ;and similar group living quarters for military personnel (%)
People in Group quarters - Transient quarters for temporary residents (%)
People in Group quarters - Military ships (%)
People in Group quarters - Group homes (%)
People in Group quarters - Homes or halfway houses for drug/alcohol abuse (%)
People in Group quarters - Homes for the mentally ill (%)
People in Group quarters - Homes for the mentally retarded (%)
People in Group quarters - Homes for the physically handicapped (%)
People in Group quarters - Other group homes (%)
People in Group quarters - Religious group quarters (%)
People in Group quarters - Dormitories (%)
People in Group quarters - Agriculture workers' dormitories on farms (%)
People in Group quarters - Job Corps and vocational training facilities (%)
People in Group quarters - Other workers' dormitories (%)
People in Group quarters - Crews of maritime vessels (%)
People in Group quarters - Other nonhousehold living situations (%)
People in Group quarters - Other noninstitutional group quarters (%)
Residents speaking English at home (%)
Residents speaking English at home - Born in the United States (%)
Residents speaking English at home - Native, born elsewhere (%)
Residents speaking English at home - Foreign born (%)
Residents speaking Spanish at home (%)
Residents speaking Spanish at home - Born in the United States (%)
Residents speaking Spanish at home - Native, born elsewhere (%)
Residents speaking Spanish at home - Foreign born (%)
Residents speaking other language at home (%)
Residents speaking other language at home - Born in the United States (%)
Residents speaking other language at home - Native, born elsewhere (%)
Residents speaking other language at home - Foreign born (%)
Class of Workers - Employee of private company (%)
Class of Workers - Self-employed in own incorporated business (%)
Class of Workers - Private not-for-profit wage and salary workers (%)
Class of Workers - Local government workers (%)
Class of Workers - State government workers (%)
Class of Workers - Federal government workers (%)
Class of Workers - Self-employed workers in own not incorporated business and Unpaid family workers (%)
House heating fuel used in houses and condos - Utility gas (%)
House heating fuel used in houses and condos - Bottled, tank, or LP gas (%)
House heating fuel used in houses and condos - Electricity (%)
House heating fuel used in houses and condos - Fuel oil, kerosene, etc. (%)
House heating fuel used in houses and condos - Coal or coke (%)
House heating fuel used in houses and condos - Wood (%)
House heating fuel used in houses and condos - Solar energy (%)
House heating fuel used in houses and condos - Other fuel (%)
House heating fuel used in houses and condos - No fuel used (%)
House heating fuel used in apartments - Utility gas (%)
House heating fuel used in apartments - Bottled, tank, or LP gas (%)
House heating fuel used in apartments - Electricity (%)
House heating fuel used in apartments - Fuel oil, kerosene, etc. (%)
House heating fuel used in apartments - Coal or coke (%)
House heating fuel used in apartments - Wood (%)
House heating fuel used in apartments - Solar energy (%)
House heating fuel used in apartments - Other fuel (%)
House heating fuel used in apartments - No fuel used (%)
Armed forces status - In Armed Forces (%)
Armed forces status - Civilian (%)
Armed forces status - Civilian - Veteran (%)
Armed forces status - Civilian - Nonveteran (%)
Fatal accidents locations in years 2005-2021
Fatal accidents locations in 2005
Fatal accidents locations in 2006
Fatal accidents locations in 2007
Fatal accidents locations in 2008
Fatal accidents locations in 2009
Fatal accidents locations in 2010
Fatal accidents locations in 2011
Fatal accidents locations in 2012
Fatal accidents locations in 2013
Fatal accidents locations in 2014
Fatal accidents locations in 2015
Fatal accidents locations in 2016
Fatal accidents locations in 2017
Fatal accidents locations in 2018
Fatal accidents locations in 2019
Fatal accidents locations in 2020
Fatal accidents locations in 2021
Alcohol use - People drinking some alcohol every month (%)
Alcohol use - People not drinking at all (%)
Alcohol use - Average days/month drinking alcohol
Alcohol use - Average drinks/week
Alcohol use - Average days/year people drink much
Audiometry - Average condition of hearing (%)
Audiometry - People that can hear a whisper from across a quiet room (%)
Audiometry - People that can hear normal voice from across a quiet room (%)
Audiometry - Ears ringing, roaring, buzzing (%)
Audiometry - Had a job exposure to loud noise (%)
Audiometry - Had off-work exposure to loud noise (%)
Blood Pressure & Cholesterol - Has high blood pressure (%)
Blood Pressure & Cholesterol - Checking blood pressure at home (%)
Blood Pressure & Cholesterol - Frequently checking blood cholesterol (%)
Blood Pressure & Cholesterol - Has high cholesterol level (%)
Consumer Behavior - Money monthly spent on food at supermarket/grocery store
Consumer Behavior - Money monthly spent on food at other stores
Consumer Behavior - Money monthly spent on eating out
Consumer Behavior - Money monthly spent on carryout/delivered foods
Consumer Behavior - Income spent on food at supermarket/grocery store (%)
Consumer Behavior - Income spent on food at other stores (%)
Consumer Behavior - Income spent on eating out (%)
Consumer Behavior - Income spent on carryout/delivered foods (%)
Current Health Status - General health condition (%)
Current Health Status - Blood donors (%)
Current Health Status - Has blood ever tested for HIV virus (%)
Current Health Status - Left-handed people (%)
Dermatology - People using sunscreen (%)
Diabetes - Diabetics (%)
Diabetes - Had a blood test for high blood sugar (%)
Diabetes - People taking insulin (%)
Diet Behavior & Nutrition - Diet health (%)
Diet Behavior & Nutrition - Milk product consumption (# of products/month)
Diet Behavior & Nutrition - Meals not home prepared (#/week)
Diet Behavior & Nutrition - Meals from fast food or pizza place (#/week)
Diet Behavior & Nutrition - Ready-to-eat foods (#/month)
Diet Behavior & Nutrition - Frozen meals/pizza (#/month)
Drug Use - People that ever used marijuana or hashish (%)
Drug Use - Ever used hard drugs (%)
Drug Use - Ever used any form of cocaine (%)
Drug Use - Ever used heroin (%)
Drug Use - Ever used methamphetamine (%)
Health Insurance - People covered by health insurance (%)
Kidney Conditions-Urology - Avg. # of times urinating at night
Medical Conditions - People with asthma (%)
Medical Conditions - People with anemia (%)
Medical Conditions - People with psoriasis (%)
Medical Conditions - People with overweight (%)
Medical Conditions - Elderly people having difficulties in thinking or remembering (%)
Medical Conditions - People who ever received blood transfusion (%)
Medical Conditions - People having trouble seeing even with glass/contacts (%)
Medical Conditions - People with arthritis (%)
Medical Conditions - People with gout (%)
Medical Conditions - People with congestive heart failure (%)
Medical Conditions - People with coronary heart disease (%)
Medical Conditions - People with angina pectoris (%)
Medical Conditions - People who ever had heart attack (%)
Medical Conditions - People who ever had stroke (%)
Medical Conditions - People with emphysema (%)
Medical Conditions - People with thyroid problem (%)
Medical Conditions - People with chronic bronchitis (%)
Medical Conditions - People with any liver condition (%)
Medical Conditions - People who ever had cancer or malignancy (%)
Mental Health - People who have little interest in doing things (%)
Mental Health - People feeling down, depressed, or hopeless (%)
Mental Health - People who have trouble sleeping or sleeping too much (%)
Mental Health - People feeling tired or having little energy (%)
Mental Health - People with poor appetite or overeating (%)
Mental Health - People feeling bad about themself (%)
Mental Health - People who have trouble concentrating on things (%)
Mental Health - People moving or speaking slowly or too fast (%)
Mental Health - People having thoughts they would be better off dead (%)
Oral Health - Average years since last visit a dentist
Oral Health - People embarrassed because of mouth (%)
Oral Health - People with gum disease (%)
Oral Health - General health of teeth and gums (%)
Oral Health - Average days a week using dental floss/device
Oral Health - Average days a week using mouthwash for dental problem
Oral Health - Average number of teeth
Pesticide Use - Households using pesticides to control insects (%)
Pesticide Use - Households using pesticides to kill weeds (%)
Physical Activity - People doing vigorous-intensity work activities (%)
Physical Activity - People doing moderate-intensity work activities (%)
Physical Activity - People walking or bicycling (%)
Physical Activity - People doing vigorous-intensity recreational activities (%)
Physical Activity - People doing moderate-intensity recreational activities (%)
Physical Activity - Average hours a day doing sedentary activities
Physical Activity - Average hours a day watching TV or videos
Physical Activity - Average hours a day using computer
Physical Functioning - People having limitations keeping them from working (%)
Physical Functioning - People limited in amount of work they can do (%)
Physical Functioning - People that need special equipment to walk (%)
Physical Functioning - People experiencing confusion/memory problems (%)
Physical Functioning - People requiring special healthcare equipment (%)
Prescription Medications - Average number of prescription medicines taking
Preventive Aspirin Use - Adults 40+ taking low-dose aspirin (%)
Reproductive Health - Vaginal deliveries (%)
Reproductive Health - Cesarean deliveries (%)
Reproductive Health - Deliveries resulted in a live birth (%)
Reproductive Health - Pregnancies resulted in a delivery (%)
Reproductive Health - Women breastfeeding newborns (%)
Reproductive Health - Women that had a hysterectomy (%)
Reproductive Health - Women that had both ovaries removed (%)
Reproductive Health - Women that have ever taken birth control pills (%)
Reproductive Health - Women taking birth control pills (%)
Reproductive Health - Women that have ever used Depo-Provera or injectables (%)
Reproductive Health - Women that have ever used female hormones (%)
Sexual Behavior - People 18+ that ever had sex (vaginal, anal, or oral) (%)
Sexual Behavior - Males 18+ that ever had vaginal sex with a woman (%)
Sexual Behavior - Males 18+ that ever performed oral sex on a woman (%)
Sexual Behavior - Males 18+ that ever had anal sex with a woman (%)
Sexual Behavior - Males 18+ that ever had any sex with a man (%)
Sexual Behavior - Females 18+ that ever had vaginal sex with a man (%)
Sexual Behavior - Females 18+ that ever performed oral sex on a man (%)
Sexual Behavior - Females 18+ that ever had anal sex with a man (%)
Sexual Behavior - Females 18+ that ever had any kind of sex with a woman (%)
Sexual Behavior - Average age people first had sex
Sexual Behavior - Average number of female sex partners in lifetime (males 18+)
Sexual Behavior - Average number of female vaginal sex partners in lifetime (males 18+)
Sexual Behavior - Average age people first performed oral sex on a woman (18+)
Sexual Behavior - Average number of woman performed oral sex on in lifetime (18+)
Sexual Behavior - Average number of male sex partners in lifetime (males 18+)
Sexual Behavior - Average number of male anal sex partners in lifetime (males 18+)
Sexual Behavior - Average age people first performed oral sex on a man (18+)
Sexual Behavior - Average number of male oral sex partners in lifetime (18+)
Sexual Behavior - People using protection when performing oral sex (%)
Sexual Behavior - Average number of times people have vaginal or anal sex a year
Sexual Behavior - People having sex without condom (%)
Sexual Behavior - Average number of male sex partners in lifetime (females 18+)
Sexual Behavior - Average number of male vaginal sex partners in lifetime (females 18+)
Sexual Behavior - Average number of female sex partners in lifetime (females 18+)
Sexual Behavior - Circumcised males 18+ (%)
Sleep Disorders - Average hours sleeping at night
Sleep Disorders - People that has trouble sleeping (%)
Smoking-Cigarette Use - People smoking cigarettes (%)
Taste & Smell - People 40+ having problems with smell (%)
Taste & Smell - People 40+ having problems with taste (%)
Taste & Smell - People 40+ that ever had wisdom teeth removed (%)
Taste & Smell - People 40+ that ever had tonsils teeth removed (%)
Taste & Smell - People 40+ that ever had a loss of consciousness because of a head injury (%)
Taste & Smell - People 40+ that ever had a broken nose or other serious injury to face or skull (%)
Taste & Smell - People 40+ that ever had two or more sinus infections (%)
Weight - Average height (inches)
Weight - Average weight (pounds)
Weight - Average BMI
Weight - People that are obese (%)
Weight - People that ever were obese (%)
Weight - People trying to lose weight (%)
According to our research of Ohio and other state lists, there were 58 registered sex offenders living in Fairfield, Ohio as of April 27, 2024 . The ratio of all residents to sex offenders in Fairfield is 743 to 1.The ratio of registered sex offenders to all residents in this city is lower than the state average.
Officers per 1,000 residents here:
0.99Ohio average:
2.31
Latest news from Fairfield, OH collected exclusively by city-data.com from local newspapers, TV, and radio stations
Ancestries: German (12.9%), American (7.0%), African (5.0%), English (4.6%), Irish (3.0%), European (2.5%).
Current Local Time:
Land area: 21.0 square miles.
Population density: 2,118 people per square mile (low).
5,492 residents are foreign born (4.5% Africa , 3.7% Asia , 3.1% Latin America ).
Median real estate property taxes paid for housing units with mortgages in 2022: $2,554 (1.0%)Median real estate property taxes paid for housing units with no mortgage in 2022: $2,439 (1.2%)
Nearest city with pop. 50,000+: Hamilton, OH
Nearest city with pop. 200,000+: Cincinnati, OH
Nearest city with pop. 1,000,000+: Chicago, IL
Nearest cities:
Latitude: 39.33 N, Longitude: 84.54 W
Daytime population change due to commuting: +7,714 (+17.3%)Workers who live and work in this city: 7,407 (32.3%)
Area code commonly used in this area: 513
Property values in Fairfield, OH
Single-family new house construction building permits:
2022: 4 buildings , average cost: $419,2002021: 11 buildings , average cost: $404,5002020: 8 buildings , average cost: $260,1002019: 8 buildings , average cost: $225,1002018: 17 buildings , average cost: $191,0002017: 23 buildings , average cost: $164,0002016: 18 buildings , average cost: $194,4002015: 11 buildings , average cost: $212,9002014: 9 buildings , average cost: $163,0002013: 11 buildings , average cost: $207,4002012: 16 buildings , average cost: $187,4002011: 17 buildings , average cost: $178,3002010: 19 buildings , average cost: $230,8002009: 15 buildings , average cost: $250,8002008: 16 buildings , average cost: $177,3002007: 21 buildings , average cost: $241,8002006: 54 buildings , average cost: $234,9002005: 93 buildings , average cost: $176,3002004: 122 buildings , average cost: $129,1002003: 123 buildings , average cost: $134,7002002: 106 buildings , average cost: $121,7002001: 122 buildings , average cost: $100,2002000: 139 buildings , average cost: $115,0001999: 182 buildings , average cost: $131,4001998: 168 buildings , average cost: $118,7001997: 160 buildings , average cost: $105,000Unemployment in December 2023:
Population change in the 1990s: +2,186 (+5.5%).
Most common occupations in Fairfield, OH (%)
Both Males Females
Other management occupations, except farmers and farm managers (4.9%)
Other office and administrative support workers, including supervisors (4.5%)
Other sales and related occupations, including supervisors (4.0%)
Computer specialists (3.9%)
Other production occupations, including supervisors (3.8%)
Secretaries and administrative assistants (3.6%)
Sales representatives, services, wholesale and manufacturing (3.5%)
Other management occupations, except farmers and farm managers (6.3%)
Computer specialists (5.4%)
Engineers (4.9%)
Sales representatives, services, wholesale and manufacturing (4.9%)
Other production occupations, including supervisors (4.9%)
Other sales and related occupations, including supervisors (4.3%)
Electrical equipment mechanics and other installation, maintenance, and repair workers, including supervisors (4.2%)
Secretaries and administrative assistants (7.6%)
Other office and administrative support workers, including supervisors (6.8%)
Preschool, kindergarten, elementary, and middle school teachers (5.7%)
Registered nurses (5.1%)
Information and record clerks, except customer service representatives (3.7%)
Other sales and related occupations, including supervisors (3.7%)
Bookkeeping, accounting, and auditing clerks (3.6%)
Tornado activity:
Fairfield-area historical tornado activity is above Ohio state average. It is 73% greater than the overall U.S. average.
On 4/3/1974, a category F5 (max. wind speeds 261-318 mph) tornado 9.0 miles away from the Fairfield city center killed 3 people and injured 210 people .
On 4/3/1974, a category F4 (max. wind speeds 207-260 mph) tornado 11.0 miles away from the city center killed 2 people and injured 39 people and caused between $50,000 and $500,000 in damages.
Earthquake activity:
Fairfield-area historical earthquake activity is significantly above Ohio state average. It is 45% greater than the overall U.S. average. On 7/27/1980 at 18:52:21, a magnitude 5.2 (5.1 MB, 4.7 MS, 5.0 UK, 5.2 UK, Class: Moderate, Intensity: VI - VII) earthquake occurred 84.3 miles away from Fairfield center On 4/18/2008 at 09:36:59, a magnitude 5.4 (5.1 MB, 4.8 MS, 5.4 MW, 5.2 MW) earthquake occurred 190.0 miles away from Fairfield center On 4/18/2008 at 09:36:59, a magnitude 5.2 (5.2 MW, Depth: 8.9 mi) earthquake occurred 190.0 miles away from the city center On 6/10/1987 at 23:48:54, a magnitude 5.1 (4.9 MB, 4.4 MS, 4.6 MS, 5.1 LG) earthquake occurred 182.9 miles away from the city center On 9/7/1988 at 02:28:09, a magnitude 4.6 (4.5 MB, 4.6 LG, Class: Light, Intensity: IV - V) earthquake occurred 89.7 miles away from Fairfield center On 7/12/1986 at 08:19:37, a magnitude 4.5 (4.5 MB) earthquake occurred 83.9 miles away from Fairfield center Magnitude types: regional Lg-wave magnitude (LG), body-wave magnitude (MB), surface-wave magnitude (MS), moment magnitude (MW) Natural disasters: The number of natural disasters in Butler County (11) is smaller than the US average (15).Major Disasters (Presidential) Declared: 7Emergencies Declared: 3Floods: 5, Storms: 4, Tornadoes: 2, Blizzard: 1, Heavy Rain: 1, Hurricane: 1, Snow: 1, Snowstorm: 1, Tropical Depression: 1, Wind: 1, Other: 1 (Note: some incidents may be assigned to more than one category). Main business address for: OHIO CASUALTY CORP FIRE, MARINE & CASUALTY INSURANCE ), CINCINNATI FINANCIAL CORP FIRE, MARINE & CASUALTY INSURANCE ).
Hospitals in Fairfield: CAMELOT LAKE (5099 CAMELOT DRIVE) FAIRFIELD CENTER INC (350 KOLB DRIVE) MERCY HOSPITAL FAIRFIELD (Voluntary non-profit - Church, 3000 MACK ROAD) Nursing Homes in Fairfield: COMMUNITY MULTICARE CTR (908 SYMMES RD) CRESTWOOD CARE CTR (6200 PLEASANT AVE) HEARTLAND OF WOODRIDGE (3801 WOODRIDGE BOULEVARD) LILLIAN HOUSTON GERIATRIC CTR (6200 PLEASANT AVENUE) PARKSIDE NURSING AND REHABILITATION CENTER (908 SYMMES ROAD) TRI COUNTY EXTENDED CARE CENTER (5200 CAMELOT DRIVE) Dialysis Facilities in Fairfield: DAVITA - FAIRFIELD DIALYSIS (1210 HICKS BLVD) FAIRFIELD HOME TRAINING DIALYSIS (1210 HICKS BLVD) FMC - DIALYSIS SPECIALISTS OF FAIRFIELD (4750 DIXIE HWY) Heliports located in Fairfield: Amtrak stations near Fairfield: 5 miles: HAMILTON (M. L. KING BLVD AT HENRY ST.) Services: public payphones, free short-term parking, call for taxi service, public transit connection.
16 miles: CINCINNATI (1301 WESTERN AVE.) Services: ticket office, fully wheelchair accessible, enclosed waiting area, public restrooms, public payphones, full-service food facilities, free short-term parking, paid long-term parking, taxi stand.
College/University in Fairfield: Moler-Pickens Beauty Academy Full-time enrollment: 59; Location: 5951-S Boymel Dr.; Private, for-profit; Website: molerhollywood.com)
Colleges/universities with over 2000 students nearest to Fairfield:
Miami University-Hamilton (about 4 miles; Hamilton, OH ; Full-time enrollment: 2,906)
University of Cincinnati-Blue Ash College (about 11 miles; Blue Ash, OH ; FT enrollment: 3,711)
Cincinnati State Technical and Community College (about 13 miles; Cincinnati, OH ; FT enrollment: 8,757)
Xavier University (about 14 miles; Cincinnati, OH ; FT enrollment: 6,143)
University of Cincinnati-Main Campus (about 14 miles; Cincinnati, OH ; FT enrollment: 28,747)
Miami University-Oxford (about 16 miles; Oxford, OH ; FT enrollment: 17,670)
College of Mount St Joseph (about 18 miles; Cincinnati, OH ; FT enrollment: 2,073)
Public high schools in Fairfield:
Private high school in Fairfield: CINCINNATI CHRISTIAN SCHOOLS Students: 410, Location: 7474 MORRIS RD, Grades: 7-12)
Public elementary/middle schools in Fairfield: FAIRFIELD INTERMEDIATE ELEMENTARY SCHOOL Students: 1,561, Location: 255 DONALD DR, Grades: 5-8)FAIRFIELD MIDDLE SCHOOL Students: 1,532, Location: 1111 NILLES RD, Grades: 7-8)FAIRFIELD CENTRAL ELEMENTARY SCHOOL Students: 630, Location: 5058 DIXIE HWY, Grades: PK-4)FAIRFIELD WEST ELEMENTARY SCHOOL Students: 608, Location: 4700 RIVER RD, Grades: PK-4)FAIRFIELD SOUTH ELEMENTARY SCHOOL Students: 515, Location: 5460 BIBURY RD, Grades: PK-4)Private elementary/middle school in Fairfield: SACRED HEART ELEMENTARY SCHOOL Students: 387, Location: 400 NILLES RD, Grades: 1-8)
See full list of schools located in Fairfield User-submitted facts and corrections:
fairfield senior high school is only 10-12 grades is it not for freshman that is why we have a freshman building
added by Whitney
Notable locations in Fairfield: (A) , Eagles View Office Park (B) , Fairfield Business Center (C) , Fairfield Executive Center (D) , Fairfield Schumacher Business Park (E) , Fairfield Schumacher Industrial Park (F) , Northpoint Business Park (G) , Orchard Hill Professional Center (H) , Rolling Hills Country Club (I) , Hicks Industrial Park (J) , Stockton Industrial Park (K) , Fairfield Industrial Park (L) , Wildwood Golf Course (M) , Fairfield Golf Course (N) , Bypass Four Commerce Center (O) , Fairsmith Station (P) , Fairfield Water Treatment Plant (Q) , Fairfield Police Department (R) , Medcorp Emergency Medical Services (S) , Fairfield Fire Department Station 3 (T) . Display/hide their locations on the map
Shopping Centers: (1) , Fairfield Center Mall Shopping Center (2) , Fair Plaza Shopping Center (3) , Hicks Manor Shopping Center (4) , Woodridge Plaza Shopping Center (5) , Diplomate Village Shopping Center (6) , Winton Plaza Shopping Center (7) , Riegert Shopping Center (8) . Display/hide their locations on the map
Main business address in Fairfield include: (A) , CINCINNATI FINANCIAL CORP (B) . Display/hide their locations on the map
Churches in Fairfield include: (A) , The Church of Jesus Christ of Latter Day Saints (B) , Fairfield Wesleyan Church (C) , Saint Marks United Methodist Church (D) , First Baptist Church of Fairfield (E) , Fairfield Missionary Church (F) , Fairfield Church of the Nazarene (G) , Fairfield West Baptist Church (H) , Governors Park Baptist Church (I) . Display/hide their locations on the map
Cemetery: (1) . Display/hide its location on the map
Streams, rivers, and creeks: (A) , Pleasant Run (B) . Display/hide their locations on the map
Parks in Fairfield include: (1) , Pleasant Run Recreation Center (2) , Point Pleasant Soccer Fields (3) , Harbin Park (4) , Lakewood Park (5) , Gilbert Park (6) , Winton Hills Park (7) , Good Neighbors Park (8) , Fairfield Optimist Park (9) . Display/hide their locations on the map
Hotels: (1) , Econo Lodge Inn & Suites (4670 Dixie Highway) (2) , Extended Stay America - Cincinnati/Fairfield (9651 Seward Rd) (3) , Hampton Inn Cincinnati- NW/Fairfield (430 Kolb Drive) (4) , Carriage Inn (6419 Dixie Highway) (5) , Holiday Inn Express Fairfield (6755 Fairfield Business Park) (6) , Econo Lodge (4670 Dixie Highway) (7) . Display/hide their approximate locations on the map
Birthplace of: Daniel Wisler - Actor, Jeff Hartsock - Baseball player, Norman Plummer - College basketball player (Dayton Flyers).
Butler County has a predicted average indoor radon screening level greater than 4 pCi/L (pico curies per liter) - Highest Potential Drinking water stations with addresses in Fairfield that have no violations reported:
FAIRFIELD CITY PWS (Population served: 42,510, Primary Water Source Type: Groundwater)
Average household size: This city:
2.4 peopleOhio:
2.4 people
Percentage of family households: This city:
65.3%Whole state:
65.0%
Percentage of households with unmarried partners: This city:
6.9%Whole state:
6.8%
Likely homosexual households (counted as self-reported same-sex unmarried-partner households)
Lesbian couples: 0.3% of all households Gay men: 0.3% of all households
People in group quarters in Fairfield in 2010:
384 people in nursing facilities/skilled-nursing facilities
90 people in group homes intended for adults
20 people in group homes for juveniles (non-correctional)
12 people in other noninstitutional facilities
People in group quarters in Fairfield in 2000:
411 people in nursing homes
204 people in homes for the mentally retarded
24 people in other noninstitutional group quarters
9 people in religious group quarters
6 people in homes for the mentally ill
Banks with branches in Fairfield (2011 data):
U.S. Bank National Association: Fairfield Route 4 Branch, Fairfield Branch, Woodridge Retirement Center Branch, Fairfield Pavillion Retirement Ctr B, Forest Park Meijer Branch. Info updated 2012/01/30: Bank assets: $330,470.8 mil, Deposits: $236,091.5 mil, headquarters in Cincinnati, OH, positive income , 3121 total offices , Holding Company: U.S. Bancorp
First Financial Bank, National Association: Fairfield-South Gilmore Branch, Fairfield Towne Center, Ross Branch, Fairfield Crossings. Info updated 2009/09/21: Bank assets: $6,663.4 mil, Deposits: $5,754.9 mil, headquarters in Hamilton, OH, positive income , Commercial Lending Specialization, 101 total offices , Holding Company: First Financial Bancorp
Fifth Third Bank: Fairfield Exec. Banking Ctr. Branch, Fairfield Branch, Jungle Jim's Bank Mart Branch, Indian Springs Banking Center Branch. Info updated 2009/10/05: Bank assets: $114,540.4 mil, Deposits: $89,689.1 mil, headquarters in Cincinnati, OH, positive income , Commercial Lending Specialization, 1378 total offices , Holding Company: Fifth Third Bancorp
PNC Bank, National Association: Fairfield Village Green Branch, Indian Springs Branch, Fairfield Branch. Info updated 2012/03/20: Bank assets: $263,309.6 mil, Deposits: $197,343.0 mil, headquarters in Wilmington, DE, positive income , Commercial Lending Specialization, 3085 total offices , Holding Company: Pnc Financial Services Group, Inc., The
LCNB National Bank: Fairfield Branch at 765 Nilles Road, branch established on 2004/11/22. Info updated 2010/06/02: Bank assets: $787.1 mil, Deposits: $664.9 mil, headquarters in Lebanon, OH, positive income , Commercial Lending Specialization, 26 total offices , Holding Company: Lcnb Corp.
JPMorgan Chase Bank, National Association: Fairfield Branch at 5200 Pleasant Avenue, branch established on 1985/06/30. Info updated 2011/11/10: Bank assets: $1,811,678.0 mil, Deposits: $1,190,738.0 mil, headquarters in Columbus, OH, positive income , International Specialization, 5577 total offices , Holding Company: Jpmorgan Chase & Co.
Union Savings Bank: Fairfield Branch at 721 Wessel Dr., branch established on 2002/10/08. Info updated 2012/01/04: Bank assets: $2,218.6 mil, Deposits: $1,997.4 mil, headquarters in Cincinnati, OH, positive income , Mortgage Lending Specialization, 25 total offices
KeyBank National Association: Fairfield Branch at 5000 Dixie Highway, branch established on 1970/12/16. Info updated 2008/03/03: Bank assets: $86,198.8 mil, Deposits: $64,214.8 mil, headquarters in Cleveland, OH, positive income , Commercial Lending Specialization, 1067 total offices , Holding Company: Keycorp
For population 15 years and over in Fairfield:
Never married: 30.2%Now married: 50.6%Separated: 0.8%Widowed: 6.2%Divorced: 12.1% For population 25 years and over in Fairfield:
High school or higher: 92.8%Bachelor's degree or higher: 30.1%Graduate or professional degree: 8.2%Unemployed: 3.0%Mean travel time to work (commute): 20.4 minutes
Education Gini index (Inequality in education) Here:
11.7Ohio average:
11.0
Religion statistics for Fairfield, OH (based on Butler County data)
Religion Adherents Congregations Evangelical Protestant 63,088 210 Catholic 44,417 13 Mainline Protestant 22,088 68 Other 6,647 28 Black Protestant 2,609 13 Orthodox 90 1 None 229,191 -
Source: Clifford Grammich, Kirk Hadaway, Richard Houseal, Dale E.Jones, Alexei Krindatch, Richie Stanley and Richard H.Taylor. 2012. 2010 U.S.Religion Census: Religious Congregations & Membership Study. Association of Statisticians of American Religious Bodies. Jones, Dale E., et al. 2002. Congregations and Membership in the United States 2000. Nashville, TN: Glenmary Research Center. Graphs represent county-level data
Food Environment Statistics: Number of grocery stores : 59This county :
1.65 / 10,000 pop.Ohio :
1.89 / 10,000 pop.
Number of supercenters and club stores : 3Butler County :
0.08 / 10,000 pop.Ohio :
0.13 / 10,000 pop.
Number of convenience stores (no gas) : 32Butler County :
0.89 / 10,000 pop.Ohio :
1.25 / 10,000 pop.
Number of convenience stores (with gas) : 109Butler County :
3.05 / 10,000 pop.Ohio :
2.93 / 10,000 pop.
Number of full-service restaurants : 188Butler County :
5.25 / 10,000 pop.Ohio :
6.25 / 10,000 pop.
Adult diabetes rate : This county :
10.0%Ohio :
10.3%
Adult obesity rate : Butler County :
30.2%State :
29.1%
Low-income preschool obesity rate : Butler County :
14.7%Ohio :
11.9%
Health and Nutrition:
Average overall health of teeth and gums : Fairfield:
43.4%Ohio:
47.8%
People feeling badly about themselves : Fairfield:
22.2%Ohio:
20.6%
People not drinking alcohol at all : Fairfield:
11.4%Ohio:
10.4%
Average hours sleeping at night : Overweight people : Fairfield:
33.2%Ohio:
34.3%
General health condition : Average condition of hearing : This city:
78.4%State:
79.1%
More about Health and Nutrition of Fairfield, OH Residents
Local government employment and payroll (March 2022)
Function
Full-time employees
Monthly full-time payroll
Average yearly full-time wage
Part-time employees
Monthly part-time payroll
Police Protection - Officers
63 $484,590 $92,303 0 $0 Firefighters
39 $405,958 $124,910 29 $61,593 Streets and Highways
26 $155,197 $71,629 4 $6,532 Police - Other
24 $144,272 $72,136 4 $8,926 Financial Administration
23 $128,832 $67,217 0 $0 Parks and Recreation
21 $123,269 $70,439 41 $37,410 Sewerage
20 $129,022 $77,413 1 $1,966 Water Supply
19 $136,435 $86,169 1 $2,458 Judicial and Legal
18 $79,807 $53,205 11 $29,503 Other Government Administration
17 $117,488 $82,933 6 $9,014 Other and Unallocable
8 $52,837 $79,256 0 $0 Fire - Other
4 $34,142 $102,426 0 $0
Totals for Government
282 $1,991,851 $84,760 97 $157,403
Fairfield government finances - Expenditure in 2021 (per resident):
Construction - Regular Highways: $8,225,000 ($185.01)
General - Other: $7,697,000 ($173.14)Water Utilities: $2,076,000 ($46.70)Sewerage: $969,000 ($21.80)Current Operations - Police Protection: $12,136,000 ($272.99)
Local Fire Protection: $7,294,000 ($164.07)Parks and Recreation: $6,559,000 ($147.54)Water Utilities: $6,232,000 ($140.18)General - Other: $5,412,000 ($121.74)Sewerage: $5,179,000 ($116.50)Regular Highways: $3,800,000 ($85.48)Judicial and Legal Services: $2,408,000 ($54.17)Solid Waste Management: $2,334,000 ($52.50)Central Staff Services: $1,785,000 ($40.15)Financial Administration: $1,346,000 ($30.28)Protective Inspection and Regulation - Other: $797,000 ($17.93)Corrections - Other: $382,000 ($8.59)General Public Buildings: $330,000 ($7.42)General - Interest on Debt: $514,000 ($11.56)
Intergovernmental to State - Sewerage: $43,000 ($0.97)
Other Capital Outlay - Regular Highways: $843,000 ($18.96)
General - Other: $449,000 ($10.10)Parks and Recreation: $209,000 ($4.70)Total Salaries and Wages: $35,086,000 ($789.23)
Water Utilities - Interest on Debt: $83,000 ($1.87)
Fairfield government finances - Revenue in 2021 (per resident):
Charges - Sewerage: $7,065,000 ($158.92)
Solid Waste Management: $2,329,000 ($52.39)Other: $2,058,000 ($46.29)Parks and Recreation: $261,000 ($5.87)Local Intergovernmental - Highways: $2,009,000 ($45.19)
Miscellaneous - Fines and Forfeits: $1,775,000 ($39.93)
Interest Earnings: $1,379,000 ($31.02)General Revenue - Other: $1,053,000 ($23.69)Special Assessments: $394,000 ($8.86)Sale of Property: $152,000 ($3.42)Revenue - Water Utilities: $7,477,000 ($168.19)
State Intergovernmental - Highways: $7,260,000 ($163.31)
General Local Government Support: $1,464,000 ($32.93)Other: $1,238,000 ($27.85)Water Utilities: $77,000 ($1.73)Tax - Individual Income: $28,199,000 ($634.31)
Property: $12,845,000 ($288.94)Other License: $398,000 ($8.95)Amusements Sales: $1,000 ($0.02)
Fairfield government finances - Debt in 2021 (per resident):
Long Term Debt - Beginning Outstanding - Unspecified Public Purpose: $11,671,000 ($262.53)
Outstanding Unspecified Public Purpose: $10,329,000 ($232.34)Retired Unspecified Public Purpose: $1,342,000 ($30.19)
Fairfield government finances - Cash and Securities in 2021 (per resident):
Bond Funds - Cash and Securities: $2,128,000 ($47.87)
Other Funds - Cash and Securities: $63,765,000 ($1434.34)
Sinking Funds - Cash and Securities: $2,041,000 ($45.91)
6.49% of this county's 2021 resident taxpayers lived in other counties in 2020 ($55,999 average adjusted gross income )
Here:
6.49%Ohio average:
5.68%
0.01% of residents moved from foreign countries ($83 average AGI )Butler County:
0.01%Ohio average:
0.01%
Top counties from which taxpayers relocated into this county between 2020 and 2021:
Businesses in Fairfield, OH
Name Count Name Count
Advance Auto Parts 1 Kroger 1 Applebee's 1 Little Caesars Pizza 1 Arby's 3 Long John Silver's 1 AutoZone 1 MasterBrand Cabinets 1 Baskin-Robbins 1 McDonald's 3 Blockbuster 1 Meijer 1 Budget Car Rental 1 Nissan 1 Buffalo Wild Wings 1 Olive Garden 1 Burger King 2 Panera Bread 1 CVS 1 Papa John's Pizza 1 Chipotle 1 Penske 1 Circle K 1 Pizza Hut 2 Cricket Wireless 1 Popeyes 1 Decora Cabinetry 1 RadioShack 1 Domino's Pizza 1 Rue21 1 Dunkin Donuts 1 Sears 1 Extended Stay America 1 Starbucks 1 Fashion Bug 1 Subaru 1 FedEx 5 T-Mobile 1 GNC 1 Taco Bell 1 Goodwill 1 Toyota 1 H&R Block 2 U-Haul 1 Hilton 1 UPS 6 Holiday Inn 1 Volkswagen 1 Honda 1 Waffle House 1 Hyundai 1 Walgreens 2 InTown Suites 1 Wendy's 2 KFC 1 White Castle 1 Kincaid 1 YMCA 1 Kohl's 2
Strongest AM radio stations in Fairfield:
WCNW (1560 AM; daytime; 5 kW; FAIRFIELD, OH)
WLW (700 AM; 50 kW; CINCINNATI, OH; Owner: JACOR BROADCASTING CORPORATION)
WCKY (1360 AM; 5 kW; CINCINNATI, OH; Owner: JACOR BROADCASTING CORPORATION)
WSAI (1530 AM; 50 kW; CINCINNATI, OH; Owner: JACOR BROADCASTING CORPORATION)
WCIN (1480 AM; 5 kW; CINCINNATI, OH)
WMOH (1450 AM; 1 kW; HAMILTON, OH; Owner: THE MIAMI RIVER BROADCASTING COMPANY)
WKRC (550 AM; 5 kW; CINCINNATI, OH; Owner: JACOR BROADCASTING CORPORATION)
WTVN (610 AM; 50 kW; COLUMBUS, OH; Owner: CITICASTERS LICENSES, L.P.)
WHAS (840 AM; 50 kW; LOUISVILLE, KY; Owner: CLEAR CHANNEL BROADCASTING LICENSES, INC.)
WBOB (1160 AM; 5 kW; FLORENCE, KY; Owner: CARON BROADCASTING, INC.)
WONE (980 AM; 5 kW; DAYTON, OH; Owner: CITICASTERS LICENSES, L.P.)
WNOP (740 AM; 1 kW; NEWPORT, KY; Owner: SACRED HEART RADIO, INC.)
WIBC (1070 AM; 50 kW; INDIANAPOLIS, IN; Owner: EMMIS RADIO LICENSE CORPORATION)
Strongest FM radio stations in Fairfield:
WMOJ (94.9 FM; FAIRFIELD, OH; Owner: WVAE LICO, INC.)
WGRR (103.5 FM; HAMILTON, OH; Owner: INFINITY RADIO OPERATIONS INC.)
WRRM (98.5 FM; CINCINNATI, OH; Owner: WRRM LICO, INC)
WYGY (96.5 FM; LEBANON, OH; Owner: WVAE LICO, INC.)
WAKW (93.3 FM; CINCINNATI, OH; Owner: PILLAR OF FIRE)
WUBE-FM (105.1 FM; CINCINNATI, OH; Owner: INFINITY RADIO OPERATIONS INC.)
WGUC (90.9 FM; CINCINNATI, OH; Owner: CINCINNATI CLASSICAL PUBLIC RADIO, INC.)
WOFX-FM (92.5 FM; CINCINNATI, OH; Owner: JACOR BROADCASTING CORPORATION)
WKRQ (101.9 FM; CINCINNATI, OH; Owner: INFINITY RADIO OPERATIONS INC.)
WKFS (107.1 FM; MILFORD, OH; Owner: JACOR BROADCASTING CORPORATION)
WVMX (94.1 FM; CINCINNATI, OH; Owner: CITICASTERS LICENSES, L.P.)
WEBN (102.7 FM; CINCINNATI, OH; Owner: JACOR BROADCASTING CORPORATION)
WVXU (91.7 FM; CINCINNATI, OH; Owner: XAVIER UNIVERSITY)
WLHS (89.9 FM; WEST CHESTER, OH; Owner: LAKOTA LOCAL SCHOOL DISTRICT)
WHSS (89.5 FM; HAMILTON, OH; Owner: HAMILTON SCHOOL DISTRICT)
WPFB-FM (105.9 FM; MIDDLETOWN, OH; Owner: RADIO STATIONS WPAY/WPFB, INC.)
WIZF (100.9 FM; ERLANGER, KY; Owner: BLUE CHIP BROADCASTING LICENSES II, LTD.)
WMKV (89.3 FM; READING, OH; Owner: LIFESPHERE)
WAIF (88.3 FM; CINCINNATI, OH; Owner: STEPCHILD RADIO OF CINCINNATI, INC.)
WAQZ (97.3 FM; FORT THOMAS, KY; Owner: INFINITY RADIO OPERATIONS INC.)
TV broadcast stations around Fairfield:
WLWT (Channel 5; CINCINNATI, OH; Owner: OHIO/OKLAHOMA HEARST-ARGYLE TV, INC)
WCPO-TV (Channel 9; CINCINNATI, OH; Owner: SCRIPPS HOWARD BROADCASTING COMPANY)
WKOI (Channel 43; RICHMOND, IN; Owner: TRINITY BROADCASTING OF INDIANA, INC.)
WXIX-TV (Channel 19; NEWPORT, KY; Owner: RAYCOM NATIONAL, INC.)
WSTR-TV (Channel 64; CINCINNATI, OH; Owner: WSTR LICENSEE, INC.)
WCET (Channel 48; CINCINNATI, OH; Owner: THE GREATER CINCINNATI TV EDUC'L. FOUNDATION)
WKRC-TV (Channel 12; CINCINNATI, OH; Owner: CITICASTERS CO.)
WPTO (Channel 14; OXFORD, OH; Owner: GREATER DAYTON PUBLIC TELEVISION, INC.)
WBQC-CA (Channel 25; CINCINNATI, OH; Owner: ELLIOTT B. BLOCK)
WOTH-LP (Channel 35; CINCINNATI, OH; Owner: ELLIOTT B. BLOCK)
WHIO-TV (Channel 7; DAYTON, OH; Owner: WHIO-TV HOLDINGS, INC.)
WDTN (Channel 2; DAYTON, OH; Owner: WDTN BROADCASTING, LLC)
WPTD (Channel 16; DAYTON, OH; Owner: GREATER DAYTON PUBLIC TV, INC.)
WKEF (Channel 22; DAYTON, OH; Owner: WKEF LICENSEE L.P.)
WRGT-TV (Channel 45; DAYTON, OH; Owner: WRGT LICENSEE, LLC)
W61DE (Channel 61; CINCINNATI, OH; Owner: TRINITY BROADCASTING NETWORK)
WWRD-LP (Channel 55; CENTERVILLE, OH; Owner: LIFE BROADCASTING NETWORK)
WCVN-TV (Channel 54; COVINGTON, KY; Owner: KENTUCKY AUTHORITY FOR EDUCATIONAL TV)
Medal of Honor Recipients
Medal of Honor Recipient born in Fairfield: George S. Myers.
National Bridge Inventory (NBI) Statistics 38 Number of bridges322ft / 98.5m Total length356,089 Total average daily traffic21,797 Total average daily truck traffic
New bridges - historical statistics
2 1930-1939 1 1950-1959 4 1960-1969 6 1970-1979 2 1980-1989 13 1990-1999 9 2000-2009 1 2010-2019
See full National Bridge Inventory statistics for Fairfield, OH
Home Mortgage Disclosure Act Aggregated Statistics For Year 2009(Based on 6 full and 2 partial tracts) A) FHA, FSA/RHS & VA B) Conventional C) Refinancings D) Home Improvement Loans E) Loans on Dwellings For 5+ Families F) Non-occupant Loans on G) Loans On Manufactured Number Average Value Number Average Value Number Average Value Number Average Value Number Average Value Number Average Value Number Average Value
LOANS ORIGINATED 199 $121,498 122 $128,211 893 $131,459 29 $39,719 6 $3,893,235 22 $95,703 0 $0 APPLICATIONS APPROVED, NOT ACCEPTED 11 $105,228 10 $128,470 67 $124,517 12 $11,915 0 $0 5 $81,790 0 $0 APPLICATIONS DENIED 36 $118,914 30 $109,857 304 $141,026 26 $41,663 0 $0 8 $109,454 4 $23,232 APPLICATIONS WITHDRAWN 16 $106,718 14 $107,566 125 $137,226 8 $39,010 0 $0 5 $52,628 1 $9,700 FILES CLOSED FOR INCOMPLETENESS 3 $166,667 1 $161,290 32 $132,476 2 $40,635 0 $0 1 $92,000 0 $0
Aggregated Statistics For Year 2008(Based on 6 full and 2 partial tracts) A) FHA, FSA/RHS & VA B) Conventional C) Refinancings D) Home Improvement Loans E) Loans on Dwellings For 5+ Families F) Non-occupant Loans on G) Loans On Manufactured Number Average Value Number Average Value Number Average Value Number Average Value Number Average Value Number Average Value Number Average Value
LOANS ORIGINATED 160 $131,460 199 $115,327 427 $130,737 68 $28,594 4 $279,662 45 $90,827 5 $34,146 APPLICATIONS APPROVED, NOT ACCEPTED 10 $131,911 13 $75,468 49 $126,938 13 $25,221 0 $0 3 $77,370 6 $40,972 APPLICATIONS DENIED 34 $124,026 41 $110,215 325 $139,071 40 $37,723 1 $268,820 21 $84,841 7 $34,956 APPLICATIONS WITHDRAWN 25 $120,263 23 $147,494 122 $142,277 8 $82,228 0 $0 8 $81,131 0 $0 FILES CLOSED FOR INCOMPLETENESS 3 $151,443 7 $114,691 30 $170,274 2 $150,435 0 $0 2 $97,565 0 $0
Aggregated Statistics For Year 2007(Based on 6 full and 2 partial tracts) A) FHA, FSA/RHS & VA B) Conventional C) Refinancings D) Home Improvement Loans E) Loans on Dwellings For 5+ Families F) Non-occupant Loans on G) Loans On Manufactured Number Average Value Number Average Value Number Average Value Number Average Value Number Average Value Number Average Value Number Average Value
LOANS ORIGINATED 60 $125,041 489 $116,357 572 $117,295 79 $36,397 5 $3,380,202 96 $94,744 4 $74,402 APPLICATIONS APPROVED, NOT ACCEPTED 7 $110,716 48 $107,505 118 $113,806 15 $45,777 0 $0 11 $88,603 2 $43,000 APPLICATIONS DENIED 10 $140,818 78 $138,108 490 $121,557 61 $37,453 1 $641,880 42 $84,271 11 $33,003 APPLICATIONS WITHDRAWN 12 $127,582 41 $126,971 195 $125,778 17 $68,533 0 $0 18 $81,568 1 $60,000 FILES CLOSED FOR INCOMPLETENESS 0 $0 10 $135,235 72 $136,488 2 $134,775 0 $0 4 $58,835 0 $0
Aggregated Statistics For Year 2006(Based on 6 full and 2 partial tracts) A) FHA, FSA/RHS & VA B) Conventional C) Refinancings D) Home Improvement Loans E) Loans on Dwellings For 5+ Families F) Non-occupant Loans on G) Loans On Manufactured Number Average Value Number Average Value Number Average Value Number Average Value Number Average Value Number Average Value Number Average Value
LOANS ORIGINATED 80 $128,872 593 $116,096 685 $110,081 117 $35,198 6 $4,547,478 110 $103,455 1 $31,740 APPLICATIONS APPROVED, NOT ACCEPTED 3 $132,563 68 $99,476 145 $110,010 23 $32,919 0 $0 13 $107,386 3 $29,580 APPLICATIONS DENIED 12 $117,164 103 $115,587 509 $124,345 74 $29,027 1 $786,990 40 $121,040 9 $21,587 APPLICATIONS WITHDRAWN 12 $101,181 72 $122,488 222 $126,782 12 $71,882 0 $0 19 $117,783 0 $0 FILES CLOSED FOR INCOMPLETENESS 2 $104,480 21 $117,563 56 $157,843 3 $30,530 0 $0 3 $69,667 0 $0
Aggregated Statistics For Year 2005(Based on 6 full and 2 partial tracts) A) FHA, FSA/RHS & VA B) Conventional C) Refinancings D) Home Improvement Loans E) Loans on Dwellings For 5+ Families F) Non-occupant Loans on G) Loans On Manufactured Number Average Value Number Average Value Number Average Value Number Average Value Number Average Value Number Average Value Number Average Value
LOANS ORIGINATED 91 $129,433 734 $109,777 844 $111,656 104 $35,302 9 $3,474,052 106 $97,478 3 $68,953 APPLICATIONS APPROVED, NOT ACCEPTED 6 $182,025 89 $104,514 172 $119,720 19 $20,838 1 $1,050,000 13 $87,193 3 $26,907 APPLICATIONS DENIED 16 $129,782 158 $102,042 563 $124,927 119 $28,795 0 $0 36 $93,539 13 $34,907 APPLICATIONS WITHDRAWN 5 $119,966 75 $93,389 333 $121,967 33 $148,009 1 $374,410 16 $122,769 1 $170,000 FILES CLOSED FOR INCOMPLETENESS 3 $105,520 31 $105,412 76 $122,806 0 $0 0 $0 1 $116,000 0 $0
Aggregated Statistics For Year 2004(Based on 6 full and 2 partial tracts) A) FHA, FSA/RHS & VA B) Conventional C) Refinancings D) Home Improvement Loans E) Loans on Dwellings For 5+ Families F) Non-occupant Loans on G) Loans On Manufactured Number Average Value Number Average Value Number Average Value Number Average Value Number Average Value Number Average Value Number Average Value
LOANS ORIGINATED 113 $116,175 663 $113,322 1,017 $109,942 91 $43,639 5 $2,646,252 106 $86,213 3 $55,433 APPLICATIONS APPROVED, NOT ACCEPTED 3 $107,637 65 $113,920 195 $117,789 22 $28,244 0 $0 6 $106,655 4 $64,207 APPLICATIONS DENIED 17 $114,637 98 $108,730 493 $115,708 81 $30,858 0 $0 38 $69,927 6 $13,187 APPLICATIONS WITHDRAWN 7 $116,337 70 $120,641 342 $123,281 25 $34,722 1 $26,450 15 $106,145 0 $0 FILES CLOSED FOR INCOMPLETENESS 2 $82,630 19 $112,562 73 $117,416 3 $31,407 0 $0 5 $104,438 0 $0
Aggregated Statistics For Year 2003(Based on 6 full and 2 partial tracts) A) FHA, FSA/RHS & VA B) Conventional C) Refinancings D) Home Improvement Loans E) Loans on Dwellings For 5+ Families F) Non-occupant Loans on Number Average Value Number Average Value Number Average Value Number Average Value Number Average Value Number Average Value
LOANS ORIGINATED 118 $113,228 611 $114,436 2,702 $108,095 84 $21,840 6 $2,826,253 153 $95,258 APPLICATIONS APPROVED, NOT ACCEPTED 1 $153,000 56 $97,948 301 $116,211 19 $25,129 0 $0 17 $173,053 APPLICATIONS DENIED 18 $112,971 82 $101,719 538 $108,256 70 $28,737 0 $0 36 $90,276 APPLICATIONS WITHDRAWN 4 $91,610 57 $117,742 395 $121,117 13 $35,438 0 $0 8 $118,814 FILES CLOSED FOR INCOMPLETENESS 6 $124,708 26 $107,184 134 $112,794 5 $25,230 0 $0 5 $83,700
Aggregated Statistics For Year 2002(Based on 6 full and 2 partial tracts) A) FHA, FSA/RHS & VA B) Conventional C) Refinancings D) Home Improvement Loans E) Loans on Dwellings For 5+ Families F) Non-occupant Loans on Number Average Value Number Average Value Number Average Value Number Average Value Number Average Value Number Average Value
LOANS ORIGINATED 152 $109,431 569 $102,527 1,887 $106,681 103 $18,633 8 $432,134 106 $74,626 APPLICATIONS APPROVED, NOT ACCEPTED 5 $78,610 47 $81,147 263 $109,244 26 $12,925 0 $0 9 $84,782 APPLICATIONS DENIED 5 $92,168 94 $82,485 454 $94,929 61 $14,369 0 $0 23 $75,898 APPLICATIONS WITHDRAWN 10 $110,367 62 $105,572 319 $113,772 15 $20,998 0 $0 13 $50,990 FILES CLOSED FOR INCOMPLETENESS 2 $119,085 24 $90,235 97 $105,773 5 $27,272 0 $0 3 $99,750
Aggregated Statistics For Year 2001(Based on 6 full and 2 partial tracts) A) FHA, FSA/RHS & VA B) Conventional C) Refinancings D) Home Improvement Loans E) Loans on Dwellings For 5+ Families F) Non-occupant Loans on Number Average Value Number Average Value Number Average Value Number Average Value Number Average Value Number Average Value
LOANS ORIGINATED 215 $100,687 536 $99,812 1,594 $104,705 144 $16,069 4 $403,070 76 $86,691 APPLICATIONS APPROVED, NOT ACCEPTED 12 $94,951 50 $82,844 248 $89,743 54 $15,678 0 $0 6 $59,890 APPLICATIONS DENIED 17 $110,479 93 $72,667 421 $91,505 74 $13,820 0 $0 11 $46,985 APPLICATIONS WITHDRAWN 12 $106,558 50 $102,136 297 $103,531 23 $32,198 0 $0 10 $60,502 FILES CLOSED FOR INCOMPLETENESS 4 $99,000 12 $83,207 60 $105,139 3 $19,827 0 $0 5 $44,000
Aggregated Statistics For Year 2000(Based on 6 full and 2 partial tracts) A) FHA, FSA/RHS & VA B) Conventional C) Refinancings D) Home Improvement Loans E) Loans on Dwellings For 5+ Families F) Non-occupant Loans on Number Average Value Number Average Value Number Average Value Number Average Value Number Average Value Number Average Value
LOANS ORIGINATED 173 $98,437 508 $100,100 381 $82,074 154 $17,242 2 $1,337,030 45 $83,242 APPLICATIONS APPROVED, NOT ACCEPTED 7 $89,990 72 $73,985 132 $85,395 53 $16,208 0 $0 2 $113,000 APPLICATIONS DENIED 15 $100,458 97 $69,980 313 $81,243 109 $13,559 0 $0 18 $74,219 APPLICATIONS WITHDRAWN 11 $108,496 60 $92,082 136 $82,496 24 $26,069 1 $124,670 5 $109,704 FILES CLOSED FOR INCOMPLETENESS 1 $68,000 16 $82,568 45 $94,962 2 $17,500 0 $0 0 $0
Aggregated Statistics For Year 1999(Based on 6 full and 2 partial tracts) A) FHA, FSA/RHS & VA B) Conventional C) Refinancings D) Home Improvement Loans E) Loans on Dwellings For 5+ Families F) Non-occupant Loans on Number Average Value Number Average Value Number Average Value Number Average Value Number Average Value Number Average Value
LOANS ORIGINATED 233 $95,563 596 $99,104 813 $86,938 210 $12,445 8 $702,890 62 $56,552 APPLICATIONS APPROVED, NOT ACCEPTED 4 $84,465 55 $80,434 205 $86,590 56 $8,536 0 $0 5 $40,604 APPLICATIONS DENIED 20 $94,274 91 $60,277 316 $83,761 134 $13,898 0 $0 13 $56,928 APPLICATIONS WITHDRAWN 19 $96,531 46 $104,475 235 $93,233 16 $50,060 0 $0 7 $58,714 FILES CLOSED FOR INCOMPLETENESS 2 $118,335 15 $96,851 52 $85,989 2 $25,270 0 $0 1 $36,800
Detailed HMDA statistics for the following Tracts:
0109.01
, 0109.02 , 0109.03 , 0109.04 , 0109.06 , 0109.07 , 0109.08 , 0109.09
Private Mortgage Insurance Companies Aggregated Statistics For Year 2009(Based on 6 full and 2 partial tracts) A) Conventional B) Refinancings Number Average Value Number Average Value
LOANS ORIGINATED 27 $134,167 30 $153,133 APPLICATIONS APPROVED, NOT ACCEPTED 4 $108,702 5 $174,912 APPLICATIONS DENIED 6 $253,053 12 $150,411 APPLICATIONS WITHDRAWN 1 $78,000 7 $110,850 FILES CLOSED FOR INCOMPLETENESS 0 $0 1 $168,310
Aggregated Statistics For Year 2008(Based on 6 full and 2 partial tracts) A) Conventional B) Refinancings C) Non-occupant Loans on Number Average Value Number Average Value Number Average Value
LOANS ORIGINATED 82 $128,467 54 $162,854 10 $94,307 APPLICATIONS APPROVED, NOT ACCEPTED 25 $147,233 24 $151,553 7 $80,931 APPLICATIONS DENIED 7 $147,234 2 $155,180 3 $130,430 APPLICATIONS WITHDRAWN 5 $132,000 4 $164,690 3 $105,587 FILES CLOSED FOR INCOMPLETENESS 2 $115,085 4 $175,012 4 $160,472
Aggregated Statistics For Year 2007(Based on 6 full and 2 partial tracts) A) Conventional B) Refinancings C) Non-occupant Loans on Number Average Value Number Average Value Number Average Value
LOANS ORIGINATED 207 $130,297 56 $145,060 16 $97,349 APPLICATIONS APPROVED, NOT ACCEPTED 35 $147,498 23 $157,490 3 $86,060 APPLICATIONS DENIED 3 $167,230 3 $174,020 3 $174,020 APPLICATIONS WITHDRAWN 5 $269,890 10 $131,794 1 $168,310 FILES CLOSED FOR INCOMPLETENESS 0 $0 0 $0 0 $0
Aggregated Statistics For Year 2006(Based on 6 full and 2 partial tracts) A) Conventional B) Refinancings C) Non-occupant Loans on Number Average Value Number Average Value Number Average Value
LOANS ORIGINATED 141 $129,041 38 $146,714 16 $102,418 APPLICATIONS APPROVED, NOT ACCEPTED 16 $157,388 14 $134,432 5 $88,626 APPLICATIONS DENIED 2 $301,535 0 $0 1 $88,150 APPLICATIONS WITHDRAWN 7 $179,077 7 $141,290 0 $0 FILES CLOSED FOR INCOMPLETENESS 0 $0 2 $247,000 0 $0
Aggregated Statistics For Year 2005(Based on 6 full and 2 partial tracts) A) Conventional B) Refinancings C) Non-occupant Loans on Number Average Value Number Average Value Number Average Value
LOANS ORIGINATED 109 $134,302 63 $140,543 14 $76,388 APPLICATIONS APPROVED, NOT ACCEPTED 17 $134,922 28 $136,856 8 $85,560 APPLICATIONS DENIED 2 $158,705 0 $0 0 $0 APPLICATIONS WITHDRAWN 3 $113,170 9 $143,857 1 $100,510 FILES CLOSED FOR INCOMPLETENESS 0 $0 1 $67,000 1 $67,000
Aggregated Statistics For Year 2004(Based on 6 full and 2 partial tracts) A) Conventional B) Refinancings C) Non-occupant Loans on Number Average Value Number Average Value Number Average Value
LOANS ORIGINATED 142 $125,344 105 $125,406 19 $85,044 APPLICATIONS APPROVED, NOT ACCEPTED 28 $123,714 55 $132,790 3 $81,040 APPLICATIONS DENIED 1 $89,930 1 $133,000 0 $0 APPLICATIONS WITHDRAWN 11 $117,978 14 $122,969 4 $103,270 FILES CLOSED FOR INCOMPLETENESS 2 $169,965 1 $99,740 1 $89,930
Aggregated Statistics For Year 2003(Based on 6 full and 2 partial tracts) A) Conventional B) Refinancings C) Non-occupant Loans on Number Average Value Number Average Value Number Average Value
LOANS ORIGINATED 172 $131,334 268 $130,237 14 $88,391 APPLICATIONS APPROVED, NOT ACCEPTED 22 $118,815 93 $127,478 5 $44,994 APPLICATIONS DENIED 1 $31,000 6 $112,803 0 $0 APPLICATIONS WITHDRAWN 7 $116,349 20 $109,690 1 $64,000 FILES CLOSED FOR INCOMPLETENESS 0 $0 2 $123,500 0 $0
Aggregated Statistics For Year 2002(Based on 6 full and 2 partial tracts) A) Conventional B) Refinancings C) Non-occupant Loans on Number Average Value Number Average Value Number Average Value
LOANS ORIGINATED 188 $112,472 239 $122,205 22 $74,058 APPLICATIONS APPROVED, NOT ACCEPTED 20 $126,841 43 $114,706 0 $0 APPLICATIONS DENIED 4 $119,658 8 $116,819 5 $100,196 APPLICATIONS WITHDRAWN 9 $124,331 22 $111,191 3 $70,310 FILES CLOSED FOR INCOMPLETENESS 1 $40,000 2 $108,040 0 $0
Aggregated Statistics For Year 2001(Based on 6 full and 2 partial tracts) A) Conventional B) Refinancings C) Non-occupant Loans on Number Average Value Number Average Value Number Average Value
LOANS ORIGINATED 189 $110,081 221 $124,348 16 $69,554 APPLICATIONS APPROVED, NOT ACCEPTED 31 $114,931 50 $129,838 3 $70,333 APPLICATIONS DENIED 3 $81,043 2 $144,310 0 $0 APPLICATIONS WITHDRAWN 2 $95,500 11 $113,045 1 $110,000 FILES CLOSED FOR INCOMPLETENESS 1 $105,000 2 $144,000 0 $0
Aggregated Statistics For Year 2000(Based on 6 full and 2 partial tracts) A) Conventional B) Refinancings C) Non-occupant Loans on Number Average Value Number Average Value Number Average Value
LOANS ORIGINATED 179 $116,174 39 $109,463 11 $65,005 APPLICATIONS APPROVED, NOT ACCEPTED 20 $102,555 8 $96,395 1 $82,210 APPLICATIONS DENIED 3 $42,517 4 $136,608 0 $0 APPLICATIONS WITHDRAWN 5 $122,000 2 $116,370 0 $0 FILES CLOSED FOR INCOMPLETENESS 0 $0 0 $0 0 $0
Aggregated Statistics For Year 1999(Based on 6 full and 2 partial tracts) A) Conventional B) Refinancings C) Non-occupant Loans on Number Average Value Number Average Value Number Average Value
LOANS ORIGINATED 208 $110,605 95 $109,650 5 $48,334 APPLICATIONS APPROVED, NOT ACCEPTED 21 $109,855 19 $102,947 2 $47,155 APPLICATIONS DENIED 16 $106,251 3 $87,297 3 $87,173 APPLICATIONS WITHDRAWN 3 $48,047 4 $81,060 1 $58,720 FILES CLOSED FOR INCOMPLETENESS 0 $0 3 $91,477 0 $0
Detailed PMIC statistics for the following Tracts:
0109.01
, 0109.02 , 0109.03 , 0109.04 , 0109.06 , 0109.07 , 0109.08 , 0109.09 Fire-safe hotels and motels in Fairfield, Ohio:
Carriage Inn Motel, 6419 Dixie Hwy, Fairfield, Ohio 45014 Phone: (513) 874-4774
Extended Stay America - Cincinnati - Fairfield, 9651 Seward Rd, Fairfield, Ohio 45014 Phone: (513) 860-5733, Fax: (513) 870-1874
In Town Suites-Cincinnati North, 6785 Fairfield Business Dr, Fairfield, Ohio 45014 Phone: (513) 942-8004, Fax: (513) 942-2347
Value Place Fairfield, 6725 Fairfield Business Dr, Fairfield, Ohio 45014 Phone: (513) 860-1222
All 4 fire-safe hotels and motels in Fairfield, Ohio
Most common first names in Fairfield, OH among deceased individuals Name Count Lived (average)
Mary 224 79.2 years William 180 76.0 years John 171 73.3 years Robert 166 73.3 years James 154 71.8 years Charles 112 74.2 years Helen 102 82.1 years Dorothy 99 79.8 years Ruth 90 80.9 years Margaret 79 80.0 years
Most common last names in Fairfield, OH among deceased individuals Last name Count Lived (average)
Smith 87 73.0 years Johnson 58 74.9 years Jones 44 72.3 years Williams 36 71.4 years Brown 36 76.4 years Wilson 34 72.4 years Davis 31 75.2 years Miller 31 73.6 years Campbell 29 71.7 years Moore 28 73.3 years
Fairfield compared to Ohio state average:
Unemployed percentage significantly below state average. Black race population percentage above state average. Hispanic race population percentage above state average. Foreign-born population percentage significantly above state average. Length of stay since moving in significantly above state average. House age below state average.
Top Patent Applicants
Steven Daryl Smith (53)
Isao Noda (45)
Dana Paul Gruenbacher (41)
Edward A. Rhad (37)
Dean B. Bruewer (35)
Brian Joseph Loughnane (33)
Keith Joseph Stone (29)
Fred Naval Desai (25)
Phillip Kyle Vinson (24)
Larry Neil Mackey (24)
Total of 942 patent applications in 2008-2024.


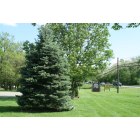


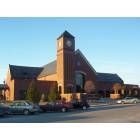
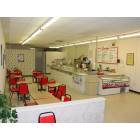


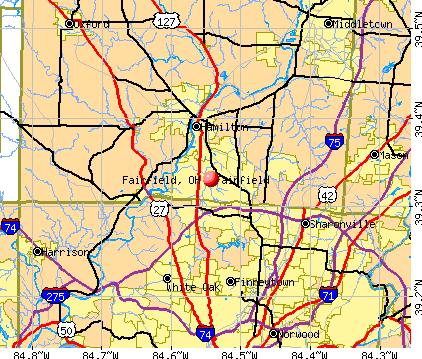


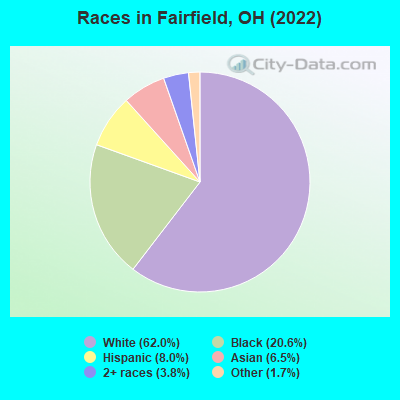
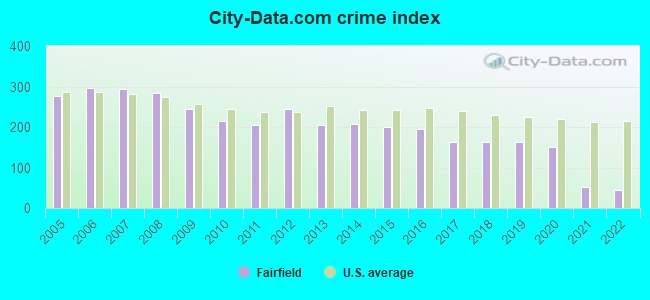
 Recent articles from our blog. Our writers, many of them Ph.D. graduates or candidates, create easy-to-read articles on a wide variety of topics.


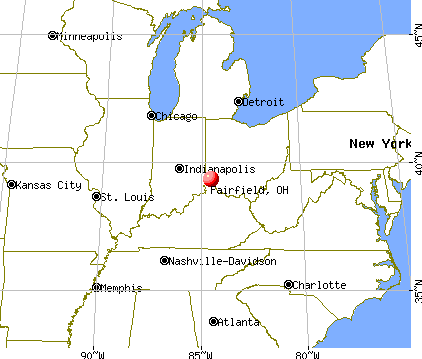
 (4.6 miles
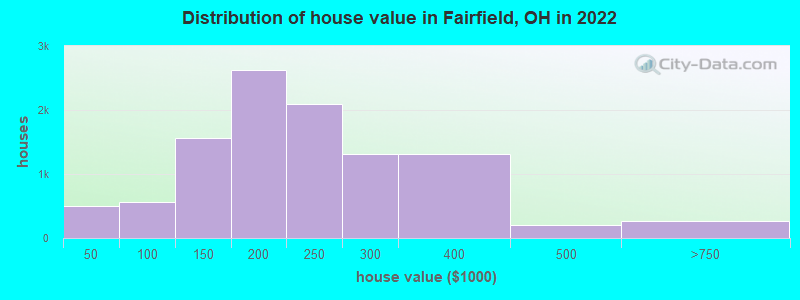
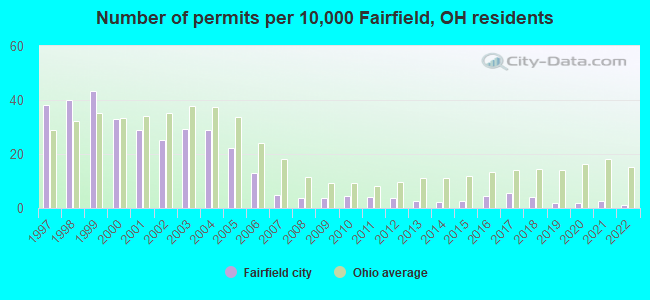
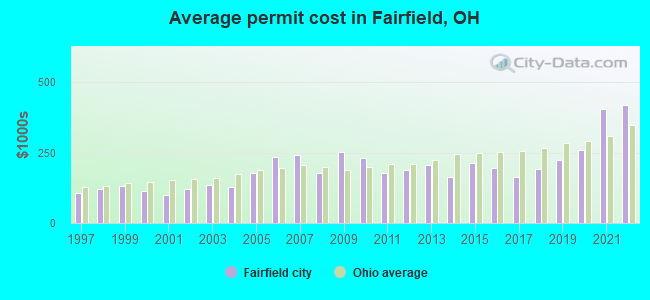
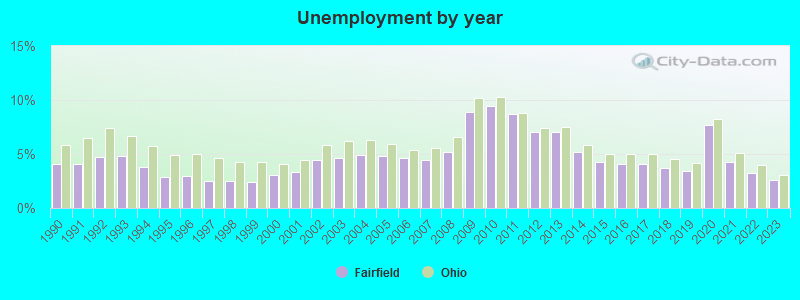

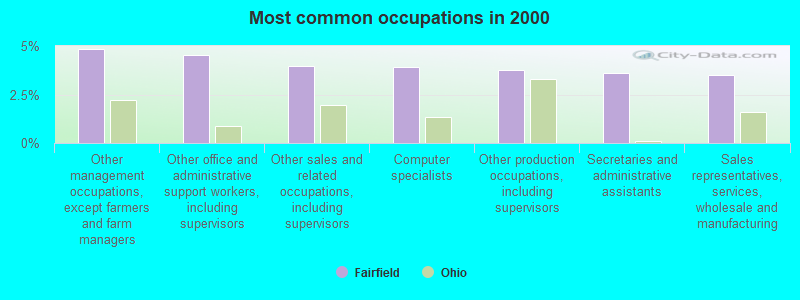
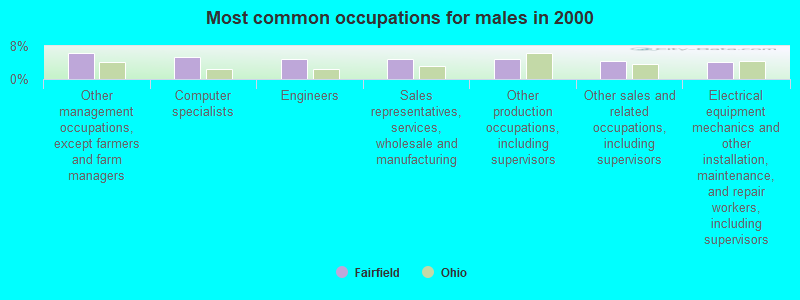
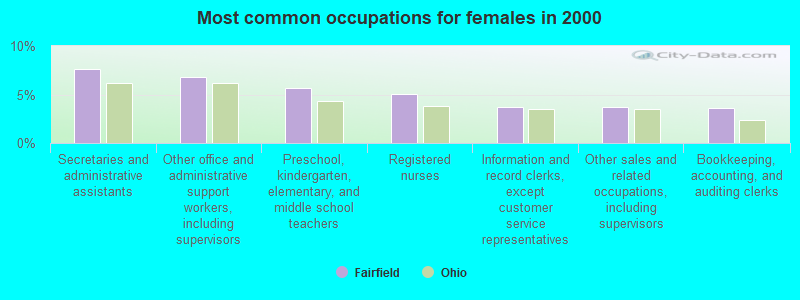
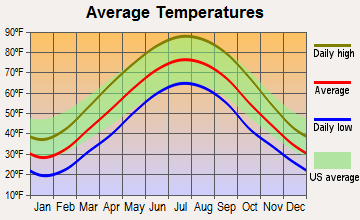
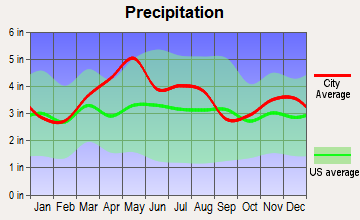
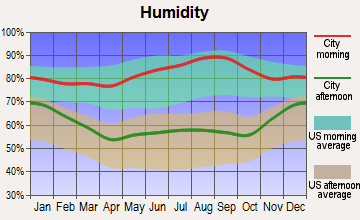
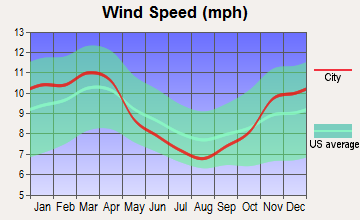
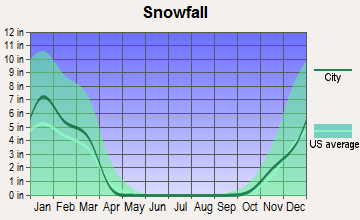
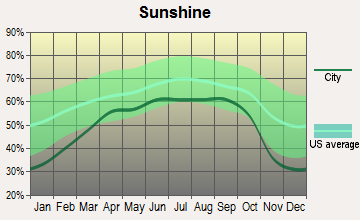
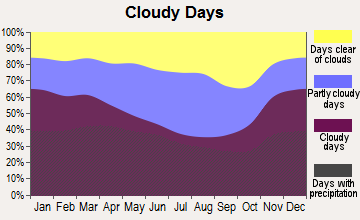
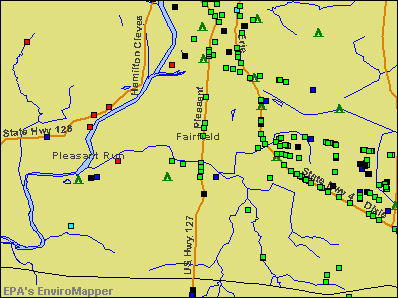

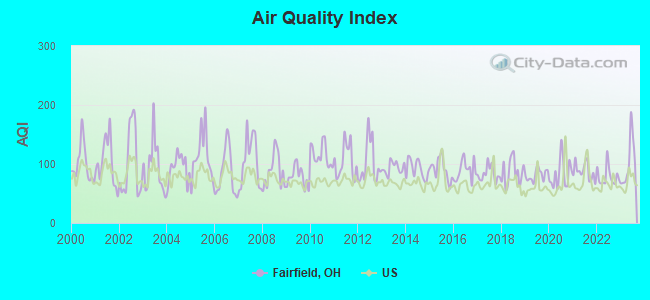
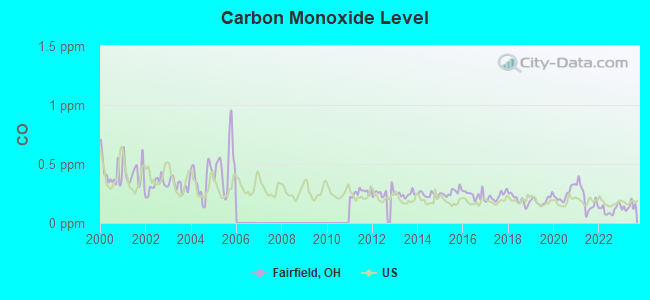
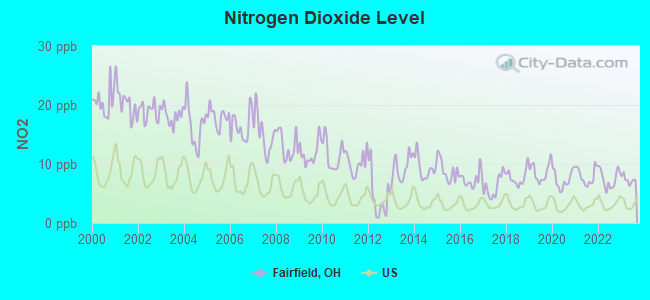
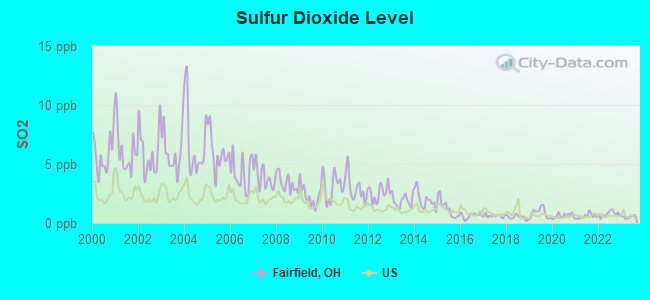
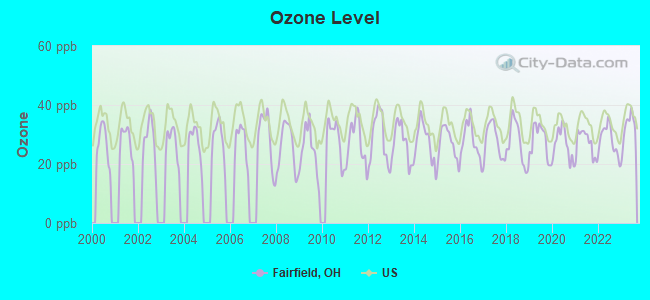
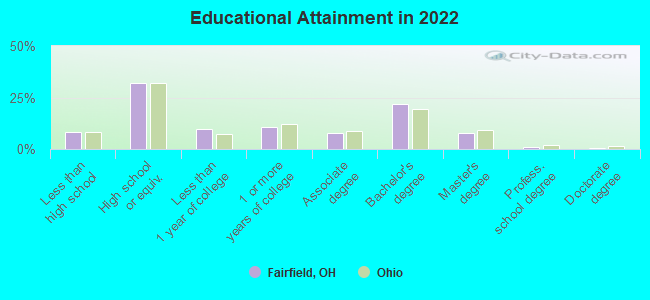
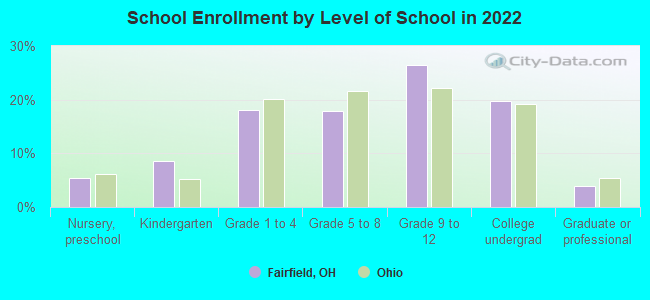
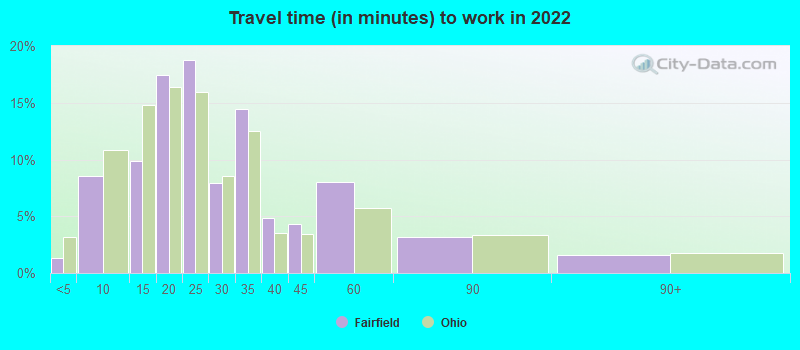
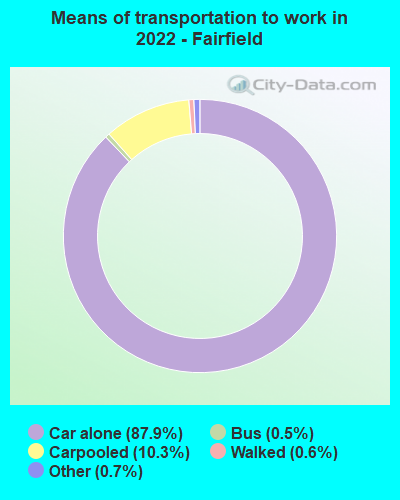
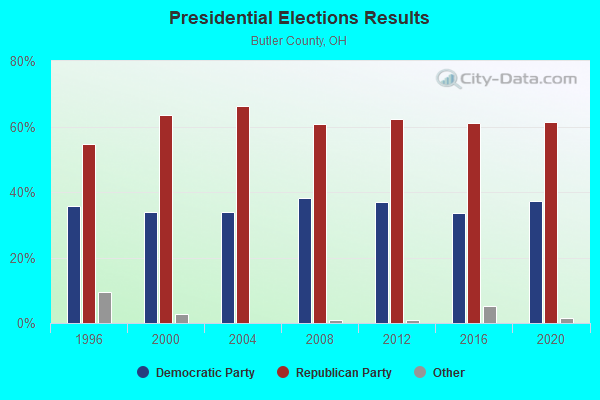
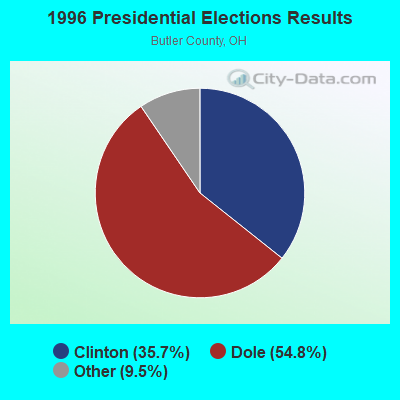
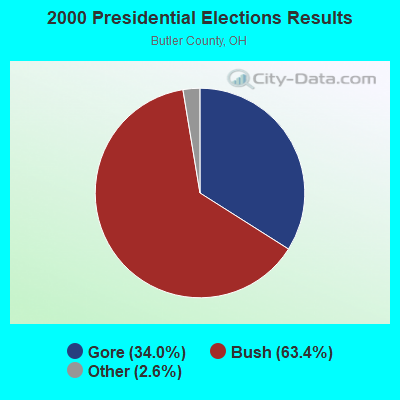
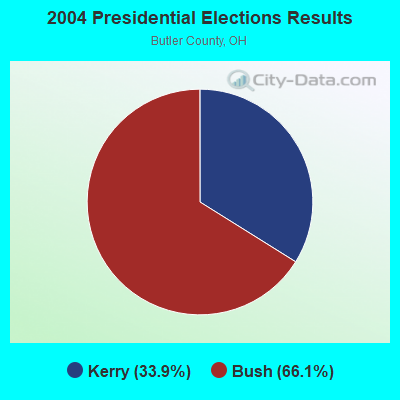
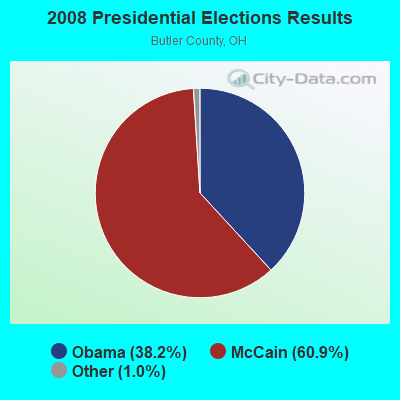
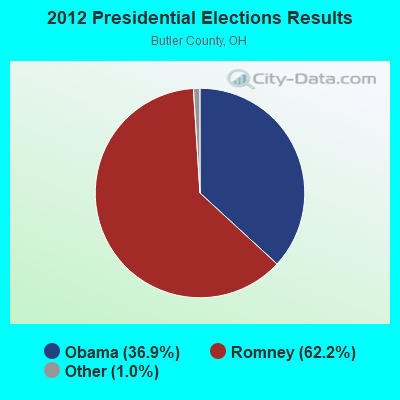
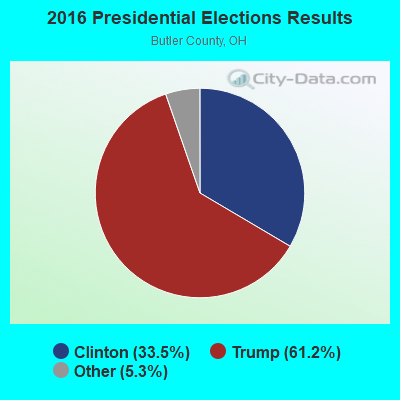
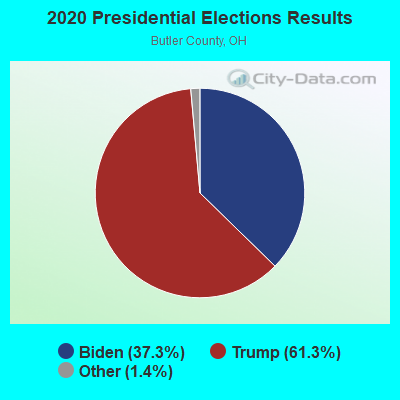
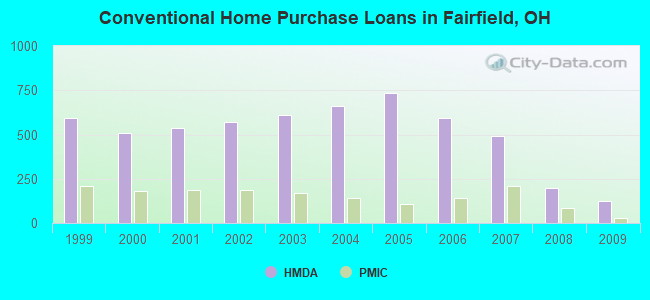
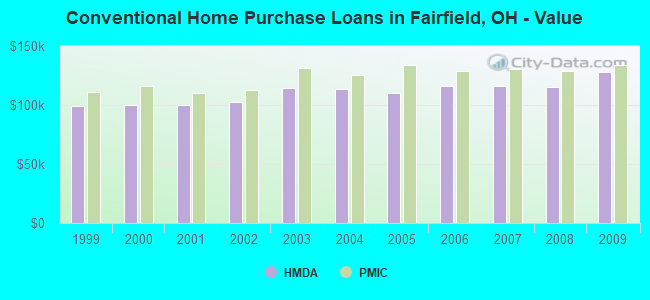
 According to the data from the years 2004 - 2018 the average number of fire incidents per year is 117. The highest number of reported fires - 179 took place in 2008, and the least - 43 in 2013. The data has a decreasing trend.
 When looking into fire subcategories, the most incidents belonged to: Structure Fires (45.0%), and Outside Fires (39.4%).