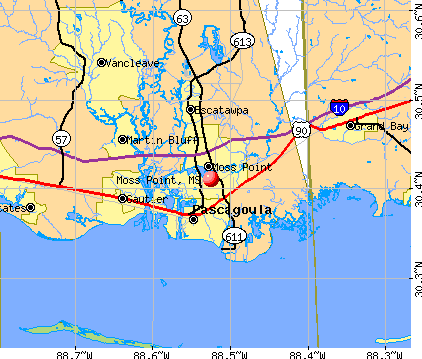
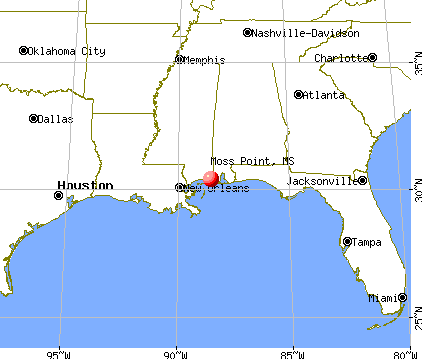
Moss Point, Mississippi
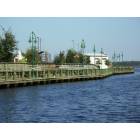
Moss Point: Picture of the Riverfront

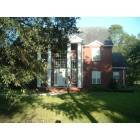
Moss Point: Griffen Street, Moss Point , MS

Moss Point: Sunset on River Road, Moss Point , MS

Moss Point: SUNSET FROM RIVER ROAD
Moss Point: Hurley Community
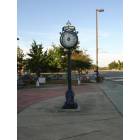
Moss Point: City Clock on Main Street, Moss Point , MS
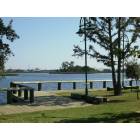
Moss Point: Picture of the Riverfront

Moss Point: Picture of the Riverfront
- add
your


Submit your own pictures of this city and show them to the world
- OSM Map
- General Map
- Google Map
- MSN Map
Population change since 2000: -24.7%
 |
| Males: 5,693 | |
| Females: 6,238 |
| Median resident age: | 43.2 years |
| Mississippi median age: | 38.9 years |
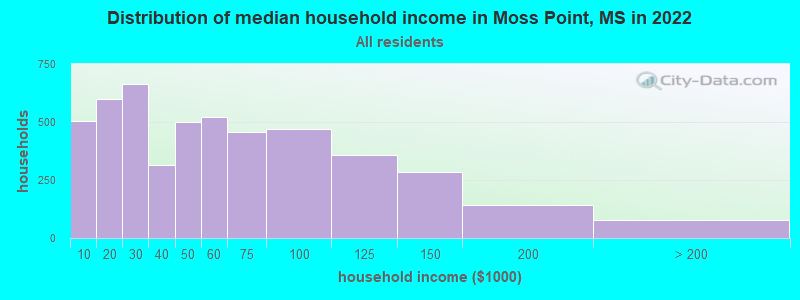
| Moss Point: | $45,466 |
| MS: | $52,719 |
Estimated per capita income in 2022: $24,107 (it was $15,537 in 2000)
Moss Point city income, earnings, and wages data
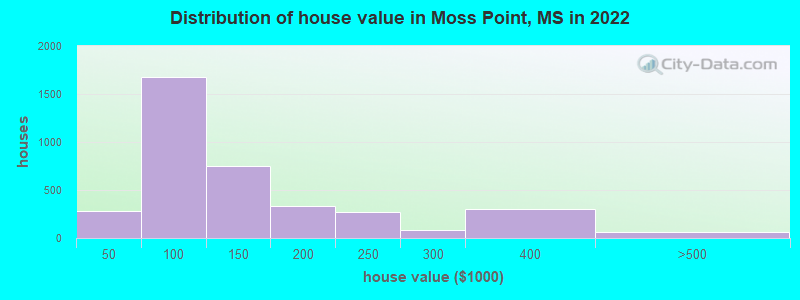
Estimated median house or condo value in 2022: $112,320 (it was $58,400 in 2000)
| Moss Point: | $112,320 |
| MS: | $162,500 |
Mean prices in 2022: all housing units: $259,759; detached houses: $261,166; mobile homes: $100,776
Median gross rent in 2022: $1,072.
(10.7% for White Non-Hispanic residents, 19.5% for Black residents, 48.3% for Hispanic or Latino residents, 31.2% for other race residents, 55.9% for two or more races residents)
Detailed information about poverty and poor residents in Moss Point, MS


Compare current foreclosures in Moss Point, MS:
| Photo | Address | Area | Beds / Baths | Price | Details |
|---|---|---|---|---|---|

|
#1
Fieldworth Rd
Moss Point, MS 39562
|
1,356 sq. feet
|
2 baths 3 beds |
show details | |

|
#2
Second St
Moss Point, MS 39563
|
1,680 sq. feet
|
2 baths - beds |
show details | |

|
#3
Lily Orchard Rd
Moss Point, MS 39562
|
2,016 sq. feet
|
2 baths - beds |
show details | |

|
#4
Forts Lake Rd
Moss Point, MS 39562
|
1,464 sq. feet
|
2 baths - beds |
show details | |

|
#5
Robinway Dr
Moss Point, MS 39563
|
1,846 sq. feet
|
2 baths - beds |
show details | |

|
#6
Leroy St
Moss Point, MS 39563
|
1,196 sq. feet
|
1 baths - beds |
show details | |

|
#7
Linda Cir
Moss Point, MS 39563
|
1,495 sq. feet
|
2 baths - beds |
show details | |

|
#8
Kimberly Dr
Moss Point, MS 39563
|
1,272 sq. feet
|
2 baths - beds |
show details | |

|
#9
Lotus St
Moss Point, MS 39562
|
2,566 sq. feet
|
4 baths - beds |
show details | |

|
#10
Rose Dr
Moss Point, MS 39563
|
1,050 sq. feet
|
2 baths - beds |
show details |
| Photo | Address | Area | Beds / Baths | Price | Details |
|---|---|---|---|---|---|

|
#11
Forts Lake Rd
Moss Point, MS 39562
|
2,051 sq. feet
|
3 baths - beds |
show details | |

|
#12
Campbell St
Moss Point, MS 39563
|
2,119 sq. feet
|
2 baths - beds |
show details | |

|
#13
Terrace Dr
Moss Point, MS 39563
|
1,380 sq. feet
|
2 baths - beds |
show details | |

|
#14
Diamond Ave
Moss Point, MS 39563
|
954 sq. feet
|
1 baths - beds |
show details | |

|
#15
Weems St
Moss Point, MS 39563
|
2,052 sq. feet
|
2 baths - beds |
show details | |

|
#16
Big Point Rd
Moss Point, MS 39562
|
1,048 sq. feet
|
1 baths - beds |
show details | |

|
#17
Max Bryant Rd
Moss Point, MS 39562
|
3,069 sq. feet
|
2 baths - beds |
show details | |

|
#18
Grafe Homestead Rd
Moss Point, MS 39562
|
2,380 sq. feet
|
3 baths - beds |
show details | |

|
#19
Diamond Ave
Moss Point, MS 39563
|
954 sq. feet
|
1 baths - beds |
show details | |

|
#20
Idywood Ave
Moss Point, MS 39562
|
1,441 sq. feet
|
1 baths - beds |
show details |
| Photo | Address | Area | Beds / Baths | Price | Details |
|---|---|---|---|---|---|

|
#21
Shonto St
Moss Point, MS 39562
|
1,797 sq. feet
|
2 baths - beds |
show details | |

|
#22
Inez Cir
Moss Point, MS 39563
|
1,053 sq. feet
|
2 baths - beds |
show details | |

|
#23
Fairhaven Dr
Moss Point, MS 39562
|
1,309 sq. feet
|
2 baths - beds |
show details | |

|
#24
Main St
Moss Point, MS 39563
|
1,134 sq. feet
|
2 baths - beds |
show details | |

|
#25
Stauter St
Moss Point, MS 39563
|
1,802 sq. feet
|
2 baths - beds |
show details | |

|
#26
Timberwolf Dr
Moss Point, MS 39562
|
1,800 sq. feet
|
2 baths - beds |
show details | |

|
#27
Church St
Moss Point, MS 39563
|
3,091 sq. feet
|
2 baths - beds |
show details | |

|
#28
Eastwood Dr
Moss Point, MS 39563
|
1,163 sq. feet
|
2 baths - beds |
show details | |

|
#29
Hilma St
Moss Point, MS 39563
|
1,238 sq. feet
|
1 baths - beds |
show details | |

|
#30
Shonto St
Moss Point, MS 39562
|
2,474 sq. feet
|
3 baths - beds |
show details |
| Photo | Address | Area | Beds / Baths | Price | Details |
|---|---|---|---|---|---|

|
#31
Rollins Ave
Moss Point, MS 39563
|
672 sq. feet
|
1 baths - beds |
show details | |

|
#32
Lawrence St
Moss Point, MS 39563
|
900 sq. feet
|
1 baths - beds |
show details | |

|
#33
Rose Dr
Moss Point, MS 39563
|
1,000 sq. feet
|
2 baths - beds |
show details | |

|
#34
Edgecliff Dr
Moss Point, MS 39562
|
1,375 sq. feet
|
2 baths - beds |
show details | |

|
#35
Kings Rd
Moss Point, MS 39563
|
1,316 sq. feet
|
1 baths - beds |
show details | |

|
#36
Oakwood Park Dr
Moss Point, MS 39562
|
1,221 sq. feet
|
2 baths - beds |
show details | |

|
#37
Knowlcrest Dr
Moss Point, MS 39562
|
1,040 sq. feet
|
2 baths - beds |
show details | |

|
#38
Old Airport Rd
Moss Point, MS 39562
|
- sq. feet
|
- baths - beds |
show details | |

|
#39
Bragg Rd
Moss Point, MS 39562
|
- sq. feet
|
- baths - beds |
show details | |

|
#40
Highway 613
Moss Point, MS 39562
|
- sq. feet
|
- baths - beds |
show details |
| Photo | Address | Area | Beds / Baths | Price | Details |
|---|---|---|---|---|---|

|
#41
Baria Rd
Moss Point, MS 39562
|
- sq. feet
|
- baths - beds |
show details | |

|
#42
Lee Pierce Rd
Moss Point, MS 39562
|
- sq. feet
|
- baths - beds |
show details | |

|
#43
Grafe Homestead Rd
Moss Point, MS 39562
|
- sq. feet
|
- baths - beds |
show details | |

|
#44
Graham Rd
Moss Point, MS 39562
|
- sq. feet
|
- baths - beds |
show details | |

|
#45
James Pierce Rd
Moss Point, MS 39562
|
- sq. feet
|
- baths - beds |
show details | |

|
#46
Shady Ln
Moss Point, MS 39562
|
- sq. feet
|
- baths - beds |
show details | |

|
#47
Griffin St
Moss Point, MS 39563
|
- sq. feet
|
- baths - beds |
show details | |

|
#48
Kinross St
Moss Point, MS 39563
|
- sq. feet
|
- baths - beds |
show details | |

|
#49
Old School Rd
Moss Point, MS 39562
|
- sq. feet
|
- baths - beds |
show details | |

|
Check over 1 million property listings on Foreclosure.com!
|
browse all offers | |||


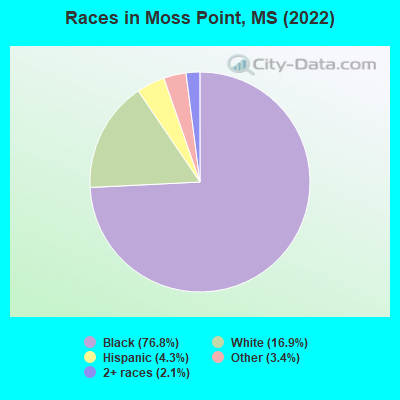
- 9,42676.8%Black alone
- 2,07916.9%White alone
- 5244.3%Hispanic
- 4213.4%Other race alone
- 2522.1%Two or more races
- 40.03%Asian alone
Races in Moss Point detailed stats: ancestries, foreign born residents, place of birth
According to our research of Mississippi and other state lists, there were 97 registered sex offenders living in Moss Point, Mississippi as of April 26, 2024.
The ratio of all residents to sex offenders in Moss Point is 141 to 1.
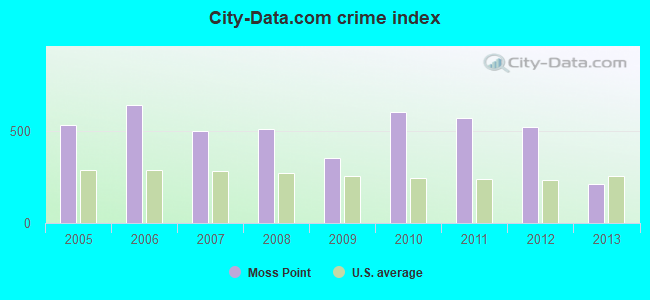
Type |
2009 |
2010 |
2011 |
2012 |
2013 |
|---|---|---|---|---|---|
| Murders (per 100,000) | 1 (7.3) | 0 (0.0) | 0 (0.0) | 0 (0.0) | 0 (0.0) |
| Rapes (per 100,000) | 5 (36.3) | 16 (116.8) | 10 (72.7) | 12 (87.2) | 4 (29.2) |
| Robberies (per 100,000) | 15 (109.0) | 31 (226.2) | 29 (210.8) | 29 (210.8) | 15 (109.6) |
| Assaults (per 100,000) | 83 (603.3) | 71 (518.1) | 142 (1,032) | 63 (458.0) | 13 (95.0) |
| Burglaries (per 100,000) | 212 (1,541) | 411 (2,999) | 265 (1,926) | 314 (2,283) | 193 (1,410) |
| Thefts (per 100,000) | 144 (1,047) | 311 (2,269) | 283 (2,057) | 368 (2,675) | 102 (745.3) |
| Auto thefts (per 100,000) | 13 (94.5) | 70 (510.8) | 48 (348.9) | 54 (392.6) | 18 (131.5) |
| Arson (per 100,000) | 0 (0.0) | 0 (0.0) | 5 (36.3) | 2 (14.5) | 2 (14.6) |
| City-Data.com crime index | 354.3 | 606.5 | 572.9 | 522.8 | 214.3 |
The City-Data.com crime index weighs serious crimes and violent crimes more heavily. Higher means more crime, U.S. average is 246.1. It adjusts for the number of visitors and daily workers commuting into cities.
Crime rate in Moss Point detailed stats: murders, rapes, robberies, assaults, burglaries, thefts, arson
Full-time law enforcement employees in 2021, including police officers: 39 (27 officers - 22 male; 5 female).
| Officers per 1,000 residents here: | 2.05 |
| Mississippi average: | 2.18 |
 Recent articles from our blog. Our writers, many of them Ph.D. graduates or candidates, create easy-to-read articles on a wide variety of topics.


 | Gulfport for seniors (10 replies) |
| Retiring along Gulf Coast (3 replies) |
| Mississippi Coast or South/North of Hammond areas? (2 replies) |
| Where to rent in Biloxi or Ocean Springs...for a 20-something year old male (2 replies) |
| The worst city in Mississippi (95 replies) |
| Life in Coastal Mississippi? (10 replies) |
Latest news from Moss Point, MS collected exclusively by city-data.com from local newspapers, TV, and radio stations
Ancestries: American (3.0%), African (2.2%), Irish (2.1%), English (1.7%), German (1.7%).
Current Local Time: CST time zone
Incorporated on 04/29/1901
Elevation: 22 feet
Land area: 25.0 square miles.
Population density: 477 people per square mile (low).
148 residents are foreign born
| This city: | 1.2% |
| Mississippi: | 2.3% |
Median real estate property taxes paid for housing units with mortgages in 2022: $1,513 (1.2%)
Median real estate property taxes paid for housing units with no mortgage in 2022: $997 (0.9%)
Nearest city with pop. 50,000+: Biloxi, MS  (24.0 miles , pop. 50,644).
Nearest city with pop. 200,000+: New Orleans, LA (96.6 miles , pop. 484,674).
Nearest city with pop. 1,000,000+: Houston, TX (412.8 miles , pop. 1,953,631).
Nearest cities:
), ), ), Latitude: 30.41 N, Longitude: 88.53 W
Daytime population change due to commuting: -2,097 (-17.1%)
Workers who live and work in this city: 828 (16.6%)
Area code: 228
Moss Point, Mississippi accommodation & food services, waste management - Economy and Business Data
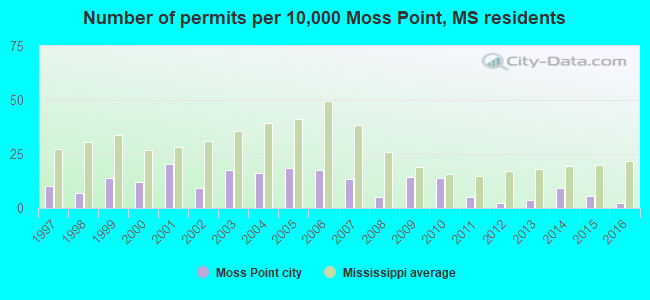
Single-family new house construction building permits:
- 2016: 4 buildings, average cost: $185,500
- 2015: 9 buildings, average cost: $83,600
- 2014: 15 buildings, average cost: $67,800
- 2013: 6 buildings, average cost: $130,300
- 2012: 4 buildings, average cost: $125,100
- 2011: 8 buildings, average cost: $115,700
- 2010: 22 buildings, average cost: $109,000
- 2009: 23 buildings, average cost: $174,000
- 2008: 8 buildings, average cost: $124,800
- 2007: 21 buildings, average cost: $120,100
- 2006: 28 buildings, average cost: $120,100
- 2005: 29 buildings, average cost: $120,100
- 2004: 26 buildings, average cost: $120,100
- 2003: 28 buildings, average cost: $99,400
- 2002: 15 buildings, average cost: $89,300
- 2001: 32 buildings, average cost: $82,500
- 2000: 19 buildings, average cost: $72,700
- 1999: 22 buildings, average cost: $76,600
- 1998: 11 buildings, average cost: $69,800
- 1997: 16 buildings, average cost: $78,900
| Here: | 2.9% |
| Mississippi: | 2.6% |
- Transportation equipment (22.0%)
- Health care (9.7%)
- Educational services (8.4%)
- Accommodation & food services (7.3%)
- Public administration (6.9%)
- Construction (4.4%)
- Arts, entertainment, recreation (4.3%)
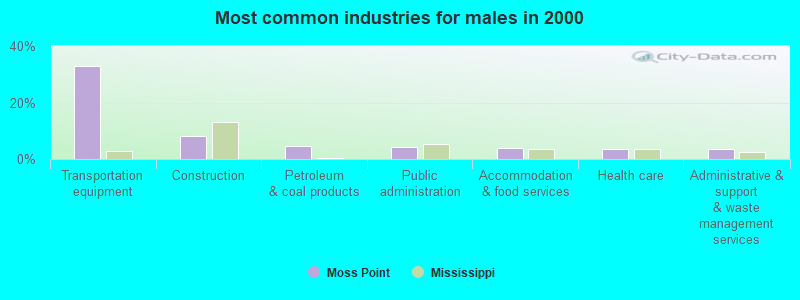
- Transportation equipment (33.1%)
- Construction (8.3%)
- Petroleum & coal products (4.7%)
- Public administration (4.4%)
- Accommodation & food services (3.8%)
- Health care (3.6%)
- Administrative & support & waste management services (3.5%)
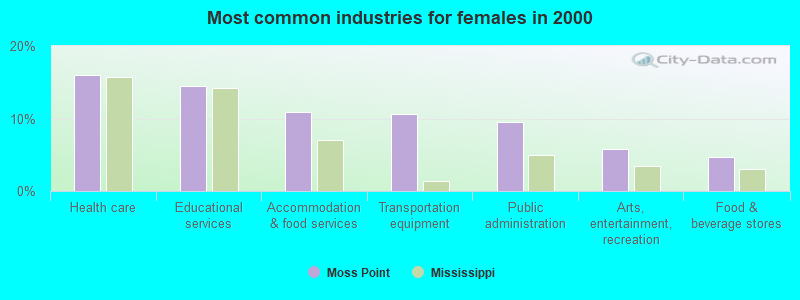
- Health care (16.0%)
- Educational services (14.5%)
- Accommodation & food services (10.9%)
- Transportation equipment (10.6%)
- Public administration (9.5%)
- Arts, entertainment, recreation (5.8%)
- Food & beverage stores (4.6%)
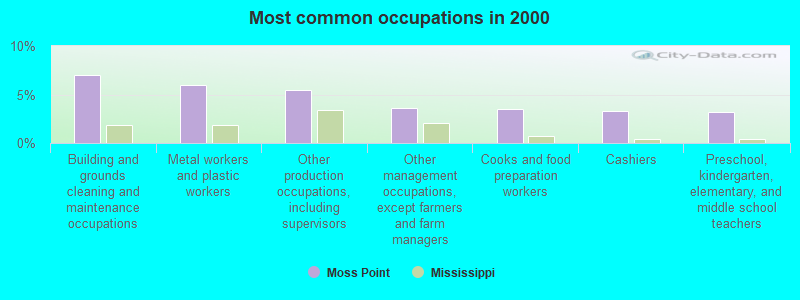
- Building and grounds cleaning and maintenance occupations (7.0%)
- Metal workers and plastic workers (6.0%)
- Other production occupations, including supervisors (5.5%)
- Other management occupations, except farmers and farm managers (3.6%)
- Cooks and food preparation workers (3.5%)
- Cashiers (3.3%)
- Preschool, kindergarten, elementary, and middle school teachers (3.2%)
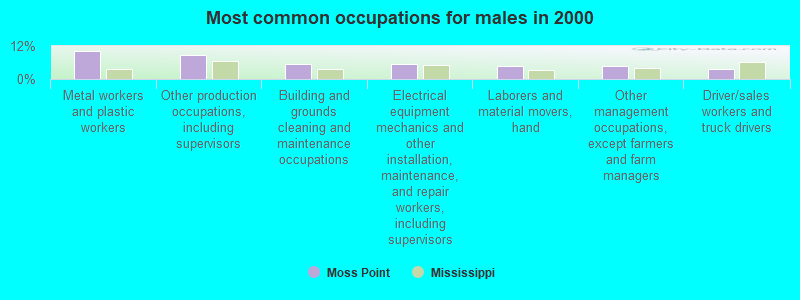
- Metal workers and plastic workers (10.1%)
- Other production occupations, including supervisors (8.8%)
- Building and grounds cleaning and maintenance occupations (5.6%)
- Electrical equipment mechanics and other installation, maintenance, and repair workers, including supervisors (5.4%)
- Laborers and material movers, hand (4.7%)
- Other management occupations, except farmers and farm managers (4.6%)
- Driver/sales workers and truck drivers (3.6%)
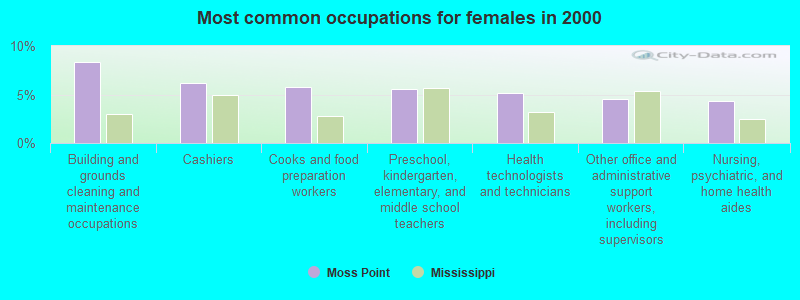
- Building and grounds cleaning and maintenance occupations (8.4%)
- Cashiers (6.2%)
- Cooks and food preparation workers (5.8%)
- Preschool, kindergarten, elementary, and middle school teachers (5.5%)
- Health technologists and technicians (5.2%)
- Other office and administrative support workers, including supervisors (4.5%)
- Nursing, psychiatric, and home health aides (4.3%)
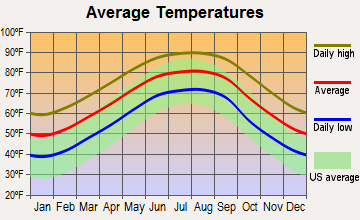
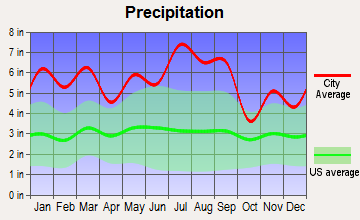
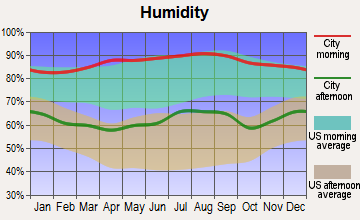
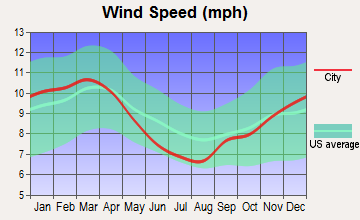
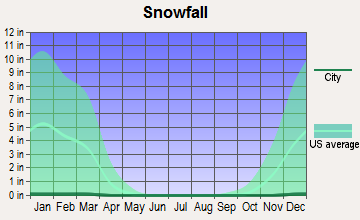
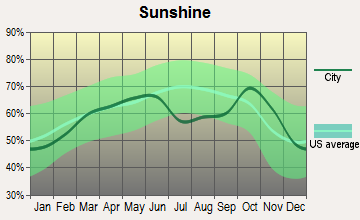
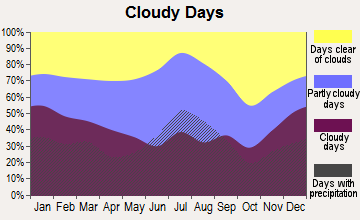
Average climate in Moss Point, Mississippi
Based on data reported by over 4,000 weather stations
|
|


(lower is better)
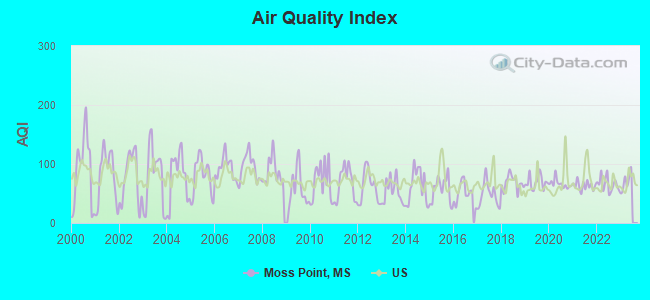
Air Quality Index (AQI) level in 2022 was 65.6. This is about average.
| City: | 65.6 |
| U.S.: | 72.6 |
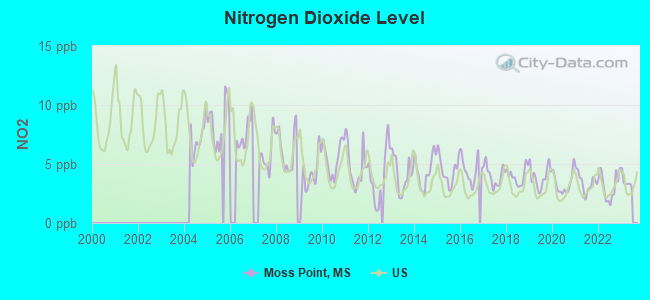
Nitrogen Dioxide (NO2) [ppb] level in 2022 was 3.13. This is significantly better than average. Closest monitor was 2.3 miles away from the city center.
| City: | 3.13 |
| U.S.: | 5.11 |
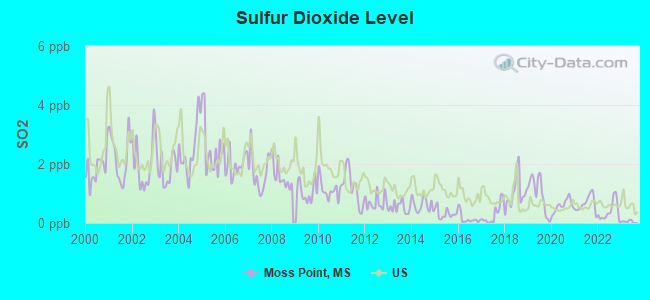
Sulfur Dioxide (SO2) [ppb] level in 2022 was 0.397. This is significantly better than average. Closest monitor was 0.8 miles away from the city center.
| City: | 0.397 |
| U.S.: | 1.515 |
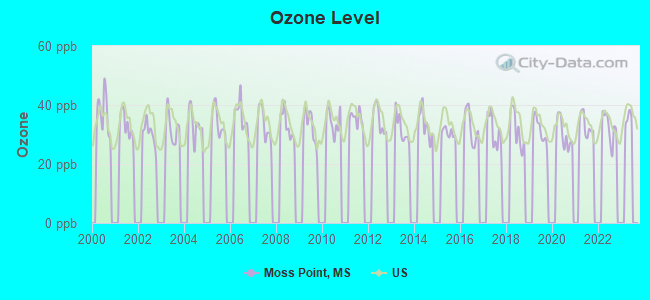
Ozone [ppb] level in 2022 was 32.5. This is about average. Closest monitor was 0.8 miles away from the city center.
| City: | 32.5 |
| U.S.: | 33.3 |
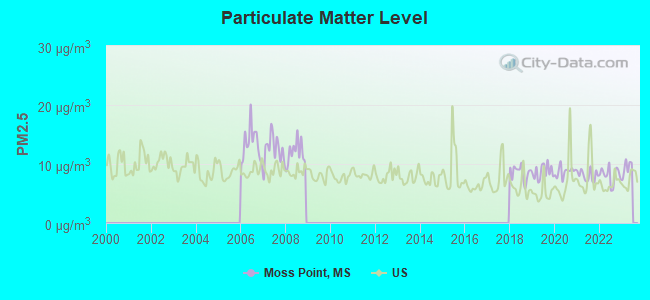
Particulate Matter (PM2.5) [µg/m3] level in 2022 was 8.12. This is about average. Closest monitor was 2.3 miles away from the city center.
| City: | 8.12 |
| U.S.: | 8.11 |
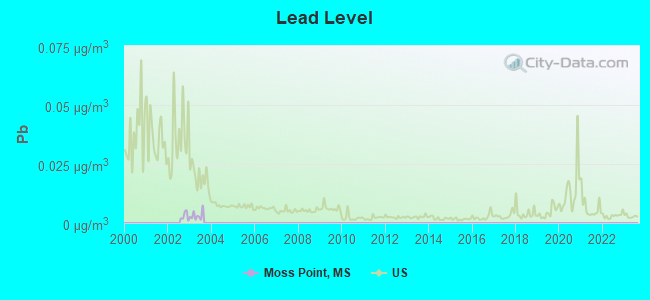
Lead (Pb) [µg/m3] level in 2003 was 0.00318. This is significantly better than average. Closest monitor was 17.2 miles away from the city center.
| City: | 0.00318 |
| U.S.: | 0.00931 |
Tornado activity:
Moss Point-area historical tornado activity is below Mississippi state average. It is 16% greater than the overall U.S. average.
On 4/13/1980, a category F3 (max. wind speeds 158-206 mph) tornado 22.0 miles away from the Moss Point city center injured 25 people and caused between $5,000,000 and $50,000,000 in damages.
On 4/25/1982, a category F3 tornado 26.1 miles away from the city center caused between $50,000 and $500,000 in damages.
Earthquake activity:
Moss Point-area historical earthquake activity is significantly above Mississippi state average. It is 58% smaller than the overall U.S. average.On 10/24/1997 at 08:35:17, a magnitude 4.9 (4.8 MB, 4.2 MS, 4.9 LG, Depth: 6.2 mi, Class: Light, Intensity: IV - V) earthquake occurred 89.3 miles away from Moss Point center
On 9/10/2006 at 14:56:08, a magnitude 5.9 (5.9 MB, 5.5 MS, 5.8 MW, Class: Moderate, Intensity: VI - VII) earthquake occurred 310.1 miles away from Moss Point center
On 5/6/2018 at 16:47:09, a magnitude 4.6 (4.6 MB, Depth: 6.2 mi) earthquake occurred 175.9 miles away from Moss Point center
On 1/18/1999 at 07:00:53, a magnitude 4.8 (4.8 MB, 4.0 LG, Depth: 0.6 mi) earthquake occurred 220.1 miles away from Moss Point center
On 11/7/2004 at 11:20:21, a magnitude 4.3 (4.3 MW, Depth: 3.1 mi) earthquake occurred 158.7 miles away from Moss Point center
On 9/3/2020 at 15:07:53, a magnitude 3.8 (3.8 MW, Depth: 2.5 mi, Class: Light, Intensity: II - III) earthquake occurred 89.8 miles away from the city center
Magnitude types: regional Lg-wave magnitude (LG), body-wave magnitude (MB), surface-wave magnitude (MS), moment magnitude (MW)
Natural disasters:
The number of natural disasters in Jackson County (25) is a lot greater than the US average (15).Major Disasters (Presidential) Declared: 18
Emergencies Declared: 5
Causes of natural disasters: Hurricanes: 15, Floods: 5, Storms: 4, Tornadoes: 4, Tropical Storms: 3, Drought: 1, Freeze: 1, Heavy Rain: 1, Mudslide: 1, Other: 1 (Note: some incidents may be assigned to more than one category).

Hospitals and medical centers in Moss Point:
Airports located in Moss Point:
- Trent Lott International Airport (PQL) (Runways: 1, Air Taxi Ops: 5,079, Itinerant Ops: 18,483, Local Ops: 26,685, Military Ops: 1,966)
Colleges/universities with over 2000 students nearest to Moss Point:
- University of South Alabama (about 29 miles; Mobile, AL; Full-time enrollment: 13,228)
- Bishop State Community College (about 35 miles; Mobile, AL; FT enrollment: 2,822)
- Mississippi Gulf Coast Community College (about 45 miles; Perkinston, MS; FT enrollment: 8,320)
- Columbia Southern University (about 53 miles; Orange Beach, AL; FT enrollment: 14,996)
- James H Faulkner State Community College (about 54 miles; Bay Minette, AL; FT enrollment: 3,703)
- Pearl River Community College (about 68 miles; Poplarville, MS; FT enrollment: 3,074)
- William Carey University (about 77 miles; Hattiesburg, MS; FT enrollment: 3,510)
Public high schools in Moss Point:
- EAST CENTRAL HIGH SCHOOL (Location: 21700 SLIDER RD., Grades: 9-12)
- MOSS POINT ALTERNATIVE SCHOOL (Location: 3524 PRENTISS AVE., Grades: KG-12)
- MOSS POINT HIGH SCHOOL (Location: 4913 WEEMS STREET, Grades: 9-12)
- MOSS POINT CAREER & TECHNICAL EDUCA (Location: 4924 CHURCH STREET, Grades: 9-12)
Public elementary/middle schools in Moss Point:
- EAST CENTRAL MIDDLE SCHOOL (Location: 5404 HURLEY-WADE RD., Grades: 6-8)
- EAST CENTRAL LOWER ELEMENTARY (Location: 5621 HWY 614, Grades: PK-2)
- EAST CENTRAL UPPER ELEMENTARY (Location: 5400 HURLEY-WADE RD., Grades: 3-5)
- MOSS POINT ESCATAWPA UPPER ELEM (Location: 4208 JAMESTOWN ROAD, Grades: 3-5)
- MOSS POINT KREOLE PRIMARY SCHOOL (Location: 6312 MARTIN LUTHER KING DRIVE, Grades: KG-2)
- MAGNOLIA MIDDLE SCHOOL (Location: 4630 MAGNOLIA ST., Grades: 6-8)
Private elementary/middle school in Moss Point:
Points of interest:
Notable locations in Moss Point: Interstate 10 Boat Ramp (A), Moss Point Boat Launch (B), Highway 63 Boat Ramp (C), Mac's Fishing Camp (D), Moss Point City Library (E), Moss Point City Hall (F), Magnolia Community Center (G), Moss Point Fire Department North Station (H), Moss Point Fire Department Central Station (I), Moss Point Fire Investigator (J), Moss Point Auxiliary Police (K), Moss Point Police Department (L), Singing River Rehabilitation and Nursing Center (M), River Front Community Center (N), Moss Point Municipal Building (O), Moss Point Fire Department Rueben Morris Station (P), Moss Point Fire Department Kreole Station (Q). Display/hide their locations on the map
Shopping Centers: Belview Shopping Center (1), Oak Center Shopping Center (2), Southgate Shopping Center (3). Display/hide their locations on the map
Churches in Moss Point include: Zion Methodist Church (A), Olivet Baptist Church (B), Trinity Bible Church (C), Summerville United Methodist Church (D), Shiloh Baptist Church (E), Second Missionary Baptist Church (F), Saint Paul United Methodist Church (G), Saint Josephs Catholic Church (H), Pineview Church (I). Display/hide their locations on the map
Cemeteries: First Baptist Cemetery (1), Evergreen Memorial Gardens (2), Saint Paul Cemetery (3), Griffin Cemetery (4), Zion Cemetery (5). Display/hide their locations on the map
Lakes: Beardslee Lake (A), O'Leary Lake (B), Lake Catch-em-all (C), Bounds Lake (D), McInnis Lake (E), Robertson Lake (F). Display/hide their locations on the map
Streams, rivers, and creeks: Black Creek (A), Dutch Bayou (B), Brickyard Bayou (C), Escatawpa River (D). Display/hide their locations on the map
Parks in Moss Point include: Moss Point Recreation Center (1), Bellview Park (2), Rames Khayat Memorial Park (3), Sue Ellen Street Park (4), Frederick Street Park (5), Jackson County Ski Area (6). Display/hide their locations on the map
Tourist attractions: Presley W L (Arcades & Amusements; 10523 Goodes Mill Lake Road) (1), Gulf Coast Alligator Farm & Airboat Ride (Recreational Trips & Guides; 10300 East Highway 90) (2), Alligator Farm (Tours & Charters; 10300 Highway 90) (3). Display/hide their approximate locations on the map
Hotels: Comfort Inn (6801 Highway 63) (1), Holiday Inn Express (4800 Amoco Drive) (2), Chattery Lounge (6007 Highway 90) (3), Ramada Limited (6292 Highway 63) (4), Shular Inn (6623 Highway 63) (5), Ramada Limited And Suites Moss Point (6292 Highway 63) (6), Four Seasons Produce (4507 Main Street) (7), Pascagoula-Days Inn Moss Point (I-10 Ex Highway 63 Moss Point Highway 63 S) (8), Comfort Inn Moss Point (6801 Sr 63 North) (9). Display/hide their approximate locations on the map
Birthplace of: Jason Armstead - Football player, Jack Jackson (American football) - College football player, John Brock (CEO) - Chairman and Chief Executive Officer of Coca-Cola Enterprises, Sam Leslie - Baseball player, Damarius Bilbo - Football player, Don Hultz - Football player, Alcender Jackson - Football offensive guard, Cavin Payton - College basketball player (SE Louisiana Lions), Ed Khayat - Football player, Frank Molden - Football player.
Drinking water stations with addresses in Moss Point and their reported violations in the past:
CITY OF MOSS POINT (Population served: 20,000, Groundwater):Past health violations:Past monitoring violations:
- MCL, Monthly (TCR) - In APR-2012, Contaminant: Coliform. Follow-up actions: St Public Notif requested (MAY-07-2012), St Formal NOV issued (MAY-07-2012), St Compliance achieved (MAY-21-2012), St Public Notif received (JUN-12-2012)
- Follow-up Or Routine LCR Tap M/R - In JAN-01-2012, Contaminant: Lead and Copper Rule. Follow-up actions: St Compliance achieved (FEB-21-2012), St Public Notif requested (MAY-07-2012), St Formal NOV issued (MAY-07-2012), St Public Notif received (JUL-23-2012)
- Monitoring and Reporting (DBP) - Between APR-2008 and JUN-2008, Contaminant: Chlorine. Follow-up actions: St Compliance achieved (SEP-30-2008), St Formal NOV issued (FEB-05-2009), St Public Notif received (JUN-29-2009)
- Monitoring and Reporting (DBP) - Between JUL-2007 and SEP-2007, Contaminant: Chlorine. Follow-up actions: St Compliance achieved (DEC-31-2007), St Formal NOV issued (FEB-05-2009), St Public Notif received (JUN-29-2009)
- Monitoring and Reporting (DBP) - Between OCT-2005 and DEC-2005, Contaminant: Chlorine. Follow-up actions: St Compliance achieved (MAR-31-2006), St Formal NOV issued (JAN-29-2009), St Public Notif requested (MAR-01-2009), St Public Notif received (JUN-29-2009)
- One routine major monitoring violation
- One minor monitoring violation
- 123 regular monitoring violations
Drinking water stations with addresses in Moss Point that have no violations reported:
- PRESLEY'S OUTING (Population served: 112, Primary Water Source Type: Groundwater)
| This city: | 2.5 people |
| Mississippi: | 2.6 people |
| This city: | 68.7% |
| Whole state: | 69.0% |
| This city: | 5.7% |
| Whole state: | 5.7% |
Likely homosexual households (counted as self-reported same-sex unmarried-partner households)
- Lesbian couples: 0.2% of all households
- Gay men: 0.3% of all households
6 people in group homes intended for adults in 2010
126 people in nursing homes in 2000
16 people in local jails and other confinement facilities (including police lockups) in 2000
Banks with branches in Moss Point (2011 data):
- Merchants & Marine Bank: Escatawpa Branch, Moss Point Branch - Main Street, Hurley Branch. Info updated 2012/01/05: Bank assets: $556.1 mil, Deposits: $476.8 mil, headquarters in Pascagoula, MS, positive income, Commercial Lending Specialization, 13 total offices, Holding Company: Merchants & Marine Bancorp, Inc.
- Hancock Bank: Moss Point Main Branch at 5025 Main Street, branch established on 1907/03/14. Info updated 2011/06/14: Bank assets: $4,988.4 mil, Deposits: $4,121.5 mil, headquarters in Gulfport, MS, positive income, Commercial Lending Specialization, 81 total offices, Holding Company: Hancock Holding Company
- First Federal Savings and Loan Association: 4201 Bellview Branch at 4201 Bellview, branch established on 1955/10/28. Info updated 2011/07/21: Bank assets: $268.0 mil, Deposits: $176.7 mil, headquarters in Pascagoula, MS, positive income, Mortgage Lending Specialization, 6 total offices
For population 15 years and over in Moss Point:
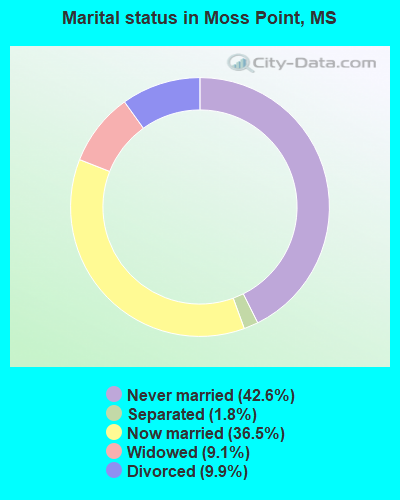
- Never married: 42.6%
- Now married: 36.5%
- Separated: 1.8%
- Widowed: 9.1%
- Divorced: 9.9%
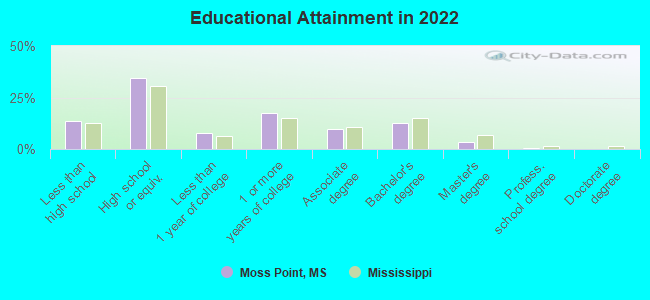
For population 25 years and over in Moss Point:
- High school or higher: 87.6%
- Bachelor's degree or higher: 15.4%
- Graduate or professional degree: 3.8%
- Unemployed: 9.9%
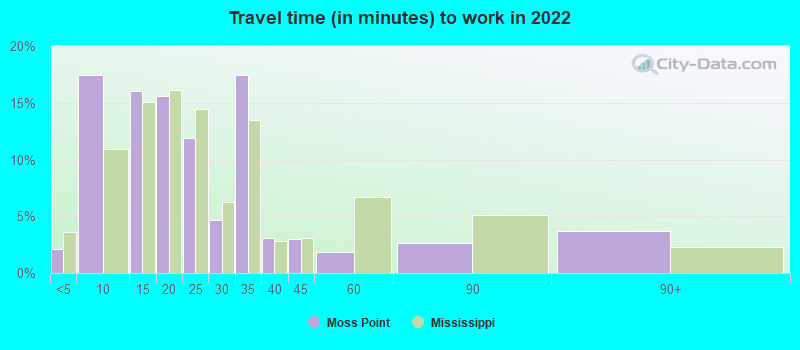
- Mean travel time to work (commute): 19.7 minutes
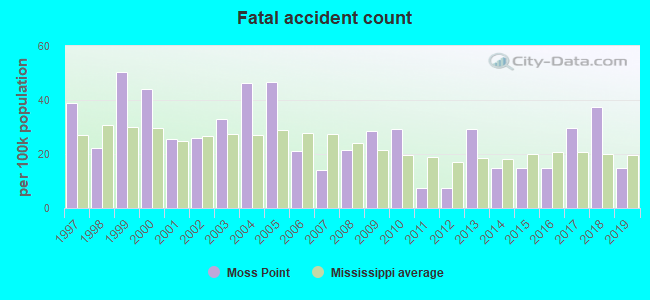
| Here: | 14.3 |
| Mississippi average: | 11.8 |
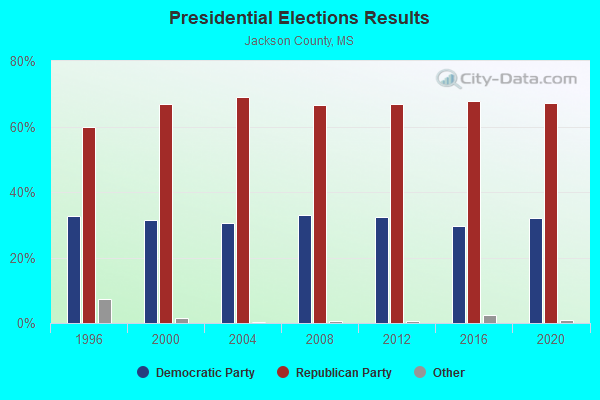
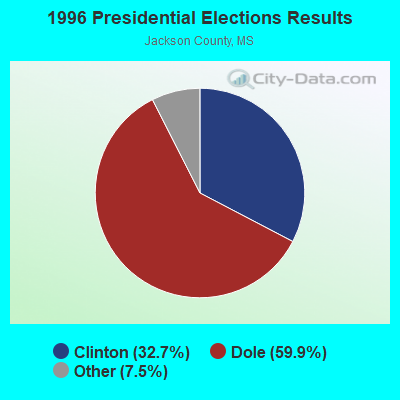


Graphs represent county-level data. Detailed 2008 Election Results
Religion statistics for Moss Point, MS (based on Jackson County data)
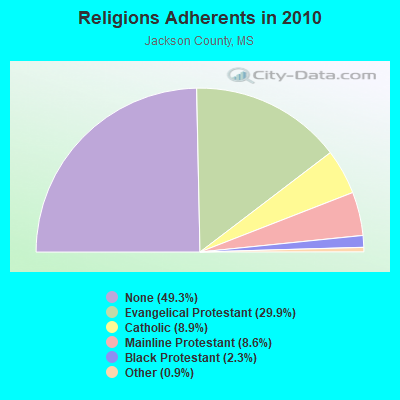
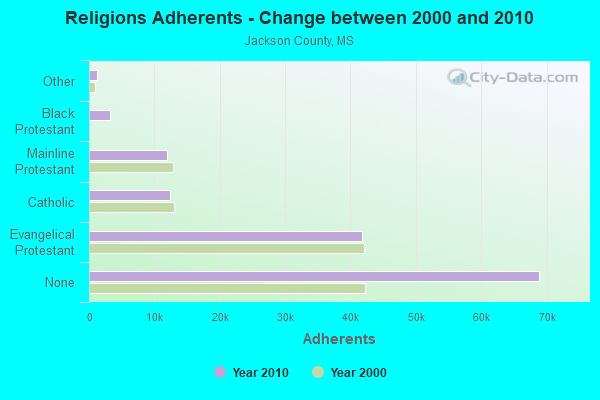
| Religion | Adherents | Congregations |
|---|---|---|
| Evangelical Protestant | 41,796 | 127 |
| Catholic | 12,438 | 11 |
| Mainline Protestant | 11,996 | 35 |
| Black Protestant | 3,273 | 13 |
| Other | 1,254 | 9 |
| None | 68,911 | - |
Food Environment Statistics:
| Jackson County: | 1.69 / 10,000 pop. |
| State: | 2.08 / 10,000 pop. |
| Here: | 0.15 / 10,000 pop. |
| Mississippi: | 0.24 / 10,000 pop. |
| Jackson County: | 0.46 / 10,000 pop. |
| State: | 0.80 / 10,000 pop. |
| Here: | 5.15 / 10,000 pop. |
| Mississippi: | 6.36 / 10,000 pop. |
| Jackson County: | 6.22 / 10,000 pop. |
| Mississippi: | 5.03 / 10,000 pop. |
| This county: | 12.1% |
| Mississippi: | 12.3% |
| Jackson County: | 31.7% |
| State: | 33.1% |
| Jackson County: | 11.9% |
| Mississippi: | 14.4% |
Health and Nutrition:
| This city: | 48.3% |
| State: | 48.6% |
| Moss Point: | 45.3% |
| Mississippi: | 45.3% |
| Moss Point: | 30.1 |
| Mississippi: | 29.2 |
| This city: | 18.4% |
| Mississippi: | 20.5% |
| Here: | 13.5% |
| Mississippi: | 11.6% |
| Moss Point: | 6.6 |
| Mississippi: | 6.7 |
| Moss Point: | 36.8% |
| Mississippi: | 34.8% |
| This city: | 54.1% |
| Mississippi: | 54.9% |
| Moss Point: | 81.4% |
| Mississippi: | 79.9% |
More about Health and Nutrition of Moss Point, MS Residents
| Local government employment and payroll (March 2022) | |||||
| Function | Full-time employees | Monthly full-time payroll | Average yearly full-time wage | Part-time employees | Monthly part-time payroll |
|---|---|---|---|---|---|
| Police Protection - Officers | 18 | $137,602 | $91,735 | 4 | $4,860 |
| Firefighters | 18 | $171,873 | $114,582 | 5 | $1,815 |
| Police - Other | 15 | $52,243 | $41,794 | 2 | $2,766 |
| Other Government Administration | 12 | $13,762 | $13,762 | 0 | $0 |
| Judicial and Legal | 5 | $14,175 | $34,020 | 0 | $0 |
| Other and Unallocable | 3 | $10,704 | $42,816 | 0 | $0 |
| Fire - Other | 2 | $2,924 | $17,544 | 0 | $0 |
| Financial Administration | 2 | $7,106 | $42,636 | 0 | $0 |
| Housing and Community Development (Local) | 1 | $3,913 | $46,956 | 0 | $0 |
| Health | 1 | $3,612 | $43,344 | 0 | $0 |
| Parks and Recreation | 1 | $3,539 | $42,468 | 0 | $0 |
| Totals for Government | 78 | $421,453 | $64,839 | 11 | $9,441 |
Moss Point government finances - Expenditure in 2021 (per resident):
- Construction - Sewerage: $1,591,000 ($133.35)
Solid Waste Management: $1,217,000 ($102.00)
- Current Operations - Water Utilities: $3,606,000 ($302.24)
Police Protection: $2,404,000 ($201.49)
Central Staff Services: $2,029,000 ($170.06)
Local Fire Protection: $1,932,000 ($161.93)
General Public Buildings: $1,561,000 ($130.84)
Solid Waste Management: $999,000 ($83.73)
Gas Utilities: $989,000 ($82.89)
Sewerage: $539,000 ($45.18)
General - Other: $374,000 ($31.35)
Regular Highways: $320,000 ($26.82)
Parks and Recreation: $191,000 ($16.01)
Judicial and Legal Services: $178,000 ($14.92)
Financial Administration: $177,000 ($14.84)
Protective Inspection and Regulation - Other: $154,000 ($12.91)
Housing and Community Development: $150,000 ($12.57)
Libraries: $85,000 ($7.12)
- General - Interest on Debt: $366,000 ($30.68)
- Intergovernmental to Local - Other - Sewerage: $3,371,000 ($282.54)
- Other Capital Outlay - Local Fire Protection: $45,000 ($3.77)
- Total Salaries and Wages: $3,597,000 ($301.48)
- Water Utilities - Interest on Debt: $205,000 ($17.18)
Moss Point government finances - Revenue in 2021 (per resident):
- Charges - Sewerage: $4,744,000 ($397.62)
Solid Waste Management: $1,076,000 ($90.19)
Other: $411,000 ($34.45)
Parks and Recreation: $16,000 ($1.34)
- Federal Intergovernmental - Other: $70,000 ($5.87)
- Local Intergovernmental - Highways: $529,000 ($44.34)
Housing and Community Development: $7,000 ($0.59)
- Miscellaneous - General Revenue - Other: $399,000 ($33.44)
Fines and Forfeits: $121,000 ($10.14)
Rents: $9,000 ($0.75)
Interest Earnings: $7,000 ($0.59)
Donations From Private Sources: $4,000 ($0.34)
- Revenue - Water Utilities: $2,749,000 ($230.41)
Gas Utilities: $1,005,000 ($84.23)
- State Intergovernmental - General Local Government Support: $2,177,000 ($182.47)
- Tax - Property: $5,186,000 ($434.67)
Public Utilities Sales: $1,210,000 ($101.42)
Occupation and Business License - Other: $58,000 ($4.86)
Alcoholic Beverage License: $1,000 ($0.08)
Moss Point government finances - Debt in 2021 (per resident):
- Long Term Debt - Beginning Outstanding - Unspecified Public Purpose: $18,773,000 ($1573.46)
Outstanding Unspecified Public Purpose: $17,142,000 ($1436.76)
Retired Unspecified Public Purpose: $1,631,000 ($136.70)
Issue, Nonguaranteed - Public Debt for Private Purpose: $85,000 ($7.12)
Moss Point government finances - Cash and Securities in 2021 (per resident):
- Other Funds - Cash and Securities: $3,137,000 ($262.93)
7.63% of this county's 2021 resident taxpayers lived in other counties in 2020 ($49,389 average adjusted gross income)
| Here: | 7.63% |
| Mississippi average: | 6.85% |
0.07% of residents moved from foreign countries ($611 average AGI)
Jackson County: 0.07% Mississippi average: 0.02%
Top counties from which taxpayers relocated into this county between 2020 and 2021:
| from Harrison County, MS | |
| from Mobile County, AL | |
| from George County, MS |
7.24% of this county's 2020 resident taxpayers moved to other counties in 2021 ($46,275 average adjusted gross income)
| Here: | 7.24% |
| Mississippi average: | 7.03% |
0.05% of residents moved to foreign countries ($436 average AGI)
Jackson County: 0.05% Mississippi average: 0.02%
Top counties to which taxpayers relocated from this county between 2020 and 2021:
| to Harrison County, MS | |
| to Mobile County, AL | |
| to George County, MS |
| Businesses in Moss Point, MS | ||||
| Name | Count | Name | Count | |
|---|---|---|---|---|
| Advance Auto Parts | 1 | Holiday Inn | 1 | |
| Best Western | 1 | KFC | 1 | |
| Burger King | 1 | La Quinta | 1 | |
| Church's Chicken | 1 | McDonald's | 1 | |
| Comfort Inn | 1 | Quality | 1 | |
| Cracker Barrel | 1 | Ruby Tuesday | 1 | |
| Curves | 1 | SONIC Drive-In | 1 | |
| Days Inn | 1 | Sears | 1 | |
| Domino's Pizza | 1 | Subway | 3 | |
| H&R Block | 1 | Super 8 | 1 | |
| Hardee's | 1 | U-Haul | 2 | |
| Hilton | 1 | Waffle House | 3 | |
Strongest AM radio stations in Moss Point:
- WZZJ (1580 AM; 5 kW; PASCAGOULA-MOSS POIN, MS; Owner: JUDAH BROADASTING NETWORK, INC.)
- WTNI (1640 AM; 10 kW; BILOXI, MS; Owner: MONTEREY LICENSES, LLC)
- WNTM (710 AM; 10 kW; MOBILE, AL; Owner: CLEAR CHANNEL BROADCASTING LICENSES, INC.)
- WBHY (840 AM; daytime; 10 kW; MOBILE, AL; Owner: GOFORTH MEDIA, INC.)
- WDLT (660 AM; 10 kW; FAIRHOPE, AL; Owner: CUMULUS LICENSING CORP.)
- WASG (550 AM; 25 kW; ATMORE, AL; Owner: 550 AM, INC)
- WWL (870 AM; 50 kW; NEW ORLEANS, LA; Owner: ENTERCOM NEW ORLEANS LICENSE, LLC)
- WLNO (1060 AM; 50 kW; NEW ORLEANS, LA; Owner: COMMUNICOM CO. OF LOUISIANA, L.P.)
- WLPR (960 AM; 5 kW; PRICHARD, AL; Owner: GOFORTH MEDIA, INC.)
- WSJC (810 AM; 50 kW; MAGEE, MS; Owner: FAMILY TALK RADIO)
- WKSJ (1270 AM; 5 kW; PRICHARD, AL; Owner: CLEAR CHANNEL BROADCASTING LICENSES, INC.)
- WROA (1390 AM; 5 kW; GULFPORT, MS; Owner: DOWDY/DOWDY PARTNERSHIP)
- WLVV (1410 AM; 5 kW; MOBILE, AL; Owner: WLVV, INC.)
Strongest FM radio stations in Moss Point:
- W205AP (88.9 FM; PASCAGOULA, MS; Owner: FAMILY STATIONS, INC.)
- WKNN-FM (99.1 FM; PASCAGOULA, MS; Owner: CHASE RADIO PROPERTIES, L.L.C.)
- WMJY (93.7 FM; BILOXI, MS; Owner: CHASE RADIO PROPERTIES, L.L.C.)
- WBUV (104.9 FM; MOSS POINT, MS; Owner: CLEAR CHANNEL BROADCASTING LICENSES, INC.)
- WOSM (103.1 FM; OCEAN SPRINGS, MS; Owner: CHARLES H. COOPER)
- WMAH-FM (90.3 FM; BILOXI, MS; Owner: MISSISSIPPI AUTHORITY FOR EDUCATIONAL TV)
- WRKH (96.1 FM; MOBILE, AL; Owner: CLEAR CHANNEL BROADCASTING LICENSES, INC.)
- WZKX (107.9 FM; BAY ST. LOUIS, MS; Owner: DOWDY & DOWDY PARTNERSHIP)
- WMXC (99.9 FM; MOBILE, AL; Owner: CLEAR CHANNEL BROADCASTING LICENSES, INC.)
- WABB-FM (97.5 FM; MOBILE, AL; Owner: WABB-FM, INC.)
- WZNF (95.3 FM; LUMBERTON, MS; Owner: JMD, INC.)
- WXRG (105.9 FM; PASCAGOULA, MS; Owner: MONTEREY LICENSES, LLC)
- WAOY (91.7 FM; GULFPORT, MS; Owner: AMERICAN FAMILY ASSOCIATION, INC.)
- WJLQ (100.7 FM; PENSACOLA, FL; Owner: CUMULUS LICENSING CORP.)
- WBLX-FM (92.9 FM; MOBILE, AL; Owner: CUMULUS LICENSING CORP.)
- WYOK (104.1 FM; ATMORE, AL; Owner: CUMULUS LICENSING CORP.)
- WHIL-FM (91.3 FM; MOBILE, AL; Owner: SPRING HILL COLLEGE)
- WDLT-FM (98.3 FM; CHICKASAW, AL; Owner: CUMULUS LICENSING CORP.)
- WQYZ (92.5 FM; OCEAN SPRINGS, MS; Owner: GOLDEN GULF COAST BROADCASTING, INC.)
TV broadcast stations around Moss Point:
- WKFK-LP (Channel 7; PASCAGOULA, MS; Owner: FRANCES S. SMITH DBA NCN CABLE ADVERTISING)
- W51CU (Channel 51; PASCAGOULA, MS; Owner: TRINITY BROADCASTING NETWORK)
- WKRG-TV (Channel 5; MOBILE, AL; Owner: MEDIA GENERAL BROADCASTING OF SOUTH CAROLINA HOLDINGS, INC.)
- WRBM-LP (Channel 60; PRICHARD, AL; Owner: UPPER GULF COAST, L.L.C.)
- WMAH-TV (Channel 19; BILOXI, MS; Owner: MISSISSIPPI AUTHORITY FOR EDUCATIONAL TELEVISION)
- WXXV-TV (Channel 25; GULFPORT, MS; Owner: MORRIS NETWORK OF MISSISSIPPI, INC.)
- WEAR-TV (Channel 3; PENSACOLA, FL; Owner: WEAR LICENSEE, LLC)
- WLOX (Channel 13; BILOXI, MS; Owner: LIBCO, INC.)
- WMPV-TV (Channel 21; MOBILE, AL; Owner: TRINITY BROADCASTING NETWORK)
- WPMI (Channel 15; MOBILE, AL; Owner: CLEAR CHANNEL BROADCASTING LICENSES, INC.)
- WJTC (Channel 44; PENSACOLA, FL; Owner: CLEAR CHANNEL BROADCASTING LICENSES, INC.)
- W26BR (Channel 26; MERIDIAN, MS; Owner: MS COMMUNICATIONS, LLC)
- WALA-TV (Channel 10; MOBILE, AL; Owner: EMMIS TELEVISION LICENSE CORPORATION)
- National Bridge Inventory (NBI) Statistics
- 48Number of bridges
- 3,658ft / 1,115mTotal length
- $1,609,464,000Total costs
- 452,195Total average daily traffic
- 78,113Total average daily truck traffic
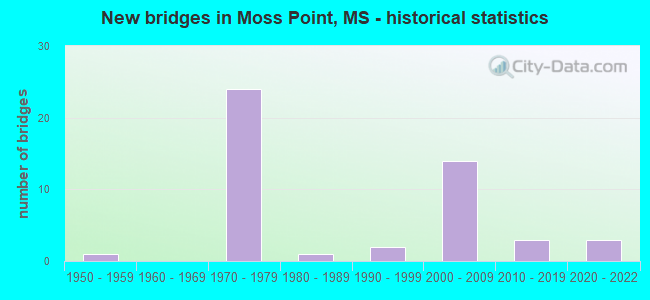
- New bridges - historical statistics
- 11950-1959
- 241970-1979
- 11980-1989
- 21990-1999
- 142000-2009
- 32010-2019
- 32020-2022
FCC Registered Cell Phone Towers:
2 (See the full list of FCC Registered Cell Phone Towers in Moss Point)FCC Registered Antenna Towers:
162 (See the full list of FCC Registered Antenna Towers)FCC Registered Commercial Land Mobile Towers:
3 (See the full list of FCC Registered Commercial Land Mobile Towers in Moss Point, MS)FCC Registered Private Land Mobile Towers:
1 (See the full list of FCC Registered Private Land Mobile Towers)FCC Registered Broadcast Land Mobile Towers:
21 (See the full list of FCC Registered Broadcast Land Mobile Towers)FCC Registered Microwave Towers:
8 (See the full list of FCC Registered Microwave Towers in this town)FCC Registered Amateur Radio Licenses:
70 (See the full list of FCC Registered Amateur Radio Licenses in Moss Point)FAA Registered Aircraft:
3- Aircraft: PIPER PA-28-180 (Category: Land, Seats: 4, Weight: Up to 12,499 Pounds, Speed: 107 mph), Engine: LYCOMING O&VO-360 SER (180 HP) (Reciprocating)
N-Number: 7747N, N7747N, N-7747N, Serial Number: 28-5191, Year manufactured: 1968, Airworthiness Date: 10/22/1968, Certificate Issue Date: 07/02/2001
Registrant (Individual): Jerry Ray Shumock, 18601 Rayford Shumock Rd, Moss Point, MS 39562 - Aircraft: PIPER PA-28-235 (Category: Land, Seats: 4, Weight: Up to 12,499 Pounds, Speed: 107 mph), Engine: LYCOMING I0360 SER (180 HP) (Reciprocating)
N-Number: 9325W, N9325W, N-9325W, Serial Number: 28-11008, Year manufactured: 1968, Airworthiness Date: 02/20/1968, Certificate Issue Date: 04/23/2019
Registrant (Individual): Daniel Stevens, 5109 Moorwood Dr, Moss Point, MS 39562 - Aircraft: INOVATION ENGINEERING REVELATION (Category: Land, Seats: 2, Weight: Up to 12,499 Pounds), Engine: ROTAX 582DCDI-99 (65 HP) (2 Cycle)
N-Number: 3802H, N3802H, N-3802H, Serial Number: G1065RK, Year manufactured: 1999, Airworthiness Date: 12/26/2007, Certificate Issue Date: 10/12/2007
Registrant (Individual): Robert E Harrell, 13201 Saracennia Rd, Moss Point, MS 39562
Deregistered: Cancel Date: 01/18/2018
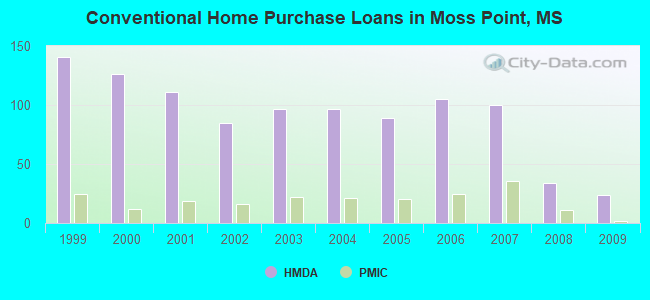
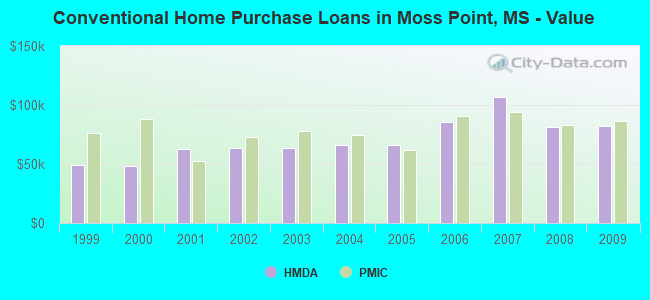
| Home Mortgage Disclosure Act Aggregated Statistics For Year 2009 (Based on 5 full and 1 partial tracts) | ||||||||||||||
| A) FHA, FSA/RHS & VA Home Purchase Loans | B) Conventional Home Purchase Loans | C) Refinancings | D) Home Improvement Loans | E) Loans on Dwellings For 5+ Families | F) Non-occupant Loans on < 5 Family Dwellings (A B C & D) | G) Loans On Manufactured Home Dwelling (A B C & D) | ||||||||
|---|---|---|---|---|---|---|---|---|---|---|---|---|---|---|
| Number | Average Value | Number | Average Value | Number | Average Value | Number | Average Value | Number | Average Value | Number | Average Value | Number | Average Value | |
| LOANS ORIGINATED | 11 | $108,641 | 24 | $81,983 | 125 | $83,467 | 82 | $24,941 | 3 | $188,073 | 38 | $53,601 | 3 | $20,597 |
| APPLICATIONS APPROVED, NOT ACCEPTED | 0 | $0 | 4 | $85,408 | 24 | $87,025 | 8 | $43,058 | 0 | $0 | 7 | $65,257 | 0 | $0 |
| APPLICATIONS DENIED | 5 | $81,270 | 35 | $82,898 | 100 | $85,894 | 77 | $25,208 | 0 | $0 | 23 | $61,775 | 3 | $31,120 |
| APPLICATIONS WITHDRAWN | 8 | $91,809 | 10 | $106,945 | 32 | $75,232 | 11 | $55,388 | 0 | $0 | 9 | $60,011 | 0 | $0 |
| FILES CLOSED FOR INCOMPLETENESS | 2 | $200,515 | 7 | $141,026 | 22 | $91,935 | 1 | $328,200 | 0 | $0 | 1 | $45,000 | 0 | $0 |
Detailed HMDA statistics for the following Tracts: 0413.00 , 0414.00, 0415.00, 0416.00, 0417.00, 0418.00
| Private Mortgage Insurance Companies Aggregated Statistics For Year 2009 (Based on 2 full and 1 partial tracts) | ||||
| A) Conventional Home Purchase Loans | B) Refinancings | |||
|---|---|---|---|---|
| Number | Average Value | Number | Average Value | |
| LOANS ORIGINATED | 2 | $86,635 | 0 | $0 |
| APPLICATIONS APPROVED, NOT ACCEPTED | 0 | $0 | 1 | $78,370 |
| APPLICATIONS DENIED | 0 | $0 | 1 | $131,190 |
| APPLICATIONS WITHDRAWN | 0 | $0 | 0 | $0 |
| FILES CLOSED FOR INCOMPLETENESS | 0 | $0 | 0 | $0 |
Detailed PMIC statistics for the following Tracts: 0413.00 , 0414.00, 0415.00, 0416.00, 0417.00, 0418.00
2002 - 2018 National Fire Incident Reporting System (NFIRS) incidents
- Fire incident types reported to NFIRS in Moss Point, MS
- 3,31156.0%Outside Fires
- 1,46524.8%Structure Fires
- 94816.0%Mobile Property/Vehicle Fires
- 1933.3%Other
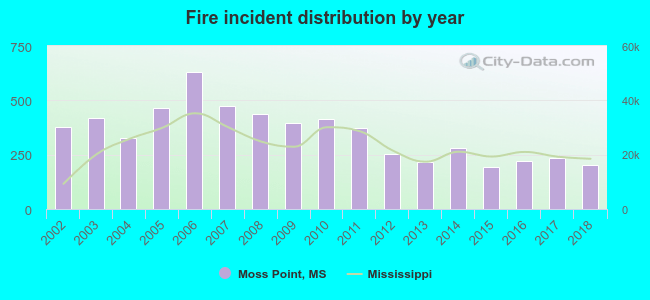 Based on the data from the years 2002 - 2018 the average number of fire incidents per year is 348. The highest number of fire incidents - 632 took place in 2006, and the least - 193 in 2015. The data has a declining trend.
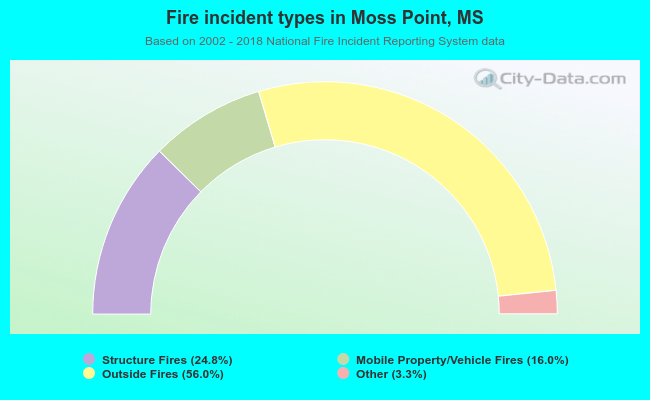 When looking into fire subcategories, the most reports belonged to: Outside Fires (56.0%), and Structure Fires (24.8%).
Fire-safe hotels and motels in Moss Point, Mississippi:
- Shular Inn - Moss Point, 6623 Hwy 63, Moss Point, Mississippi 39563 , Phone: (228) 474-2100
- Ramada Inn - Moss Point, 6007 Hwy 90, Moss Point, Mississippi 39563 , Phone: (228) 769-6200
- Quality Inn Pascagoula/Moss Point, 6800 Hwy 63, Moss Point, Mississippi 39563 , Phone: (228) 475-2477, Fax: (228) 475-8990
- Super 8 Motel, 6824 Hwy 613, Moss Point, Mississippi 39563 , Phone: (228) 474-1855, Fax: (228) 475-5984
- Hampton Inn, 6730 Hwy 63, Moss Point, Mississippi 39563 , Phone: (228) 246-0777, Fax: (228) 246-0778
- La Quinta Inn Moss Point, 7001 Hwy 63 N, Moss Point, Mississippi 39563 , Phone: (228) 474-4488
- Days Inn Moss Point, 6700 Hwy 63, Moss Point, Mississippi 39563 , Phone: (228) 475-0077, Fax: (228) 475-3783
| Most common first names in Moss Point, MS among deceased individuals | ||
| Name | Count | Lived (average) |
|---|---|---|
| James | 154 | 68.3 years |
| Willie | 129 | 70.2 years |
| Mary | 120 | 75.8 years |
| John | 120 | 71.3 years |
| Robert | 98 | 68.1 years |
| William | 89 | 72.0 years |
| Charles | 65 | 66.9 years |
| George | 63 | 72.5 years |
| Annie | 52 | 78.3 years |
| Henry | 48 | 72.1 years |
| Most common last names in Moss Point, MS among deceased individuals | ||
| Last name | Count | Lived (average) |
|---|---|---|
| Smith | 93 | 72.8 years |
| Johnson | 75 | 69.7 years |
| Williams | 74 | 70.8 years |
| Jones | 67 | 67.6 years |
| Davis | 55 | 70.5 years |
| Miller | 46 | 72.2 years |
| Brown | 42 | 69.9 years |
| Green | 36 | 71.2 years |
| Taylor | 36 | 72.7 years |
| Jackson | 34 | 72.7 years |
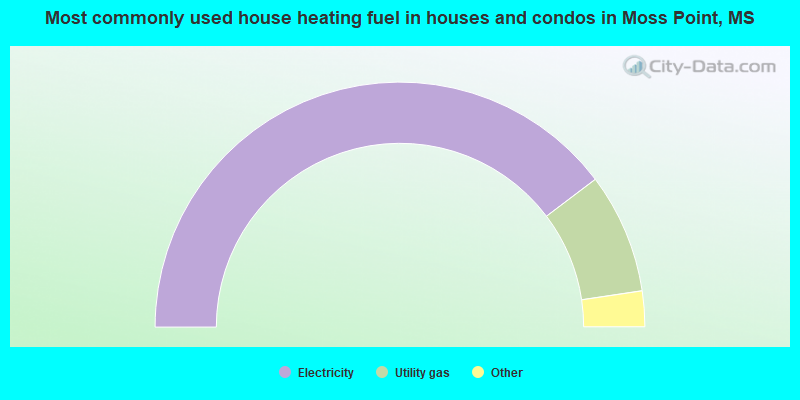
- 79.5%Electricity
- 15.9%Utility gas
- 3.0%Bottled, tank, or LP gas
- 1.7%No fuel used
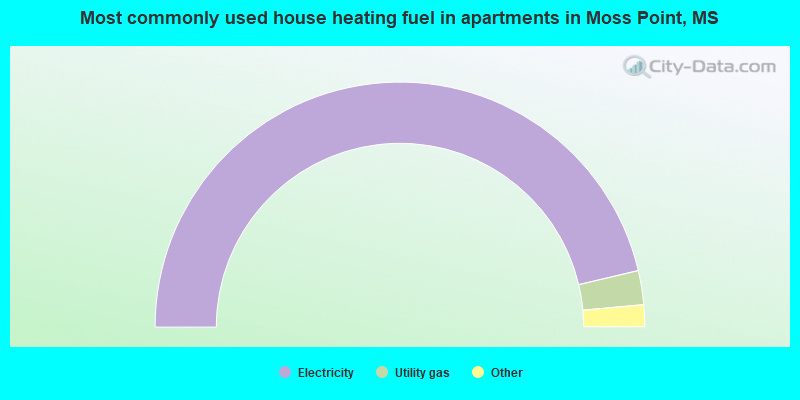
- 92.7%Electricity
- 4.5%Utility gas
- 2.1%No fuel used
- 0.6%Bottled, tank, or LP gas
Moss Point compared to Mississippi state average:
- Median age above state average.
- Foreign-born population percentage significantly below state average.
- Length of stay since moving in significantly above state average.
- House age above state average.
- Number of college students below state average.
Moss Point on our top lists:
- #40 on the list of "Top 101 cities with largest percentage of females in occupations: construction and extraction occupations (population 5,000+)"
- #85 on the list of "Top 101 cities with the most full-time firefighters per 1000 residents (population 5,000+)"
- #86 on the list of "Top 101 cities with the highest number of burglaries per 100,000 residents, excludes tourist destinations and others with a lot of outsiders visiting based on city industries data (population 5,000+)"
- #98 on the list of "Top 101 cities with the largest percentage population decrease from 2000 (population 5,000+)"
- #15 on the list of "Top 101 counties with the worst general health status score of residents (1-5), 3 years of data"
- #30 on the list of "Top 101 counties with the lowest Nitrogen Dioxide air pollution readings in 2012 (ppm)"
- #34 on the list of "Top 101 counties with the lowest percentage of residents that exercised in the past month"
- #37 on the list of "Top 101 counties with the highest percentage of residents that smoked 100+ cigarettes in their lives"
- #58 on the list of "Top 101 counties with the highest percentage of residents that drank alcohol in the past 30 days"

|
|
Total of 8 patent applications in 2008-2024.