North Port, Florida Submit your own pictures of this city and show them to the world
OSM Map
General Map
Google Map
MSN Map
OSM Map
General Map
Google Map
MSN Map
OSM Map
General Map
Google Map
MSN Map
OSM Map
General Map
Google Map
MSN Map
Please wait while loading the map...
Population in 2022: 85,099 (95% urban, 5% rural). Population change since 2000: +273.3%Males: 41,390 Females: 43,709
March 2022 cost of living index in North Port: 95.2 (near average, U.S. average is 100) Percentage of residents living in poverty in 2022: 8.2%for White Non-Hispanic residents , 6.5% for Black residents , 13.4% for Hispanic or Latino residents , 4.0% for other race residents , 9.1% for two or more races residents )
Profiles of local businesses
Business Search - 14 Million verified businesses
Data:
Median household income ($)
Median household income (% change since 2000)
Household income diversity
Ratio of average income to average house value (%)
Ratio of average income to average rent
Median household income ($) - White
Median household income ($) - Black or African American
Median household income ($) - Asian
Median household income ($) - Hispanic or Latino
Median household income ($) - American Indian and Alaska Native
Median household income ($) - Multirace
Median household income ($) - Other Race
Median household income for houses/condos with a mortgage ($)
Median household income for apartments without a mortgage ($)
Races - White alone (%)
Races - White alone (% change since 2000)
Races - Black alone (%)
Races - Black alone (% change since 2000)
Races - American Indian alone (%)
Races - American Indian alone (% change since 2000)
Races - Asian alone (%)
Races - Asian alone (% change since 2000)
Races - Hispanic (%)
Races - Hispanic (% change since 2000)
Races - Native Hawaiian and Other Pacific Islander alone (%)
Races - Native Hawaiian and Other Pacific Islander alone (% change since 2000)
Races - Two or more races (%)
Races - Two or more races (% change since 2000)
Races - Other race alone (%)
Races - Other race alone (% change since 2000)
Racial diversity
Unemployment (%)
Unemployment (% change since 2000)
Unemployment (%) - White
Unemployment (%) - Black or African American
Unemployment (%) - Asian
Unemployment (%) - Hispanic or Latino
Unemployment (%) - American Indian and Alaska Native
Unemployment (%) - Multirace
Unemployment (%) - Other Race
Population density (people per square mile)
Population - Males (%)
Population - Females (%)
Population - Males (%) - White
Population - Males (%) - Black or African American
Population - Males (%) - Asian
Population - Males (%) - Hispanic or Latino
Population - Males (%) - American Indian and Alaska Native
Population - Males (%) - Multirace
Population - Males (%) - Other Race
Population - Females (%) - White
Population - Females (%) - Black or African American
Population - Females (%) - Asian
Population - Females (%) - Hispanic or Latino
Population - Females (%) - American Indian and Alaska Native
Population - Females (%) - Multirace
Population - Females (%) - Other Race
Coronavirus confirmed cases (Apr 26, 2024)
Deaths caused by coronavirus (Apr 26, 2024)
Coronavirus confirmed cases (per 100k population) (Apr 26, 2024)
Deaths caused by coronavirus (per 100k population) (Apr 26, 2024)
Daily increase in number of cases (Apr 26, 2024)
Weekly increase in number of cases (Apr 26, 2024)
Cases doubled (in days) (Apr 26, 2024)
Hospitalized patients (Apr 18, 2022)
Negative test results (Apr 18, 2022)
Total test results (Apr 18, 2022)
COVID Vaccine doses distributed (per 100k population) (Sep 19, 2023)
COVID Vaccine doses administered (per 100k population) (Sep 19, 2023)
COVID Vaccine doses distributed (Sep 19, 2023)
COVID Vaccine doses administered (Sep 19, 2023)
Likely homosexual households (%)
Likely homosexual households (% change since 2000)
Likely homosexual households - Lesbian couples (%)
Likely homosexual households - Lesbian couples (% change since 2000)
Likely homosexual households - Gay men (%)
Likely homosexual households - Gay men (% change since 2000)
Cost of living index
Median gross rent ($)
Median contract rent ($)
Median monthly housing costs ($)
Median house or condo value ($)
Median house or condo value ($ change since 2000)
Mean house or condo value by units in structure - 1, detached ($)
Mean house or condo value by units in structure - 1, attached ($)
Mean house or condo value by units in structure - 2 ($)
Mean house or condo value by units in structure by units in structure - 3 or 4 ($)
Mean house or condo value by units in structure - 5 or more ($)
Mean house or condo value by units in structure - Boat, RV, van, etc. ($)
Mean house or condo value by units in structure - Mobile home ($)
Median house or condo value ($) - White
Median house or condo value ($) - Black or African American
Median house or condo value ($) - Asian
Median house or condo value ($) - Hispanic or Latino
Median house or condo value ($) - American Indian and Alaska Native
Median house or condo value ($) - Multirace
Median house or condo value ($) - Other Race
Median resident age
Resident age diversity
Median resident age - Males
Median resident age - Females
Median resident age - White
Median resident age - Black or African American
Median resident age - Asian
Median resident age - Hispanic or Latino
Median resident age - American Indian and Alaska Native
Median resident age - Multirace
Median resident age - Other Race
Median resident age - Males - White
Median resident age - Males - Black or African American
Median resident age - Males - Asian
Median resident age - Males - Hispanic or Latino
Median resident age - Males - American Indian and Alaska Native
Median resident age - Males - Multirace
Median resident age - Males - Other Race
Median resident age - Females - White
Median resident age - Females - Black or African American
Median resident age - Females - Asian
Median resident age - Females - Hispanic or Latino
Median resident age - Females - American Indian and Alaska Native
Median resident age - Females - Multirace
Median resident age - Females - Other Race
Commute - mean travel time to work (minutes)
Travel time to work - Less than 5 minutes (%)
Travel time to work - Less than 5 minutes (% change since 2000)
Travel time to work - 5 to 9 minutes (%)
Travel time to work - 5 to 9 minutes (% change since 2000)
Travel time to work - 10 to 19 minutes (%)
Travel time to work - 10 to 19 minutes (% change since 2000)
Travel time to work - 20 to 29 minutes (%)
Travel time to work - 20 to 29 minutes (% change since 2000)
Travel time to work - 30 to 39 minutes (%)
Travel time to work - 30 to 39 minutes (% change since 2000)
Travel time to work - 40 to 59 minutes (%)
Travel time to work - 40 to 59 minutes (% change since 2000)
Travel time to work - 60 to 89 minutes (%)
Travel time to work - 60 to 89 minutes (% change since 2000)
Travel time to work - 90 or more minutes (%)
Travel time to work - 90 or more minutes (% change since 2000)
Marital status - Never married (%)
Marital status - Now married (%)
Marital status - Separated (%)
Marital status - Widowed (%)
Marital status - Divorced (%)
Median family income ($)
Median family income (% change since 2000)
Median non-family income ($)
Median non-family income (% change since 2000)
Median per capita income ($)
Median per capita income (% change since 2000)
Median family income ($) - White
Median family income ($) - Black or African American
Median family income ($) - Asian
Median family income ($) - Hispanic or Latino
Median family income ($) - American Indian and Alaska Native
Median family income ($) - Multirace
Median family income ($) - Other Race
Median year house/condo built
Median year apartment built
Year house built - Built 2005 or later (%)
Year house built - Built 2000 to 2004 (%)
Year house built - Built 1990 to 1999 (%)
Year house built - Built 1980 to 1989 (%)
Year house built - Built 1970 to 1979 (%)
Year house built - Built 1960 to 1969 (%)
Year house built - Built 1950 to 1959 (%)
Year house built - Built 1940 to 1949 (%)
Year house built - Built 1939 or earlier (%)
Average household size
Household density (households per square mile)
Average household size - White
Average household size - Black or African American
Average household size - Asian
Average household size - Hispanic or Latino
Average household size - American Indian and Alaska Native
Average household size - Multirace
Average household size - Other Race
Occupied housing units (%)
Vacant housing units (%)
Owner occupied housing units (%)
Renter occupied housing units (%)
Vacancy status - For rent (%)
Vacancy status - For sale only (%)
Vacancy status - Rented or sold, not occupied (%)
Vacancy status - For seasonal, recreational, or occasional use (%)
Vacancy status - For migrant workers (%)
Vacancy status - Other vacant (%)
Residents with income below the poverty level (%)
Residents with income below 50% of the poverty level (%)
Children below poverty level (%)
Poor families by family type - Married-couple family (%)
Poor families by family type - Male, no wife present (%)
Poor families by family type - Female, no husband present (%)
Poverty status for native-born residents (%)
Poverty status for foreign-born residents (%)
Poverty among high school graduates not in families (%)
Poverty among people who did not graduate high school not in families (%)
Residents with income below the poverty level (%) - White
Residents with income below the poverty level (%) - Black or African American
Residents with income below the poverty level (%) - Asian
Residents with income below the poverty level (%) - Hispanic or Latino
Residents with income below the poverty level (%) - American Indian and Alaska Native
Residents with income below the poverty level (%) - Multirace
Residents with income below the poverty level (%) - Other Race
Air pollution - Air Quality Index (AQI)
Air pollution - CO
Air pollution - NO2
Air pollution - SO2
Air pollution - Ozone
Air pollution - PM10
Air pollution - PM25
Air pollution - Pb
Crime - Murders per 100,000 population
Crime - Rapes per 100,000 population
Crime - Robberies per 100,000 population
Crime - Assaults per 100,000 population
Crime - Burglaries per 100,000 population
Crime - Thefts per 100,000 population
Crime - Auto thefts per 100,000 population
Crime - Arson per 100,000 population
Crime - City-data.com crime index
Crime - Violent crime index
Crime - Property crime index
Crime - Murders per 100,000 population (5 year average)
Crime - Rapes per 100,000 population (5 year average)
Crime - Robberies per 100,000 population (5 year average)
Crime - Assaults per 100,000 population (5 year average)
Crime - Burglaries per 100,000 population (5 year average)
Crime - Thefts per 100,000 population (5 year average)
Crime - Auto thefts per 100,000 population (5 year average)
Crime - Arson per 100,000 population (5 year average)
Crime - City-data.com crime index (5 year average)
Crime - Violent crime index (5 year average)
Crime - Property crime index (5 year average)
1996 Presidential Elections Results (%) - Democratic Party (Clinton)
1996 Presidential Elections Results (%) - Republican Party (Dole)
1996 Presidential Elections Results (%) - Other
2000 Presidential Elections Results (%) - Democratic Party (Gore)
2000 Presidential Elections Results (%) - Republican Party (Bush)
2000 Presidential Elections Results (%) - Other
2004 Presidential Elections Results (%) - Democratic Party (Kerry)
2004 Presidential Elections Results (%) - Republican Party (Bush)
2004 Presidential Elections Results (%) - Other
2008 Presidential Elections Results (%) - Democratic Party (Obama)
2008 Presidential Elections Results (%) - Republican Party (McCain)
2008 Presidential Elections Results (%) - Other
2012 Presidential Elections Results (%) - Democratic Party (Obama)
2012 Presidential Elections Results (%) - Republican Party (Romney)
2012 Presidential Elections Results (%) - Other
2016 Presidential Elections Results (%) - Democratic Party (Clinton)
2016 Presidential Elections Results (%) - Republican Party (Trump)
2016 Presidential Elections Results (%) - Other
2020 Presidential Elections Results (%) - Democratic Party (Biden)
2020 Presidential Elections Results (%) - Republican Party (Trump)
2020 Presidential Elections Results (%) - Other
Ancestries Reported - Arab (%)
Ancestries Reported - Czech (%)
Ancestries Reported - Danish (%)
Ancestries Reported - Dutch (%)
Ancestries Reported - English (%)
Ancestries Reported - French (%)
Ancestries Reported - French Canadian (%)
Ancestries Reported - German (%)
Ancestries Reported - Greek (%)
Ancestries Reported - Hungarian (%)
Ancestries Reported - Irish (%)
Ancestries Reported - Italian (%)
Ancestries Reported - Lithuanian (%)
Ancestries Reported - Norwegian (%)
Ancestries Reported - Polish (%)
Ancestries Reported - Portuguese (%)
Ancestries Reported - Russian (%)
Ancestries Reported - Scotch-Irish (%)
Ancestries Reported - Scottish (%)
Ancestries Reported - Slovak (%)
Ancestries Reported - Subsaharan African (%)
Ancestries Reported - Swedish (%)
Ancestries Reported - Swiss (%)
Ancestries Reported - Ukrainian (%)
Ancestries Reported - United States (%)
Ancestries Reported - Welsh (%)
Ancestries Reported - West Indian (%)
Ancestries Reported - Other (%)
Educational Attainment - No schooling completed (%)
Educational Attainment - Less than high school (%)
Educational Attainment - High school or equivalent (%)
Educational Attainment - Less than 1 year of college (%)
Educational Attainment - 1 or more years of college (%)
Educational Attainment - Associate degree (%)
Educational Attainment - Bachelor's degree (%)
Educational Attainment - Master's degree (%)
Educational Attainment - Professional school degree (%)
Educational Attainment - Doctorate degree (%)
School Enrollment - Nursery, preschool (%)
School Enrollment - Kindergarten (%)
School Enrollment - Grade 1 to 4 (%)
School Enrollment - Grade 5 to 8 (%)
School Enrollment - Grade 9 to 12 (%)
School Enrollment - College undergrad (%)
School Enrollment - Graduate or professional (%)
School Enrollment - Not enrolled in school (%)
School enrollment - Public schools (%)
School enrollment - Private schools (%)
School enrollment - Not enrolled (%)
Median number of rooms in houses and condos
Median number of rooms in apartments
Housing units lacking complete plumbing facilities (%)
Housing units lacking complete kitchen facilities (%)
Density of houses
Urban houses (%)
Rural houses (%)
Households with people 60 years and over (%)
Households with people 65 years and over (%)
Households with people 75 years and over (%)
Households with one or more nonrelatives (%)
Households with no nonrelatives (%)
Population in households (%)
Family households (%)
Nonfamily households (%)
Population in families (%)
Family households with own children (%)
Median number of bedrooms in owner occupied houses
Mean number of bedrooms in owner occupied houses
Median number of bedrooms in renter occupied houses
Mean number of bedrooms in renter occupied houses
Median number of vehichles in owner occupied houses
Mean number of vehichles in owner occupied houses
Median number of vehichles in renter occupied houses
Mean number of vehichles in renter occupied houses
Mortgage status - with mortgage (%)
Mortgage status - with second mortgage (%)
Mortgage status - with home equity loan (%)
Mortgage status - with both second mortgage and home equity loan (%)
Mortgage status - without a mortgage (%)
Average family size
Average family size - White
Average family size - Black or African American
Average family size - Asian
Average family size - Hispanic or Latino
Average family size - American Indian and Alaska Native
Average family size - Multirace
Average family size - Other Race
Geographical mobility - Same house 1 year ago (%)
Geographical mobility - Moved within same county (%)
Geographical mobility - Moved from different county within same state (%)
Geographical mobility - Moved from different state (%)
Geographical mobility - Moved from abroad (%)
Place of birth - Born in state of residence (%)
Place of birth - Born in other state (%)
Place of birth - Native, outside of US (%)
Place of birth - Foreign born (%)
Housing units in structures - 1, detached (%)
Housing units in structures - 1, attached (%)
Housing units in structures - 2 (%)
Housing units in structures - 3 or 4 (%)
Housing units in structures - 5 to 9 (%)
Housing units in structures - 10 to 19 (%)
Housing units in structures - 20 to 49 (%)
Housing units in structures - 50 or more (%)
Housing units in structures - Mobile home (%)
Housing units in structures - Boat, RV, van, etc. (%)
House/condo owner moved in on average (years ago)
Renter moved in on average (years ago)
Year householder moved into unit - Moved in 1999 to March 2000 (%)
Year householder moved into unit - Moved in 1995 to 1998 (%)
Year householder moved into unit - Moved in 1990 to 1994 (%)
Year householder moved into unit - Moved in 1980 to 1989 (%)
Year householder moved into unit - Moved in 1970 to 1979 (%)
Year householder moved into unit - Moved in 1969 or earlier (%)
Means of transportation to work - Drove car alone (%)
Means of transportation to work - Carpooled (%)
Means of transportation to work - Public transportation (%)
Means of transportation to work - Bus or trolley bus (%)
Means of transportation to work - Streetcar or trolley car (%)
Means of transportation to work - Subway or elevated (%)
Means of transportation to work - Railroad (%)
Means of transportation to work - Ferryboat (%)
Means of transportation to work - Taxicab (%)
Means of transportation to work - Motorcycle (%)
Means of transportation to work - Bicycle (%)
Means of transportation to work - Walked (%)
Means of transportation to work - Other means (%)
Working at home (%)
Industry diversity
Most Common Industries - Agriculture, forestry, fishing and hunting, and mining (%)
Most Common Industries - Agriculture, forestry, fishing and hunting (%)
Most Common Industries - Mining, quarrying, and oil and gas extraction (%)
Most Common Industries - Construction (%)
Most Common Industries - Manufacturing (%)
Most Common Industries - Wholesale trade (%)
Most Common Industries - Retail trade (%)
Most Common Industries - Transportation and warehousing, and utilities (%)
Most Common Industries - Transportation and warehousing (%)
Most Common Industries - Utilities (%)
Most Common Industries - Information (%)
Most Common Industries - Finance and insurance, and real estate and rental and leasing (%)
Most Common Industries - Finance and insurance (%)
Most Common Industries - Real estate and rental and leasing (%)
Most Common Industries - Professional, scientific, and management, and administrative and waste management services (%)
Most Common Industries - Professional, scientific, and technical services (%)
Most Common Industries - Management of companies and enterprises (%)
Most Common Industries - Administrative and support and waste management services (%)
Most Common Industries - Educational services, and health care and social assistance (%)
Most Common Industries - Educational services (%)
Most Common Industries - Health care and social assistance (%)
Most Common Industries - Arts, entertainment, and recreation, and accommodation and food services (%)
Most Common Industries - Arts, entertainment, and recreation (%)
Most Common Industries - Accommodation and food services (%)
Most Common Industries - Other services, except public administration (%)
Most Common Industries - Public administration (%)
Occupation diversity
Most Common Occupations - Management, business, science, and arts occupations (%)
Most Common Occupations - Management, business, and financial occupations (%)
Most Common Occupations - Management occupations (%)
Most Common Occupations - Business and financial operations occupations (%)
Most Common Occupations - Computer, engineering, and science occupations (%)
Most Common Occupations - Computer and mathematical occupations (%)
Most Common Occupations - Architecture and engineering occupations (%)
Most Common Occupations - Life, physical, and social science occupations (%)
Most Common Occupations - Education, legal, community service, arts, and media occupations (%)
Most Common Occupations - Community and social service occupations (%)
Most Common Occupations - Legal occupations (%)
Most Common Occupations - Education, training, and library occupations (%)
Most Common Occupations - Arts, design, entertainment, sports, and media occupations (%)
Most Common Occupations - Healthcare practitioners and technical occupations (%)
Most Common Occupations - Health diagnosing and treating practitioners and other technical occupations (%)
Most Common Occupations - Health technologists and technicians (%)
Most Common Occupations - Service occupations (%)
Most Common Occupations - Healthcare support occupations (%)
Most Common Occupations - Protective service occupations (%)
Most Common Occupations - Fire fighting and prevention, and other protective service workers including supervisors (%)
Most Common Occupations - Law enforcement workers including supervisors (%)
Most Common Occupations - Food preparation and serving related occupations (%)
Most Common Occupations - Building and grounds cleaning and maintenance occupations (%)
Most Common Occupations - Personal care and service occupations (%)
Most Common Occupations - Sales and office occupations (%)
Most Common Occupations - Sales and related occupations (%)
Most Common Occupations - Office and administrative support occupations (%)
Most Common Occupations - Natural resources, construction, and maintenance occupations (%)
Most Common Occupations - Farming, fishing, and forestry occupations (%)
Most Common Occupations - Construction and extraction occupations (%)
Most Common Occupations - Installation, maintenance, and repair occupations (%)
Most Common Occupations - Production, transportation, and material moving occupations (%)
Most Common Occupations - Production occupations (%)
Most Common Occupations - Transportation occupations (%)
Most Common Occupations - Material moving occupations (%)
People in Group quarters - Institutionalized population (%)
People in Group quarters - Correctional institutions (%)
People in Group quarters - Federal prisons and detention centers (%)
People in Group quarters - Halfway houses (%)
People in Group quarters - Local jails and other confinement facilities (including police lockups) (%)
People in Group quarters - Military disciplinary barracks (%)
People in Group quarters - State prisons (%)
People in Group quarters - Other types of correctional institutions (%)
People in Group quarters - Nursing homes (%)
People in Group quarters - Hospitals/wards, hospices, and schools for the handicapped (%)
People in Group quarters - Hospitals/wards and hospices for chronically ill (%)
People in Group quarters - Hospices or homes for chronically ill (%)
People in Group quarters - Military hospitals or wards for chronically ill (%)
People in Group quarters - Other hospitals or wards for chronically ill (%)
People in Group quarters - Hospitals or wards for drug/alcohol abuse (%)
People in Group quarters - Mental (Psychiatric) hospitals or wards (%)
People in Group quarters - Schools, hospitals, or wards for the mentally retarded (%)
People in Group quarters - Schools, hospitals, or wards for the physically handicapped (%)
People in Group quarters - Institutions for the deaf (%)
People in Group quarters - Institutions for the blind (%)
People in Group quarters - Orthopedic wards and institutions for the physically handicapped (%)
People in Group quarters - Wards in general hospitals for patients who have no usual home elsewhere (%)
People in Group quarters - Wards in military hospitals for patients who have no usual home elsewhere (%)
People in Group quarters - Juvenile institutions (%)
People in Group quarters - Long-term care (%)
People in Group quarters - Homes for abused, dependent, and neglected children (%)
People in Group quarters - Residential treatment centers for emotionally disturbed children (%)
People in Group quarters - Training schools for juvenile delinquents (%)
People in Group quarters - Short-term care, detention or diagnostic centers for delinquent children (%)
People in Group quarters - Type of juvenile institution unknown (%)
People in Group quarters - Noninstitutionalized population (%)
People in Group quarters - College dormitories (includes college quarters off campus) (%)
People in Group quarters - Military quarters (%)
People in Group quarters - On base (%)
People in Group quarters - Barracks, unaccompanied personnel housing (UPH), (Enlisted/Officer), ;and similar group living quarters for military personnel (%)
People in Group quarters - Transient quarters for temporary residents (%)
People in Group quarters - Military ships (%)
People in Group quarters - Group homes (%)
People in Group quarters - Homes or halfway houses for drug/alcohol abuse (%)
People in Group quarters - Homes for the mentally ill (%)
People in Group quarters - Homes for the mentally retarded (%)
People in Group quarters - Homes for the physically handicapped (%)
People in Group quarters - Other group homes (%)
People in Group quarters - Religious group quarters (%)
People in Group quarters - Dormitories (%)
People in Group quarters - Agriculture workers' dormitories on farms (%)
People in Group quarters - Job Corps and vocational training facilities (%)
People in Group quarters - Other workers' dormitories (%)
People in Group quarters - Crews of maritime vessels (%)
People in Group quarters - Other nonhousehold living situations (%)
People in Group quarters - Other noninstitutional group quarters (%)
Residents speaking English at home (%)
Residents speaking English at home - Born in the United States (%)
Residents speaking English at home - Native, born elsewhere (%)
Residents speaking English at home - Foreign born (%)
Residents speaking Spanish at home (%)
Residents speaking Spanish at home - Born in the United States (%)
Residents speaking Spanish at home - Native, born elsewhere (%)
Residents speaking Spanish at home - Foreign born (%)
Residents speaking other language at home (%)
Residents speaking other language at home - Born in the United States (%)
Residents speaking other language at home - Native, born elsewhere (%)
Residents speaking other language at home - Foreign born (%)
Class of Workers - Employee of private company (%)
Class of Workers - Self-employed in own incorporated business (%)
Class of Workers - Private not-for-profit wage and salary workers (%)
Class of Workers - Local government workers (%)
Class of Workers - State government workers (%)
Class of Workers - Federal government workers (%)
Class of Workers - Self-employed workers in own not incorporated business and Unpaid family workers (%)
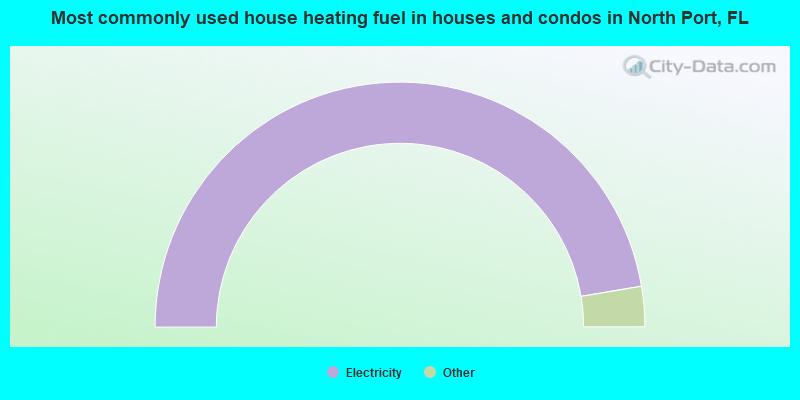
House heating fuel used in houses and condos - Utility gas (%)
House heating fuel used in houses and condos - Bottled, tank, or LP gas (%)
House heating fuel used in houses and condos - Electricity (%)
House heating fuel used in houses and condos - Fuel oil, kerosene, etc. (%)
House heating fuel used in houses and condos - Coal or coke (%)
House heating fuel used in houses and condos - Wood (%)
House heating fuel used in houses and condos - Solar energy (%)
House heating fuel used in houses and condos - Other fuel (%)
House heating fuel used in houses and condos - No fuel used (%)
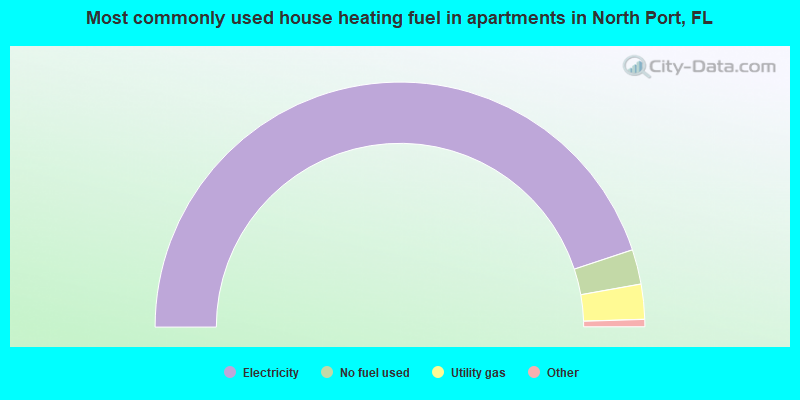
House heating fuel used in apartments - Utility gas (%)
House heating fuel used in apartments - Bottled, tank, or LP gas (%)
House heating fuel used in apartments - Electricity (%)
House heating fuel used in apartments - Fuel oil, kerosene, etc. (%)
House heating fuel used in apartments - Coal or coke (%)
House heating fuel used in apartments - Wood (%)
House heating fuel used in apartments - Solar energy (%)
House heating fuel used in apartments - Other fuel (%)
House heating fuel used in apartments - No fuel used (%)
Armed forces status - In Armed Forces (%)
Armed forces status - Civilian (%)
Armed forces status - Civilian - Veteran (%)
Armed forces status - Civilian - Nonveteran (%)
Fatal accidents locations in years 2005-2021
Fatal accidents locations in 2005
Fatal accidents locations in 2006
Fatal accidents locations in 2007
Fatal accidents locations in 2008
Fatal accidents locations in 2009
Fatal accidents locations in 2010
Fatal accidents locations in 2011
Fatal accidents locations in 2012
Fatal accidents locations in 2013
Fatal accidents locations in 2014
Fatal accidents locations in 2015
Fatal accidents locations in 2016
Fatal accidents locations in 2017
Fatal accidents locations in 2018
Fatal accidents locations in 2019
Fatal accidents locations in 2020
Fatal accidents locations in 2021
Alcohol use - People drinking some alcohol every month (%)
Alcohol use - People not drinking at all (%)
Alcohol use - Average days/month drinking alcohol
Alcohol use - Average drinks/week
Alcohol use - Average days/year people drink much
Audiometry - Average condition of hearing (%)
Audiometry - People that can hear a whisper from across a quiet room (%)
Audiometry - People that can hear normal voice from across a quiet room (%)
Audiometry - Ears ringing, roaring, buzzing (%)
Audiometry - Had a job exposure to loud noise (%)
Audiometry - Had off-work exposure to loud noise (%)
Blood Pressure & Cholesterol - Has high blood pressure (%)
Blood Pressure & Cholesterol - Checking blood pressure at home (%)
Blood Pressure & Cholesterol - Frequently checking blood cholesterol (%)
Blood Pressure & Cholesterol - Has high cholesterol level (%)
Consumer Behavior - Money monthly spent on food at supermarket/grocery store
Consumer Behavior - Money monthly spent on food at other stores
Consumer Behavior - Money monthly spent on eating out
Consumer Behavior - Money monthly spent on carryout/delivered foods
Consumer Behavior - Income spent on food at supermarket/grocery store (%)
Consumer Behavior - Income spent on food at other stores (%)
Consumer Behavior - Income spent on eating out (%)
Consumer Behavior - Income spent on carryout/delivered foods (%)
Current Health Status - General health condition (%)
Current Health Status - Blood donors (%)
Current Health Status - Has blood ever tested for HIV virus (%)
Current Health Status - Left-handed people (%)
Dermatology - People using sunscreen (%)
Diabetes - Diabetics (%)
Diabetes - Had a blood test for high blood sugar (%)
Diabetes - People taking insulin (%)
Diet Behavior & Nutrition - Diet health (%)
Diet Behavior & Nutrition - Milk product consumption (# of products/month)
Diet Behavior & Nutrition - Meals not home prepared (#/week)
Diet Behavior & Nutrition - Meals from fast food or pizza place (#/week)
Diet Behavior & Nutrition - Ready-to-eat foods (#/month)
Diet Behavior & Nutrition - Frozen meals/pizza (#/month)
Drug Use - People that ever used marijuana or hashish (%)
Drug Use - Ever used hard drugs (%)
Drug Use - Ever used any form of cocaine (%)
Drug Use - Ever used heroin (%)
Drug Use - Ever used methamphetamine (%)
Health Insurance - People covered by health insurance (%)
Kidney Conditions-Urology - Avg. # of times urinating at night
Medical Conditions - People with asthma (%)
Medical Conditions - People with anemia (%)
Medical Conditions - People with psoriasis (%)
Medical Conditions - People with overweight (%)
Medical Conditions - Elderly people having difficulties in thinking or remembering (%)
Medical Conditions - People who ever received blood transfusion (%)
Medical Conditions - People having trouble seeing even with glass/contacts (%)
Medical Conditions - People with arthritis (%)
Medical Conditions - People with gout (%)
Medical Conditions - People with congestive heart failure (%)
Medical Conditions - People with coronary heart disease (%)
Medical Conditions - People with angina pectoris (%)
Medical Conditions - People who ever had heart attack (%)
Medical Conditions - People who ever had stroke (%)
Medical Conditions - People with emphysema (%)
Medical Conditions - People with thyroid problem (%)
Medical Conditions - People with chronic bronchitis (%)
Medical Conditions - People with any liver condition (%)
Medical Conditions - People who ever had cancer or malignancy (%)
Mental Health - People who have little interest in doing things (%)
Mental Health - People feeling down, depressed, or hopeless (%)
Mental Health - People who have trouble sleeping or sleeping too much (%)
Mental Health - People feeling tired or having little energy (%)
Mental Health - People with poor appetite or overeating (%)
Mental Health - People feeling bad about themself (%)
Mental Health - People who have trouble concentrating on things (%)
Mental Health - People moving or speaking slowly or too fast (%)
Mental Health - People having thoughts they would be better off dead (%)
Oral Health - Average years since last visit a dentist
Oral Health - People embarrassed because of mouth (%)
Oral Health - People with gum disease (%)
Oral Health - General health of teeth and gums (%)
Oral Health - Average days a week using dental floss/device
Oral Health - Average days a week using mouthwash for dental problem
Oral Health - Average number of teeth
Pesticide Use - Households using pesticides to control insects (%)
Pesticide Use - Households using pesticides to kill weeds (%)
Physical Activity - People doing vigorous-intensity work activities (%)
Physical Activity - People doing moderate-intensity work activities (%)
Physical Activity - People walking or bicycling (%)
Physical Activity - People doing vigorous-intensity recreational activities (%)
Physical Activity - People doing moderate-intensity recreational activities (%)
Physical Activity - Average hours a day doing sedentary activities
Physical Activity - Average hours a day watching TV or videos
Physical Activity - Average hours a day using computer
Physical Functioning - People having limitations keeping them from working (%)
Physical Functioning - People limited in amount of work they can do (%)
Physical Functioning - People that need special equipment to walk (%)
Physical Functioning - People experiencing confusion/memory problems (%)
Physical Functioning - People requiring special healthcare equipment (%)
Prescription Medications - Average number of prescription medicines taking
Preventive Aspirin Use - Adults 40+ taking low-dose aspirin (%)
Reproductive Health - Vaginal deliveries (%)
Reproductive Health - Cesarean deliveries (%)
Reproductive Health - Deliveries resulted in a live birth (%)
Reproductive Health - Pregnancies resulted in a delivery (%)
Reproductive Health - Women breastfeeding newborns (%)
Reproductive Health - Women that had a hysterectomy (%)
Reproductive Health - Women that had both ovaries removed (%)
Reproductive Health - Women that have ever taken birth control pills (%)
Reproductive Health - Women taking birth control pills (%)
Reproductive Health - Women that have ever used Depo-Provera or injectables (%)
Reproductive Health - Women that have ever used female hormones (%)
Sexual Behavior - People 18+ that ever had sex (vaginal, anal, or oral) (%)
Sexual Behavior - Males 18+ that ever had vaginal sex with a woman (%)
Sexual Behavior - Males 18+ that ever performed oral sex on a woman (%)
Sexual Behavior - Males 18+ that ever had anal sex with a woman (%)
Sexual Behavior - Males 18+ that ever had any sex with a man (%)
Sexual Behavior - Females 18+ that ever had vaginal sex with a man (%)
Sexual Behavior - Females 18+ that ever performed oral sex on a man (%)
Sexual Behavior - Females 18+ that ever had anal sex with a man (%)
Sexual Behavior - Females 18+ that ever had any kind of sex with a woman (%)
Sexual Behavior - Average age people first had sex
Sexual Behavior - Average number of female sex partners in lifetime (males 18+)
Sexual Behavior - Average number of female vaginal sex partners in lifetime (males 18+)
Sexual Behavior - Average age people first performed oral sex on a woman (18+)
Sexual Behavior - Average number of woman performed oral sex on in lifetime (18+)
Sexual Behavior - Average number of male sex partners in lifetime (males 18+)
Sexual Behavior - Average number of male anal sex partners in lifetime (males 18+)
Sexual Behavior - Average age people first performed oral sex on a man (18+)
Sexual Behavior - Average number of male oral sex partners in lifetime (18+)
Sexual Behavior - People using protection when performing oral sex (%)
Sexual Behavior - Average number of times people have vaginal or anal sex a year
Sexual Behavior - People having sex without condom (%)
Sexual Behavior - Average number of male sex partners in lifetime (females 18+)
Sexual Behavior - Average number of male vaginal sex partners in lifetime (females 18+)
Sexual Behavior - Average number of female sex partners in lifetime (females 18+)
Sexual Behavior - Circumcised males 18+ (%)
Sleep Disorders - Average hours sleeping at night
Sleep Disorders - People that has trouble sleeping (%)
Smoking-Cigarette Use - People smoking cigarettes (%)
Taste & Smell - People 40+ having problems with smell (%)
Taste & Smell - People 40+ having problems with taste (%)
Taste & Smell - People 40+ that ever had wisdom teeth removed (%)
Taste & Smell - People 40+ that ever had tonsils teeth removed (%)
Taste & Smell - People 40+ that ever had a loss of consciousness because of a head injury (%)
Taste & Smell - People 40+ that ever had a broken nose or other serious injury to face or skull (%)
Taste & Smell - People 40+ that ever had two or more sinus infections (%)
Weight - Average height (inches)
Weight - Average weight (pounds)
Weight - Average BMI
Weight - People that are obese (%)
Weight - People that ever were obese (%)
Weight - People trying to lose weight (%)
According to our research of Florida and other state lists, there were 116 registered sex offenders living in North Port, Florida as of April 26, 2024 . The ratio of all residents to sex offenders in North Port is 544 to 1.The ratio of registered sex offenders to all residents in this city is near the state average.
Officers per 1,000 residents here:
1.63Florida average:
2.33
Latest news from North Port, FL collected exclusively by city-data.com from local newspapers, TV, and radio stations
Ancestries: American (19.8%), German (10.1%), English (9.7%), Irish (6.9%), Italian (6.8%), Polish (3.7%).
Current Local Time:
Land area: 74.8 square miles.
Population density: 1,138 people per square mile (low).
8,382 residents are foreign born (5.3% Latin America , 2.8% Europe , 1.5% Asia ).
This city:
10.3%Florida:
21.1%
Median real estate property taxes paid for housing units with mortgages in 2022: $2,747 (0.8%)Median real estate property taxes paid for housing units with no mortgage in 2022: $3,046 (0.7%)
Nearest city with pop. 50,000+: Sarasota, FL
Nearest city with pop. 200,000+: St. Petersburg, FL
Nearest city with pop. 1,000,000+: Houston, TX
Nearest cities:
Latitude: 27.07 N, Longitude: 82.17 W
Daytime population change due to commuting: -21,321 (-25.1%)Workers who live and work in this city: 9,851 (26.9%)
Property values in North Port, FL
Single-family new house construction building permits:
2022: 2104 buildings , average cost: $348,1002021: 2013 buildings , average cost: $305,3002020: 1560 buildings , average cost: $243,9002019: 1317 buildings , average cost: $244,7002018: 1274 buildings , average cost: $295,7002017: 1064 buildings , average cost: $242,6002016: 890 buildings , average cost: $245,3002015: 851 buildings , average cost: $250,1002014: 557 buildings , average cost: $245,3002013: 313 buildings , average cost: $236,9002012: 206 buildings , average cost: $244,7002011: 94 buildings , average cost: $250,2002010: 63 buildings , average cost: $243,3002009: 42 buildings , average cost: $269,6002008: 131 buildings , average cost: $254,4002007: 452 buildings , average cost: $184,3002006: 2094 buildings , average cost: $130,5002005: 4641 buildings , average cost: $127,8002004: 3510 buildings , average cost: $123,4002003: 2054 buildings , average cost: $127,7002002: 1415 buildings , average cost: $134,6002001: 1168 buildings , average cost: $121,7002000: 835 buildings , average cost: $119,8001999: 621 buildings , average cost: $118,6001998: 460 buildings , average cost: $116,1001997: 399 buildings , average cost: $116,000Unemployment in December 2023:
Population change in the 1990s: +10,749 (+89.2%).
Most common occupations in North Port, FL (%)
Both Males Females
Building and grounds cleaning and maintenance occupations (5.9%)
Other sales and related occupations, including supervisors (5.1%)
Other office and administrative support workers, including supervisors (3.7%)
Retail sales workers, except cashiers (3.6%)
Secretaries and administrative assistants (3.2%)
Electrical equipment mechanics and other installation, maintenance, and repair workers, including supervisors (3.2%)
Construction traders workers except carpenters, electricians, painters, plumbers, and construction laborers (3.1%)
Building and grounds cleaning and maintenance occupations (7.9%)
Electrical equipment mechanics and other installation, maintenance, and repair workers, including supervisors (6.2%)
Construction traders workers except carpenters, electricians, painters, plumbers, and construction laborers (6.0%)
Other sales and related occupations, including supervisors (5.9%)
Carpenters (4.1%)
Retail sales workers, except cashiers (3.9%)
Vehicle and mobile equipment mechanics, installers, and repairers (3.8%)
Secretaries and administrative assistants (6.7%)
Other office and administrative support workers, including supervisors (6.5%)
Health technologists and technicians (5.5%)
Cashiers (4.9%)
Registered nurses (4.4%)
Other sales and related occupations, including supervisors (4.3%)
Financial clerks, except bookkeeping, accounting and auditing clerks (4.1%)
Tornado activity:
North Port-area historical tornado activity is near Florida state average. It is 13% greater than the overall U.S. average.
On 12/3/1971, a category F2 (max. wind speeds 113-157 mph) tornado 3.2 miles away from the North Port city center injured 5 people and caused between $50,000 and $500,000 in damages.
On 7/30/1968, a category F2 tornado 5.2 miles away from the city center killed 2 people and caused between $5000 and $50,000 in damages.
Earthquake activity:
North Port-area historical earthquake activity is significantly above Florida state average. It is 92% smaller than the overall U.S. average. On 9/10/2006 at 14:56:08, a magnitude 5.9 (5.9 MB, 5.5 MS, 5.8 MW, Class: Moderate, Intensity: VI - VII) earthquake occurred 281.3 miles away from North Port center On 3/31/1992 at 14:59:39, a magnitude 3.8 (3.8 MB, Depth: 3.1 mi, Class: Light, Intensity: II - III) earthquake occurred 231.8 miles away from the city center On 10/24/1997 at 08:35:17, a magnitude 4.9 (4.8 MB, 4.2 MS, 4.9 LG, Depth: 6.2 mi, Class: Light, Intensity: IV - V) earthquake occurred 416.7 miles away from the city center On 6/23/2016 at 17:20:29, a magnitude 3.8 (3.8 ML) earthquake occurred 261.5 miles away from the city center On 9/4/2016 at 18:29:29, a magnitude 3.8 (3.8 ML) earthquake occurred 263.5 miles away from North Port center On 9/21/2016 at 16:30:52, a magnitude 3.8 (3.8 ML) earthquake occurred 263.7 miles away from the city center Magnitude types: regional Lg-wave magnitude (LG), body-wave magnitude (MB), local magnitude (ML), surface-wave magnitude (MS), moment magnitude (MW) Natural disasters: The number of natural disasters in Sarasota County (27) is a lot greater than the US average (15).Major Disasters (Presidential) Declared: 17Emergencies Declared: 5Hurricanes: 10, Tropical Storms: 6, Fires: 5, Floods: 5, Storms: 4, Tornadoes: 2, Freeze: 1, Wind: 1, Other: 1 (Note: some incidents may be assigned to more than one category). Hospitals and medical centers in North Port: QUALITY HEALTH OF NORTH PORT (6940 OUTREACH WAY)
PALM BREEZE DIALYSIS (14942 TAMIAMI TRAIL SUITE G)
PEACE RIVER HOME HEALTH SERVICE (15121 TAMIAMI TRAIL, STE F)
Amtrak station near North Port: 9 miles: PORT CHARLOTTE (909 KINGS HWY.) - Bus Station Services: public payphones.
Colleges/universities with over 2000 students nearest to North Port:
State College of Florida-Manatee-Sarasota (about 37 miles; Bradenton, FL ; Full-time enrollment: 8,012)
Edison State College (about 40 miles; Fort Myers, FL ; FT enrollment: 10,649)
Florida Gulf Coast University (about 49 miles; Fort Myers, FL ; FT enrollment: 11,165)
Eckerd College (about 56 miles; Saint Petersburg, FL ; FT enrollment: 2,437)
University of South Florida-St Petersburg (about 56 miles; St. Petersburg, FL ; FT enrollment: 4,459)
Hodges University (about 61 miles; Naples, FL ; FT enrollment: 2,132)
Hillsborough Community College (about 63 miles; Tampa, FL ; FT enrollment: 19,838)
Public high schools in North Port:
Public elementary/middle schools in North Port: HERON CREEK MIDDLE SCHOOL Students: 1,155, Location: 6501 W PRICE BLVD, Grades: 6-8)WOODLAND MIDDLE SCHOOL Students: 718, Location: 2700 PANACEA BLVD, Grades: 6-8)LAMARQUE ELEMENTARY SCHOOL Students: 500, Location: 3415 LAMARQUE AVE, Grades: PK-5)CRANBERRY ELEMENTARY SCHOOL Students: 378, Location: 2775 SHALIMAR TER, Grades: PK-5)GLENALLEN ELEMENTARY SCHOOL Students: 359, Location: 7050 GLENALLEN BLVD, Grades: PK-5)ATWATER ELEMENTARY Students: 320, Location: 4701 HUNTSVILLE AVE, Grades: PK-5)TOLEDO BLADE ELEMENTARY SCHOOL Students: 319, Location: 1201 GERANIUM AVE, Grades: PK-5)See full list of schools located in North Port User-submitted facts and corrections:
north port middle school, cranberry elementary school.
On the opening screen,you show a map with some route numbers.Shouldn't the 45 really be 41?Thank you.
Sarasota County has a predicted average indoor radon screening level less than 2 pCi/L (pico curies per liter) - Low Potential Drinking water stations with addresses in North Port and their reported violations in the past:
HUNGARIAN CHRISTIAN SOCIETY (Population served: 100, Groundwater):
Past monitoring violations:
One routine major monitoring violation
Average household size: This city:
2.5 peopleFlorida:
2.5 people
Percentage of family households: This city:
72.2%Whole state:
65.2%
Percentage of households with unmarried partners: This city:
8.2%Whole state:
7.3%
Likely homosexual households (counted as self-reported same-sex unmarried-partner households)
Lesbian couples: 0.5% of all households Gay men: 0.4% of all households
People in group quarters in North Port in 2010:
100 people in nursing facilities/skilled-nursing facilities
17 people in group homes intended for adults
2 people in other noninstitutional facilities
people in nursing homes in 2000Banks with most branches in North Port (2011 data):
Regions Bank: North Port Branch at 15000 Tamiami Trail, branch established on 2001/03/19; Heron Creek Branch at 1339 N. Sumter Blvd, branch established on 2006/08/07. Info updated 2011/02/24: Bank assets: $123,368.2 mil, Deposits: $98,301.3 mil, headquarters in Birmingham, AL, positive income , Commercial Lending Specialization, 1778 total offices , Holding Company: Regions Financial Corporation
SunTrust Bank: North Port Branch at 5900 North Port Boulevard, branch established on 1993/04/01; North Port Wal-Mart Branch at 17000 Tamiami Trail, branch established on 2006/06/14. Info updated 2010/05/27: Bank assets: $171,291.7 mil, Deposits: $129,833.2 mil, headquarters in Atlanta, GA, positive income , Commercial Lending Specialization, 1716 total offices , Holding Company: Suntrust Banks, Inc.
JPMorgan Chase Bank, National Association: North Port Banking Center at 17499 Tamiami Trail, branch established on 2011/11/08. Info updated 2011/11/10: Bank assets: $1,811,678.0 mil, Deposits: $1,190,738.0 mil, headquarters in Columbus, OH, positive income , International Specialization, 5577 total offices , Holding Company: Jpmorgan Chase & Co.
Calusa National Bank: North Port Office Branch at 14942 Tamiami Trail, branch established on 2008/10/09. Info updated 2010/10/01: Bank assets: $149.4 mil, Deposits: $130.9 mil, headquarters in Punta Gorda, FL, positive income , Commercial Lending Specialization, 4 total offices , Holding Company: Calusa Financial Corporation, Inc.
Fifth Third Bank: North Port Branch at 12767 South Tamiami Trail, branch established on 1989/12/01. Info updated 2009/10/05: Bank assets: $114,540.4 mil, Deposits: $89,689.1 mil, headquarters in Cincinnati, OH, positive income , Commercial Lending Specialization, 1378 total offices , Holding Company: Fifth Third Bancorp
Busey Bank: North Port Office at 14803 Tamiami Trail, branch established on 1999/06/01. Info updated 2010/01/25: Bank assets: $3,345.6 mil, Deposits: $2,767.4 mil, headquarters in Champaign, IL, positive income , Commercial Lending Specialization, 49 total offices , Holding Company: First Busey Corporation
Wells Fargo Bank, National Association: North Port Branch at 13675 South Tamiami Trail, branch established on 1971/10/12. Info updated 2011/04/05: Bank assets: $1,161,490.0 mil, Deposits: $905,653.0 mil, headquarters in Sioux Falls, SD, positive income , 6395 total offices , Holding Company: Wells Fargo & Company
Florida Community Bank, National Association: North Port Branch at 4300 Aidan Lane, branch established on 2009/03/06. Info updated 2012/02/13: Bank assets: $3,354.7 mil, Deposits: $2,512.2 mil, headquarters in Fort Lauderdale, FL, negative income in the last year , Commercial Lending Specialization, 46 total offices , Holding Company: Bond Street Management, Llc
Bank of America, National Association: North Port Branch at 14299 Tamiami Trail South, branch established on 1986/12/22. Info updated 2009/11/18: Bank assets: $1,451,969.3 mil, Deposits: $1,077,176.8 mil, headquarters in Charlotte, NC, positive income , 5782 total offices , Holding Company: Bank Of America Corporation
For population 15 years and over in North Port:
Never married: 24.4%Now married: 55.3%Separated: 2.1%Widowed: 5.9%Divorced: 12.3% For population 25 years and over in North Port:
High school or higher: 93.4%Bachelor's degree or higher: 25.4%Graduate or professional degree: 10.0%Unemployed: 3.4%Mean travel time to work (commute): 30.0 minutes
Education Gini index (Inequality in education) Here:
9.7Florida average:
12.2
Religion statistics for North Port, FL (based on Sarasota County data)
Religion Adherents Congregations Catholic 76,000 13 Evangelical Protestant 46,290 174 Mainline Protestant 31,191 58 Other 9,089 38 Black Protestant 1,901 7 Orthodox 620 2 None 214,357 -
Source: Clifford Grammich, Kirk Hadaway, Richard Houseal, Dale E.Jones, Alexei Krindatch, Richie Stanley and Richard H.Taylor. 2012. 2010 U.S.Religion Census: Religious Congregations & Membership Study. Association of Statisticians of American Religious Bodies. Jones, Dale E., et al. 2002. Congregations and Membership in the United States 2000. Nashville, TN: Glenmary Research Center. Graphs represent county-level data
Food Environment Statistics: Number of grocery stores : 67Sarasota County :
1.81 / 10,000 pop.Florida :
2.04 / 10,000 pop.
Number of supercenters and club stores : 3Sarasota County :
0.08 / 10,000 pop.Florida :
0.11 / 10,000 pop.
Number of convenience stores (no gas) : 47This county :
1.27 / 10,000 pop.State :
1.28 / 10,000 pop.
Number of convenience stores (with gas) : 84This county :
2.26 / 10,000 pop.State :
3.04 / 10,000 pop.
Number of full-service restaurants : 366Here :
9.87 / 10,000 pop.Florida :
7.45 / 10,000 pop.
Adult diabetes rate : This county :
9.1%Florida :
9.2%
Adult obesity rate : This county :
20.1%Florida :
23.7%
Low-income preschool obesity rate : Sarasota County :
12.4%State :
14.0%
Health and Nutrition: Healthy diet rate : North Port:
52.9%Florida:
51.4%
Average overall health of teeth and gums : North Port:
49.9%Florida:
49.4%
People feeling badly about themselves : North Port:
19.1%State:
19.5%
People not drinking alcohol at all : North Port:
10.7%Florida:
10.7%
Average hours sleeping at night : Overweight people : This city:
35.6%Florida:
34.7%
General health condition : This city:
57.7%Florida:
57.0%
Average condition of hearing : North Port:
77.0%State:
79.2%
More about Health and Nutrition of North Port, FL Residents
Local government employment and payroll (March 2022)
Function
Full-time employees
Monthly full-time payroll
Average yearly full-time wage
Part-time employees
Monthly part-time payroll
Police Protection - Officers
123 $889,914 $86,821 0 $0 Firefighters
110 $783,218 $85,442 0 $0 Streets and Highways
91 $402,816 $53,119 0 $0 Water Supply
67 $339,492 $60,805 0 $0 Other and Unallocable
61 $305,710 $60,140 0 $0 Parks and Recreation
46 $180,143 $46,994 37 $79,254 Other Government Administration
45 $264,292 $70,478 0 $0 Solid Waste Management
37 $173,805 $56,369 0 $0 Police - Other
35 $171,408 $58,768 2 $634 Financial Administration
29 $192,557 $79,679 0 $0 Fire - Other
17 $58,942 $41,606 0 $0 Sewerage
12 $48,814 $48,814 0 $0 Welfare
6 $22,697 $45,394 0 $0 Judicial and Legal
5 $49,531 $118,874 0 $0 Housing and Community Development (Local)
4 $22,427 $67,281 0 $0
Totals for Government
688 $3,905,766 $68,124 39 $79,888
North Port government finances - Expenditure in 2021 (per resident):
Construction - Regular Highways: $3,054,000 ($35.89)
General - Other: $189,000 ($2.22)Current Operations - Police Protection: $19,168,000 ($225.24)
Sewerage: $14,436,000 ($169.64)Financial Administration: $13,365,000 ($157.05)Regular Highways: $12,953,000 ($152.21)Local Fire Protection: $10,712,000 ($125.88)Solid Waste Management: $8,208,000 ($96.45)Health - Other: $7,364,000 ($86.53)Water Utilities: $6,868,000 ($80.71)Parks and Recreation: $5,424,000 ($63.74)Natural Resources - Other: $5,264,000 ($61.86)Protective Inspection and Regulation - Other: $3,732,000 ($43.85)Central Staff Services: $3,568,000 ($41.93)General - Other: $2,766,000 ($32.50)Judicial and Legal Services: $857,000 ($10.07)Public Welfare - Other: $434,000 ($5.10)General - Interest on Debt: $921,000 ($10.82)
Other Capital Outlay - Parks and Recreation: $4,050,000 ($47.59)
Natural Resources - Other: $2,528,000 ($29.71)Local Fire Protection: $899,000 ($10.56)Solid Waste Management: $730,000 ($8.58)Police Protection: $531,000 ($6.24)Sewerage: $288,000 ($3.38)Health - Other: $40,000 ($0.47)Water Utilities - Interest on Debt: $852,000 ($10.01)
North Port government finances - Revenue in 2021 (per resident):
Charges - Other: $21,730,000 ($255.35)
Regular Highways: $14,913,000 ($175.24)Sewerage: $12,105,000 ($142.25)Solid Waste Management: $9,891,000 ($116.23)Parks and Recreation: $1,581,000 ($18.58)Natural Resources - Other: $106,000 ($1.25)Federal Intergovernmental - Other: $1,947,000 ($22.88)
Highways: $215,000 ($2.53)Public Welfare: $8,000 ($0.09)Local Intergovernmental - Other: $42,182,000 ($495.68)
Miscellaneous - Special Assessments: $14,841,000 ($174.40)
Interest Earnings: $4,817,000 ($56.60)Fines and Forfeits: $274,000 ($3.22)Rents: $267,000 ($3.14)General Revenue - Other: $212,000 ($2.49)Sale of Property: $163,000 ($1.92)Donations From Private Sources: $162,000 ($1.90)Revenue - Water Utilities: $13,071,000 ($153.60)
State Intergovernmental - General Local Government Support: $8,796,000 ($103.36)
Other: $38,000 ($0.45)Tax - Property: $17,247,000 ($202.67)
General Sales and Gross Receipts: $10,735,000 ($126.15)Other License: $3,715,000 ($43.66)Occupation and Business License - Other: $3,636,000 ($42.73)Motor Fuels Sales: $3,122,000 ($36.69)Public Utilities Sales: $3,084,000 ($36.24)Insurance Premiums Sales: $1,918,000 ($22.54)Documentary and Stock Transfer: $158,000 ($1.86)
North Port government finances - Debt in 2021 (per resident):
Long Term Debt - Beginning Outstanding - Unspecified Public Purpose: $56,571,000 ($664.77)
Outstanding Unspecified Public Purpose: $53,501,000 ($628.69)Retired Unspecified Public Purpose: $5,608,000 ($65.90)
North Port government finances - Cash and Securities in 2021 (per resident):
Bond Funds - Cash and Securities: $26,706,000 ($313.82)
Other Funds - Cash and Securities: $136,412,000 ($1602.98)
Sinking Funds - Cash and Securities: $755,000 ($8.87)
11.25% of this county's 2021 resident taxpayers lived in other counties in 2020 ($164,585 average adjusted gross income )
Here:
11.25%Florida average:
8.80%
0.02% of residents moved from foreign countries ($156 average AGI )Sarasota County:
0.02%Florida average:
0.05%
Top counties from which taxpayers relocated into this county between 2020 and 2021:
7.51% of this county's 2020 resident taxpayers moved to other counties in 2021 ($100,435 average adjusted gross income )
Here:
7.51%Florida average:
7.45%
0.02% of residents moved to foreign countries ($122 average AGI )Sarasota County:
0.02%Florida average:
0.04%
Top counties to which taxpayers relocated from this county between 2020 and 2021:
Businesses in North Port, FL
Name Count Name Count
7-Eleven 2 KFC 1 Ace Hardware 1 Little Caesars Pizza 2 Advance Auto Parts 2 Lowe's 1 Applebee's 1 MasterBrand Cabinets 1 AutoZone 1 McDonald's 1 Blockbuster 1 Penske 1 Buffalo Wild Wings 1 Pizza Hut 1 Burger King 2 Publix Super Markets 3 CVS 1 RadioShack 1 Circle K 3 Subway 4 DHL 1 T-Mobile 1 Domino's Pizza 1 Taco Bell 1 FedEx 6 U-Haul 2 GNC 1 UPS 7 Goodwill 1 Walgreens 4 H&R Block 1 Walmart 1 Home Depot 1 YMCA 1
Strongest AM radio stations in North Port:
WAMR (1320 AM; 5 kW; VENICE, FL; Owner: CITICASTERS LICENSES, L.P.)
WKII (1070 AM; 3 kW; SOLANA, FL; Owner: CLEAR CHANNEL BROADCASTING LICENSES, INC.)
WWCN (770 AM; 10 kW; NORTH FORT MYERS, FL; Owner: WJPT LICENSE LIMITED PARTNERSHIP)
WPTK (1200 AM; 10 kW; PINE ISLAND CENTER, FL; Owner: FORT MYERS BROADCASTING COMPANY)
WMGG (820 AM; 50 kW; LARGO, FL; Owner: MEGA COMMUNICATIONS OF ST. PETERSBURG LICENSEE)
WQYK (1010 AM; 50 kW; SEFFNER, FL; Owner: INFINITY BROADCASTING CORPORATION OF TAMPA)
WFLF (540 AM; 50 kW; PINE HILLS, FL; Owner: CLEAR CHANNEL BROADCASTING LICENSES, INC.)
WLSS (930 AM; 5 kW; SARASOTA, FL; Owner: WGUL-FM, INC.)
WIBQ (1220 AM; 5 kW; SARASOTA, FL; Owner: NOVA BROADCASTING COMPANY)
WQTM (740 AM; 50 kW; ORLANDO, FL; Owner: CLEAR CHANNEL BROADCASTING LICENSES, INC.)
WJNA (640 AM; 38 kW; ROYAL PALM BEACH, FL; Owner: SOUTH FLORIDA RADIO, INC.)
WENG (1530 AM; daytime; 1 kW; ENGLEWOOD, FL)
WFLA (970 AM; 25 kW; TAMPA, FL; Owner: CITICASTERS LICENSES, L.P.)
Strongest FM radio stations in North Port:
WBCG (98.9 FM; MURDOCK, FL; Owner: CONCORD MEDIA GROUP, INC.)
WHPT (102.5 FM; SARASOTA, FL; Owner: CXR HOLDINGS, INC.)
WIKX (92.9 FM; CHARLOTTE HARBOR, FL; Owner: CITICASTERS LICENSES, L.P.)
WSMR (89.1 FM; SARASOTA, FL; Owner: NORTHWESTERN COLLEGE)
WINK-FM (96.9 FM; FORT MYERS, FL; Owner: FORT MYERS BROADCASTING COMPANY)
WDDV (92.1 FM; VENICE, FL; Owner: CITICASTERS LICENSES, L.P.)
WTZB (105.9 FM; ENGLEWOOD, FL; Owner: CITICASTERS LICENSES, L.P.)
WXKB (103.9 FM; CAPE CORAL, FL; Owner: WXKB LICENSE LIMITED PARTNERSHIP)
WJIS (88.1 FM; BRADENTON, FL; Owner: RADIO TRAINING NETWORK, INC.)
WRXK-FM (96.1 FM; BONITA SPRINGS, FL; Owner: WRXK LICENSE LIMITED PARTNERSHIP)
WVIJ (91.7 FM; PORT CHARLOTTE, FL; Owner: PORT CHARLOTTE EDUCATIONAL BROADCASTING FOUNDATION)
WCKT (100.1 FM; PORT CHARLOTTE, FL; Owner: CLEAR CHANNEL BROADCASTING LICENSES, INC.)
WZSP (105.3 FM; NOCATEE, FL; Owner: HEARTLAND BROADCASTING CORP.)
WCVU (104.9 FM; SOLANA, FL; Owner: CITICASTERS LICENSES, L.P.)
WSRZ-FM (107.9 FM; CORAL COVE, FL; Owner: CITICASTERS LICENSES, L.P.)
WSJT (94.1 FM; LAKELAND, FL; Owner: INFINITY RADIO OPERATIONS INC.)
WGCU-FM (90.1 FM; FT. MYERS, FL; Owner: BOARD OF TRUSTEES, FLORIDA GULF COAST UNIVERSITY)
WWRM (94.9 FM; TAMPA, FL; Owner: COX RADIO, INC.)
WPOI (101.5 FM; ST. PETERSBURG, FL; Owner: CXR HOLDINGS, INC.)
WSEB (91.3 FM; ENGLEWOOD, FL; Owner: SUNCOAST EDUCATIONAL B/CNG CORP.)
TV broadcast stations around North Port:
WVEA-TV (Channel 62; VENICE, FL; Owner: ENTRAVISION HOLDINGS, LLC)
W17CK (Channel 17; PORT CHARLOTTE, FL; Owner: TRINITY BROADCASTING NETWORK)
WINK-TV (Channel 11; FORT MYERS, FL; Owner: FORT MYERS BROADCASTING COMPANY)
WFTX (Channel 36; CAPE CORAL, FL; Owner: EMMIS TELEVISION LICENSE CORPORATION)
WTVK (Channel 46; NAPLES, FL; Owner: ACME TELEVISION LICENSES OF FLORIDA, LLC)
WBBH-TV (Channel 20; FORT MYERS, FL; Owner: WATERMAN BROADCASTING CORP. OF FLORIDA)
WRXY-TV (Channel 49; TICE, FL; Owner: WEST COAST CHRISTIAN TELEVISION, INC)
W56CN (Channel 56; VENICE, FL; Owner: WMOR-TV COMPANY)
WEDU (Channel 3; TAMPA, FL; Owner: FLORIDA WEST COAST PUBLIC BROADCASTING, INC.)
WGCU (Channel 30; FT. MYERS, FL; Owner: BOARD OF TRUSTEES, FLORIDA GULF COAST UNIVERSITY)
WXPX (Channel 66; BRADENTON, FL; Owner: PAXSON COMMUNICATION LICENSE COMPANY, LLC)
WTOG (Channel 44; ST. PETERSBURG, FL; Owner: VIACOM INTERNATIONAL INC.)
WFLA-TV (Channel 8; TAMPA, FL; Owner: MEDIA GENERAL COMMUNICATIONS, INC.)
WFTS-TV (Channel 28; TAMPA, FL; Owner: TAMPA BAY TELEVISION, INC.)
WTVT (Channel 13; TAMPA, FL; Owner: TVT LICENSE, INC.)
W48CN (Channel 48; SARASOTA, FL; Owner: NATIONAL MINORITY T.V., INC.)
WUSF-TV (Channel 16; TAMPA, FL; Owner: UNIVERSITY OF SOUTH FLORIDA)
WWSB (Channel 40; SARASOTA, FL; Owner: SOUTHERN BROADCAST CORPORATION OF SARASOTA)
National Bridge Inventory (NBI) Statistics 92 Number of bridges1,198ft / 365m Total length $983,000 Total costs1,129,484 Total average daily traffic113,679 Total average daily truck traffic
New bridges - historical statistics
8 1960-1969 22 1970-1979 41 1980-1989 11 1990-1999 5 2000-2009 5 2010-2019
See full National Bridge Inventory statistics for North Port, FL
Home Mortgage Disclosure Act Aggregated Statistics For Year 2009(Based on 3 full and 3 partial tracts) A) FHA, FSA/RHS & VA B) Conventional C) Refinancings D) Home Improvement Loans F) Non-occupant Loans on G) Loans On Manufactured Number Average Value Number Average Value Number Average Value Number Average Value Number Average Value Number Average Value
LOANS ORIGINATED 323 $109,350 453 $101,331 416 $143,166 15 $47,720 290 $102,305 10 $54,042 APPLICATIONS APPROVED, NOT ACCEPTED 20 $104,337 27 $91,512 59 $137,486 9 $43,983 20 $99,262 5 $63,558 APPLICATIONS DENIED 100 $106,880 102 $118,127 337 $157,332 29 $57,642 87 $118,392 17 $55,485 APPLICATIONS WITHDRAWN 42 $110,690 54 $98,966 174 $141,709 5 $39,748 40 $115,391 2 $80,980 FILES CLOSED FOR INCOMPLETENESS 22 $108,189 7 $86,850 38 $133,096 1 $37,770 5 $115,186 1 $42,000
Aggregated Statistics For Year 2008(Based on 3 full and 3 partial tracts) A) FHA, FSA/RHS & VA B) Conventional C) Refinancings D) Home Improvement Loans E) Loans on Dwellings For 5+ Families F) Non-occupant Loans on G) Loans On Manufactured Number Average Value Number Average Value Number Average Value Number Average Value Number Average Value Number Average Value Number Average Value
LOANS ORIGINATED 344 $133,649 607 $124,771 406 $141,667 31 $63,263 0 $0 313 $124,294 13 $59,548 APPLICATIONS APPROVED, NOT ACCEPTED 19 $141,423 81 $140,185 114 $152,782 17 $24,856 0 $0 54 $144,838 12 $59,776 APPLICATIONS DENIED 101 $155,655 146 $131,564 579 $177,010 91 $73,577 0 $0 158 $153,956 18 $56,770 APPLICATIONS WITHDRAWN 40 $137,650 80 $151,054 146 $169,091 13 $100,322 1 $430,690 38 $141,895 0 $0 FILES CLOSED FOR INCOMPLETENESS 21 $136,986 26 $123,662 54 $172,502 3 $126,640 0 $0 22 $156,928 0 $0
Aggregated Statistics For Year 2007(Based on 3 full and 3 partial tracts) A) FHA, FSA/RHS & VA B) Conventional C) Refinancings D) Home Improvement Loans F) Non-occupant Loans on G) Loans On Manufactured Number Average Value Number Average Value Number Average Value Number Average Value Number Average Value Number Average Value
LOANS ORIGINATED 141 $173,236 1,333 $165,576 1,362 $161,628 138 $79,435 587 $169,782 28 $62,067 APPLICATIONS APPROVED, NOT ACCEPTED 5 $162,352 240 $163,522 378 $164,139 59 $50,961 131 $167,157 13 $68,301 APPLICATIONS DENIED 38 $173,890 415 $177,246 1,366 $191,638 219 $88,314 269 $195,355 32 $73,582 APPLICATIONS WITHDRAWN 16 $167,419 165 $173,766 650 $186,336 43 $91,600 130 $179,411 2 $89,465 FILES CLOSED FOR INCOMPLETENESS 6 $150,130 73 $180,873 232 $190,852 13 $127,632 29 $205,000 0 $0
Aggregated Statistics For Year 2006(Based on 3 full and 3 partial tracts) A) FHA, FSA/RHS & VA B) Conventional C) Refinancings D) Home Improvement Loans E) Loans on Dwellings For 5+ Families F) Non-occupant Loans on G) Loans On Manufactured Number Average Value Number Average Value Number Average Value Number Average Value Number Average Value Number Average Value Number Average Value
LOANS ORIGINATED 158 $193,047 3,509 $165,425 2,418 $171,772 264 $99,141 2 $8,725,610 1,713 $179,724 34 $74,079 APPLICATIONS APPROVED, NOT ACCEPTED 7 $175,553 540 $173,328 473 $166,944 65 $63,386 1 $7,000 314 $183,143 21 $73,824 APPLICATIONS DENIED 30 $184,322 950 $169,342 1,352 $179,878 267 $87,161 1 $56,320 427 $180,439 33 $74,046 APPLICATIONS WITHDRAWN 6 $181,962 467 $179,862 947 $172,786 82 $133,110 1 $1,035,230 280 $186,733 4 $189,750 FILES CLOSED FOR INCOMPLETENESS 7 $183,791 142 $163,793 325 $181,901 22 $91,499 0 $0 48 $192,326 0 $0
Aggregated Statistics For Year 2005(Based on 3 full and 3 partial tracts) A) FHA, FSA/RHS & VA B) Conventional C) Refinancings D) Home Improvement Loans E) Loans on Dwellings For 5+ Families F) Non-occupant Loans on G) Loans On Manufactured Number Average Value Number Average Value Number Average Value Number Average Value Number Average Value Number Average Value Number Average Value
LOANS ORIGINATED 174 $163,797 4,781 $159,622 2,437 $157,205 305 $94,761 1 $7,510,990 2,313 $164,638 50 $70,577 APPLICATIONS APPROVED, NOT ACCEPTED 14 $170,870 521 $160,214 389 $149,657 72 $52,444 0 $0 271 $169,429 24 $72,396 APPLICATIONS DENIED 23 $160,102 769 $150,542 1,091 $151,760 351 $74,990 0 $0 315 $153,951 42 $71,463 APPLICATIONS WITHDRAWN 11 $144,615 451 $166,240 876 $151,712 122 $128,564 0 $0 201 $170,950 7 $123,621 FILES CLOSED FOR INCOMPLETENESS 5 $151,134 145 $162,294 529 $158,456 30 $102,395 0 $0 65 $163,393 0 $0
Aggregated Statistics For Year 2004(Based on 3 full and 3 partial tracts) A) FHA, FSA/RHS & VA B) Conventional C) Refinancings D) Home Improvement Loans F) Non-occupant Loans on G) Loans On Manufactured Number Average Value Number Average Value Number Average Value Number Average Value Number Average Value Number Average Value
LOANS ORIGINATED 388 $138,211 2,674 $130,663 1,623 $119,328 176 $60,877 884 $131,865 77 $57,081 APPLICATIONS APPROVED, NOT ACCEPTED 22 $130,515 346 $128,274 348 $117,110 52 $51,269 127 $125,592 40 $53,933 APPLICATIONS DENIED 48 $138,491 406 $126,581 988 $117,039 291 $40,609 131 $120,875 44 $55,800 APPLICATIONS WITHDRAWN 26 $141,973 237 $140,084 615 $120,771 56 $67,505 87 $141,667 4 $70,005 FILES CLOSED FOR INCOMPLETENESS 8 $137,736 77 $126,102 330 $124,768 19 $44,841 28 $114,437 1 $60,000
Aggregated Statistics For Year 2003(Based on 3 full and 3 partial tracts) A) FHA, FSA/RHS & VA B) Conventional C) Refinancings D) Home Improvement Loans E) Loans on Dwellings For 5+ Families F) Non-occupant Loans on Number Average Value Number Average Value Number Average Value Number Average Value Number Average Value Number Average Value
LOANS ORIGINATED 388 $122,723 1,536 $111,681 2,125 $103,594 86 $31,832 2 $4,898,970 499 $109,969 APPLICATIONS APPROVED, NOT ACCEPTED 19 $121,069 165 $112,312 327 $101,272 39 $33,609 0 $0 44 $119,938 APPLICATIONS DENIED 56 $115,886 200 $112,643 1,069 $97,652 140 $29,437 0 $0 84 $101,997 APPLICATIONS WITHDRAWN 32 $107,525 161 $114,324 453 $100,863 16 $29,558 0 $0 49 $110,770 FILES CLOSED FOR INCOMPLETENESS 7 $103,983 37 $111,402 96 $115,449 6 $35,108 0 $0 12 $156,947
Aggregated Statistics For Year 2002(Based on 2 partial tracts) A) FHA, FSA/RHS & VA B) Conventional C) Refinancings D) Home Improvement Loans F) Non-occupant Loans on Number Average Value Number Average Value Number Average Value Number Average Value Number Average Value
LOANS ORIGINATED 52 $92,502 222 $78,165 199 $106,056 19 $20,045 77 $68,020 APPLICATIONS APPROVED, NOT ACCEPTED 4 $110,655 34 $66,502 39 $61,723 5 $11,316 11 $65,030 APPLICATIONS DENIED 9 $88,789 50 $79,848 124 $70,530 35 $18,912 26 $54,756 APPLICATIONS WITHDRAWN 1 $58,310 24 $88,559 56 $68,662 4 $31,080 4 $69,018 FILES CLOSED FOR INCOMPLETENESS 4 $93,095 3 $223,517 28 $88,049 1 $74,210 1 $23,190
Aggregated Statistics For Year 2001(Based on 2 partial tracts) A) FHA, FSA/RHS & VA B) Conventional C) Refinancings D) Home Improvement Loans F) Non-occupant Loans on Number Average Value Number Average Value Number Average Value Number Average Value Number Average Value
LOANS ORIGINATED 71 $75,685 158 $71,049 149 $62,788 21 $12,274 58 $56,491 APPLICATIONS APPROVED, NOT ACCEPTED 1 $96,080 21 $53,383 32 $58,251 6 $13,355 4 $45,722 APPLICATIONS DENIED 6 $86,387 31 $59,783 132 $59,131 31 $11,424 8 $73,230 APPLICATIONS WITHDRAWN 4 $100,118 13 $82,740 52 $71,256 4 $14,195 4 $50,118 FILES CLOSED FOR INCOMPLETENESS 2 $62,285 4 $62,872 11 $64,148 2 $13,585 2 $31,960
Aggregated Statistics For Year 2000(Based on 2 partial tracts) A) FHA, FSA/RHS & VA B) Conventional C) Refinancings D) Home Improvement Loans F) Non-occupant Loans on Number Average Value Number Average Value Number Average Value Number Average Value Number Average Value
LOANS ORIGINATED 65 $66,855 113 $59,452 56 $53,133 24 $18,755 37 $54,965 APPLICATIONS APPROVED, NOT ACCEPTED 4 $54,908 30 $54,178 20 $51,276 9 $11,639 7 $42,571 APPLICATIONS DENIED 9 $68,097 41 $59,537 86 $42,637 32 $15,879 9 $49,611 APPLICATIONS WITHDRAWN 4 $101,722 14 $66,426 59 $44,040 4 $24,020 2 $38,995 FILES CLOSED FOR INCOMPLETENESS 1 $88,130 5 $64,264 6 $51,387 1 $11,520 1 $81,500
Aggregated Statistics For Year 1999(Based on 2 full and 3 partial tracts) A) FHA, FSA/RHS & VA B) Conventional C) Refinancings D) Home Improvement Loans E) Loans on Dwellings For 5+ Families F) Non-occupant Loans on Number Average Value Number Average Value Number Average Value Number Average Value Number Average Value Number Average Value
LOANS ORIGINATED 434 $216,406 507 $84,434 374 $63,856 61 $16,242 0 $0 135 $74,318 APPLICATIONS APPROVED, NOT ACCEPTED 9 $86,751 63 $65,796 108 $60,379 41 $21,893 0 $0 14 $54,084 APPLICATIONS DENIED 17 $81,458 101 $76,420 386 $58,513 132 $19,630 0 $0 21 $74,588 APPLICATIONS WITHDRAWN 12 $88,408 49 $81,893 198 $66,041 21 $37,309 1 $10,438,050 8 $64,933 FILES CLOSED FOR INCOMPLETENESS 11 $77,985 13 $100,228 29 $63,208 4 $18,115 0 $0 3 $55,310
Detailed HMDA statistics for the following Tracts:
0027.01
, 0027.03 , 0027.10 , 0027.11 , 0027.12 , 0027.18
Private Mortgage Insurance Companies Aggregated Statistics For Year 2009(Based on 3 full and 2 partial tracts) A) Conventional B) Refinancings C) Non-occupant Loans on Number Average Value Number Average Value Number Average Value
LOANS ORIGINATED 25 $110,314 1 $129,870 5 $93,578 APPLICATIONS APPROVED, NOT ACCEPTED 19 $185,359 7 $203,353 8 $211,601 APPLICATIONS DENIED 9 $130,389 2 $194,475 5 $109,714 APPLICATIONS WITHDRAWN 2 $223,980 2 $163,660 1 $231,910 FILES CLOSED FOR INCOMPLETENESS 3 $151,117 0 $0 1 $253,900
Aggregated Statistics For Year 2008(Based on 3 full and 3 partial tracts) A) Conventional B) Refinancings C) Non-occupant Loans on Number Average Value Number Average Value Number Average Value
LOANS ORIGINATED 183 $147,034 32 $183,516 65 $155,234 APPLICATIONS APPROVED, NOT ACCEPTED 101 $207,969 67 $206,408 55 $246,536 APPLICATIONS DENIED 31 $198,928 9 $151,126 23 $204,160 APPLICATIONS WITHDRAWN 17 $151,756 9 $158,797 8 $173,636 FILES CLOSED FOR INCOMPLETENESS 5 $192,124 7 $212,850 9 $201,091
Aggregated Statistics For Year 2007(Based on 3 full and 3 partial tracts) A) Conventional B) Refinancings C) Non-occupant Loans on D) Loans On Manufactured Number Average Value Number Average Value Number Average Value Number Average Value
LOANS ORIGINATED 427 $197,468 189 $224,067 154 $208,347 0 $0 APPLICATIONS APPROVED, NOT ACCEPTED 80 $216,142 56 $224,332 42 $231,701 1 $103,230 APPLICATIONS DENIED 15 $234,663 8 $290,016 11 $230,638 0 $0 APPLICATIONS WITHDRAWN 21 $226,023 25 $221,881 15 $219,683 0 $0 FILES CLOSED FOR INCOMPLETENESS 2 $242,480 3 $191,863 1 $233,910 0 $0
Aggregated Statistics For Year 2006(Based on 3 full and 3 partial tracts) A) Conventional B) Refinancings C) Non-occupant Loans on Number Average Value Number Average Value Number Average Value
LOANS ORIGINATED 465 $212,371 110 $217,608 194 $207,673 APPLICATIONS APPROVED, NOT ACCEPTED 113 $227,632 31 $231,043 65 $213,016 APPLICATIONS DENIED 8 $237,491 1 $139,150 6 $245,017 APPLICATIONS WITHDRAWN 30 $257,223 8 $219,718 16 $249,948 FILES CLOSED FOR INCOMPLETENESS 1 $178,930 1 $197,920 0 $0
Aggregated Statistics For Year 2005(Based on 3 full and 3 partial tracts) A) Conventional B) Refinancings C) Non-occupant Loans on Number Average Value Number Average Value Number Average Value
LOANS ORIGINATED 610 $182,290 100 $188,398 267 $170,924 APPLICATIONS APPROVED, NOT ACCEPTED 151 $188,656 42 $184,789 69 $183,506 APPLICATIONS DENIED 8 $237,686 6 $196,567 9 $175,697 APPLICATIONS WITHDRAWN 36 $178,786 13 $177,175 18 $183,736 FILES CLOSED FOR INCOMPLETENESS 5 $205,146 1 $283,890 3 $222,937
Aggregated Statistics For Year 2004(Based on 3 full and 3 partial tracts) A) Conventional B) Refinancings C) Non-occupant Loans on Number Average Value Number Average Value Number Average Value
LOANS ORIGINATED 435 $145,207 95 $138,518 150 $130,625 APPLICATIONS APPROVED, NOT ACCEPTED 100 $172,410 30 $146,129 40 $162,394 APPLICATIONS DENIED 13 $166,951 2 $137,155 7 $149,794 APPLICATIONS WITHDRAWN 25 $163,381 7 $134,126 5 $165,748 FILES CLOSED FOR INCOMPLETENESS 1 $59,630 1 $65,000 1 $59,630
Aggregated Statistics For Year 2003(Based on 3 full and 3 partial tracts) A) Conventional B) Refinancings C) Non-occupant Loans on Number Average Value Number Average Value Number Average Value
LOANS ORIGINATED 353 $124,580 172 $121,672 97 $123,226 APPLICATIONS APPROVED, NOT ACCEPTED 94 $156,972 52 $119,942 27 $195,617 APPLICATIONS DENIED 12 $124,342 4 $142,162 6 $98,900 APPLICATIONS WITHDRAWN 17 $127,475 12 $110,507 3 $143,050 FILES CLOSED FOR INCOMPLETENESS 0 $0 1 $137,000 0 $0
Aggregated Statistics For Year 2002(Based on 2 partial tracts) A) Conventional B) Refinancings C) Non-occupant Loans on Number Average Value Number Average Value Number Average Value
LOANS ORIGINATED 52 $82,710 18 $81,716 20 $71,180 APPLICATIONS APPROVED, NOT ACCEPTED 7 $101,524 11 $88,125 2 $66,590 APPLICATIONS DENIED 1 $131,190 0 $0 1 $43,070 APPLICATIONS WITHDRAWN 3 $68,910 3 $85,253 2 $69,905 FILES CLOSED FOR INCOMPLETENESS 0 $0 0 $0 0 $0
Aggregated Statistics For Year 2001(Based on 2 partial tracts) A) Conventional B) Refinancings C) Non-occupant Loans on Number Average Value Number Average Value Number Average Value
LOANS ORIGINATED 42 $79,865 15 $82,843 9 $70,661 APPLICATIONS APPROVED, NOT ACCEPTED 4 $91,992 0 $0 1 $35,120 APPLICATIONS DENIED 1 $107,340 0 $0 0 $0 APPLICATIONS WITHDRAWN 1 $108,670 1 $147,100 0 $0 FILES CLOSED FOR INCOMPLETENESS 0 $0 0 $0 0 $0
Aggregated Statistics For Year 2000(Based on 2 partial tracts) A) Conventional B) Refinancings C) Non-occupant Loans on Number Average Value Number Average Value Number Average Value
LOANS ORIGINATED 27 $70,750 4 $60,972 9 $65,560 APPLICATIONS APPROVED, NOT ACCEPTED 3 $115,293 0 $0 0 $0 APPLICATIONS DENIED 2 $70,415 0 $0 0 $0 APPLICATIONS WITHDRAWN 0 $0 0 $0 0 $0 FILES CLOSED FOR INCOMPLETENESS 0 $0 0 $0 0 $0
Aggregated Statistics For Year 1999(Based on 2 full and 3 partial tracts) A) Conventional B) Refinancings C) Non-occupant Loans on Number Average Value Number Average Value Number Average Value
LOANS ORIGINATED 90 $92,836 21 $81,591 19 $70,091 APPLICATIONS APPROVED, NOT ACCEPTED 9 $104,171 2 $94,790 2 $49,565 APPLICATIONS DENIED 6 $134,197 3 $59,497 2 $78,910 APPLICATIONS WITHDRAWN 3 $80,513 3 $78,740 1 $20,250 FILES CLOSED FOR INCOMPLETENESS 0 $0 0 $0 0 $0
Detailed PMIC statistics for the following Tracts:
0027.01
, 0027.03 , 0027.10 , 0027.11 , 0027.12 , 0027.18
Most common first names in North Port, FL among deceased individuals Name Count Lived (average)
John 193 78.4 years Robert 160 75.0 years William 154 76.8 years Mary 124 80.6 years James 120 73.2 years Charles 103 77.2 years Joseph 99 79.2 years George 99 79.5 years Helen 75 82.4 years Richard 72 72.9 years
Most common last names in North Port, FL among deceased individuals Last name Count Lived (average)
Smith 47 78.3 years Brown 34 77.2 years Miller 34 76.9 years Johnson 30 78.4 years Williams 27 77.3 years Jones 23 70.9 years Davis 20 80.4 years Taylor 17 78.5 years Anderson 17 79.7 years Reynolds 15 74.8 years
North Port compared to Florida state average:
Unemployed percentage significantly below state average. Hispanic race population percentage above state average. Foreign-born population percentage above state average. Length of stay since moving in below state average. House age significantly below state average. Number of college students above state average. North Port on our top lists :
#2 on the list of "Top 101 cities with largest percentage of females in occupations: healthcare support occupations (population 50,000+)"
#7 on the list of "Top 101 cities with largest percentage of males in occupations: health technologists and technicians (population 50,000+)"
#8 on the list of "Top 101 cities with largest percentage of males in industries: administrative and support and waste management services (population 50,000+)"
#10 on the list of "Top 101 cities with the largest percentage population increase from 2000 (population 50,000+)"
#14 on the list of "Top 101 cities with the most people born in other U.S. states (population 50,000+)"
#14 on the list of "Top 101 cities with largest percentage of males in occupations: fire fighting and prevention workers including supervisors (population 50,000+)"
#16 on the list of "Top 100 fastest growing cities from 2000 to 2014 (pop. 50,000+)"
#16 on the list of "Top 101 cities with the highest ratio of rapes to murders between 2002 and 2012 (population 50,000+)"
#17 on the list of "Top 101 cities with largest percentage of females in industries: construction (population 50,000+)"
#20 on the list of "Top 101 cities with largest percentage of males in occupations: installation, maintenance, and repair occupations (population 50,000+)"
#21 on the list of "Top 101 cities with the most users submitting photos to our site per 10,000 residents (population 50,000+)"
#30 on the list of "Top 101 cities with the largest city-data.com crime index increase from 2002 to 2012 (population 50,000+)"
#33 on the list of "Top 101 cities with largest percentage of females in industries: health care and social assistance (population 50,000+)"
#37 on the list of "Top 101 cities with largest percentage population increases in the 1990s) (population 50,000+)"
#37 on the list of "Top 101 cities with largest percentage of females in occupations: health technologists and technicians (population 50,000+)"
#40 on the list of "Top 101 cities that people commute from (largest negative percentage daily daytime population change due to commuting) (population 50,000+)"
#41 on the list of "Top 101 cities with most building permits per 10,000 residents (population 50,000+)"
#41 on the list of "Top 100 cities with newest houses (pop. 50,000+)"
#43 on the list of "Top 101 cities with largest percentage of females in occupations: sales and related occupations (population 50,000+)"
#44 on the list of "Top 101 cities with the most people taking a motorcycle to work (population 5,000+)"
#20 (34292) on the list of "Top 101 zip codes with the smallest percentage of returns reporting salary or wage in 2012 (pop 5,000+)"
#2 on the list of "Top 101 counties with the largest number of people without health insurance coverage in 2000 (pop. 50,000+)"
#4 on the list of "Top 101 counties with the largest decrease in the number of infant deaths per 1000 residents 2000-2006 to 2007-2013 (pop. 50,000+)"
#5 on the list of "Top 101 counties with the lowest number of births per 1000 residents 2007-2013"
#6 on the list of "Top 101 counties with the lowest number of infant deaths per 1000 residents 2007-2013 (pop. 50,000+)"
#16 on the list of "Top 101 counties with the highest number of deaths per 1000 residents 2007-2013 (pop. 50,000+)"
Top Patent Applicants
Joseph Kuczynski (77)
Mark Allan Lewandowski (26)
Jeffrey L. Tate (14)
Gary A. Burgo Sr. (5)
Mark Lewandowski (3)
James L. Larrauri (2)
Joseph P. Kuczynski (2)
Steve Wharton (2)
Stanlee Meisinger (2)
Jaroslaw T. Malkowski (2)
Total of 159 patent applications in 2008-2024.


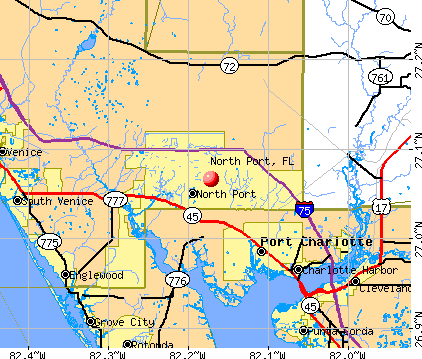


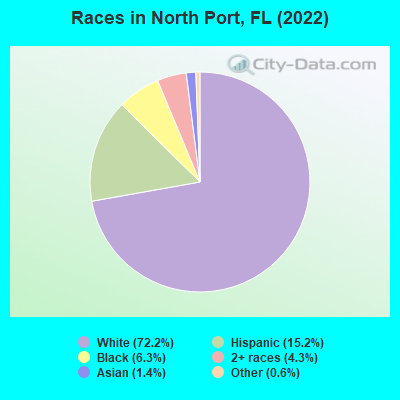
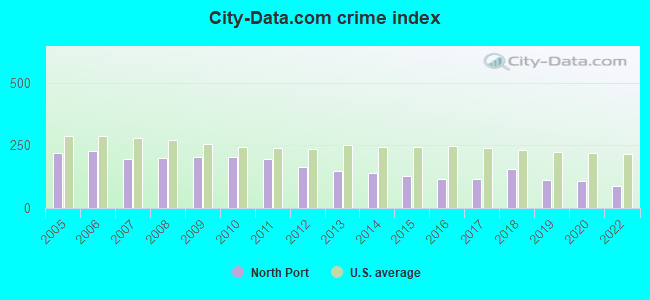
 Recent articles from our blog. Our writers, many of them Ph.D. graduates or candidates, create easy-to-read articles on a wide variety of topics.


 (29.2 miles
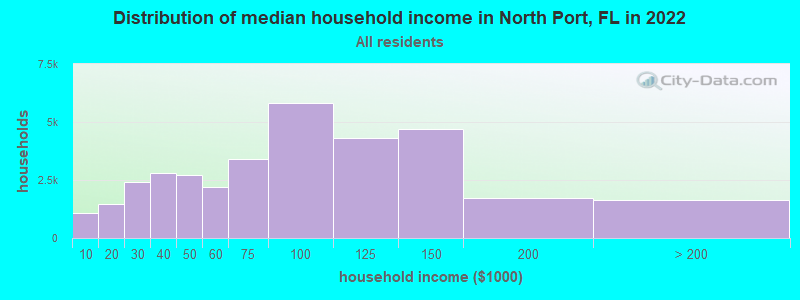
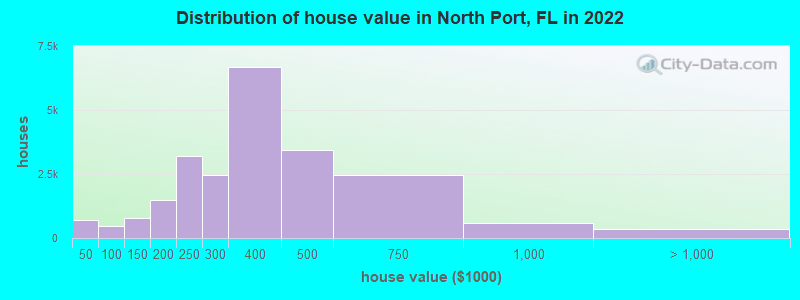
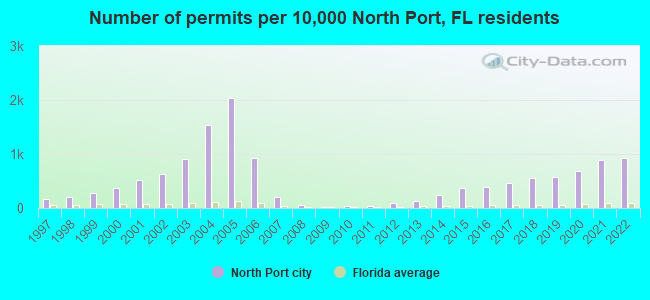
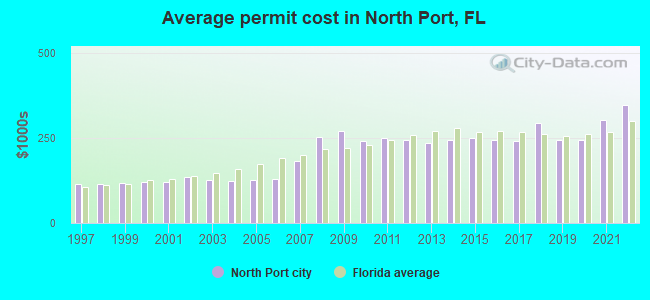
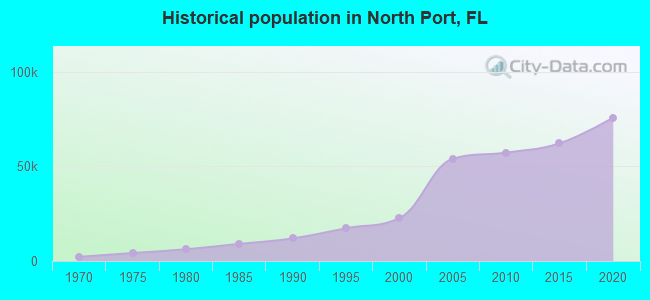
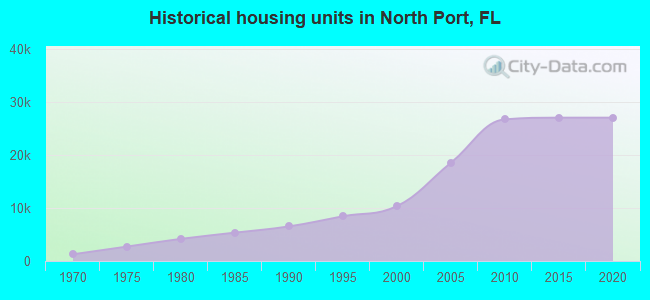
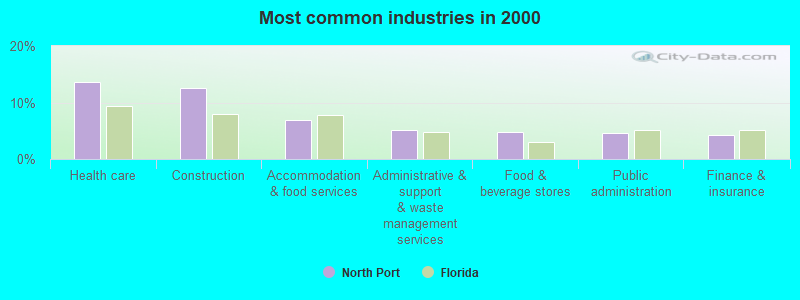
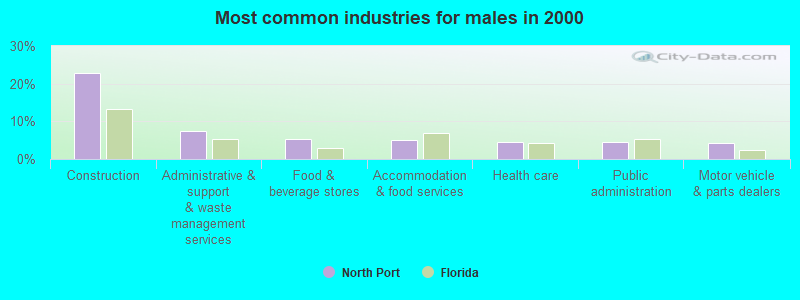
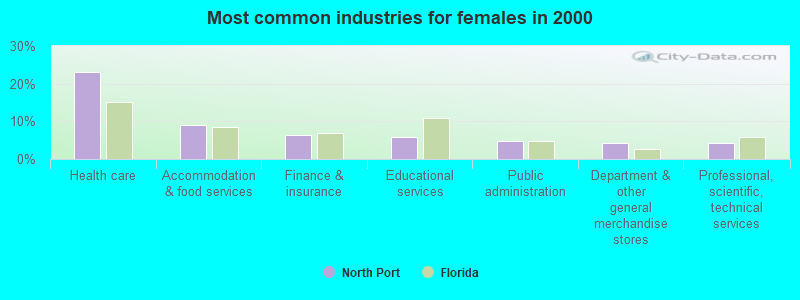
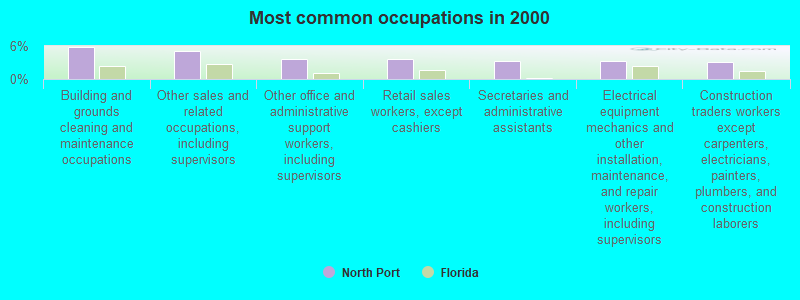
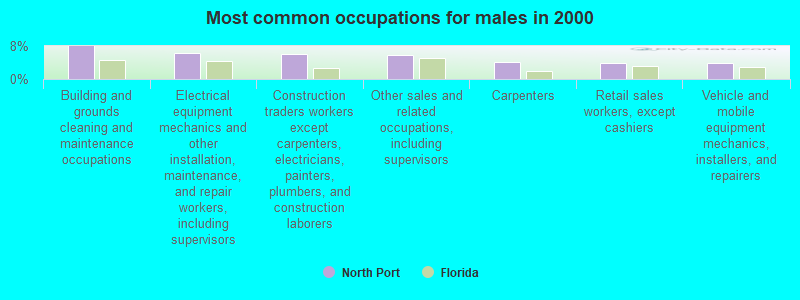


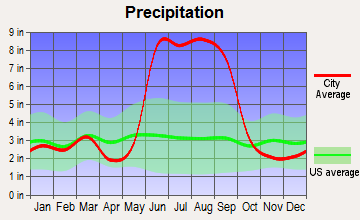
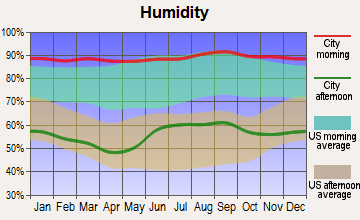
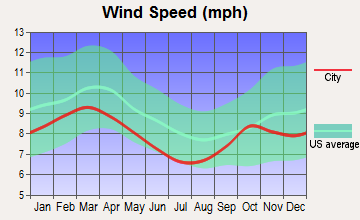
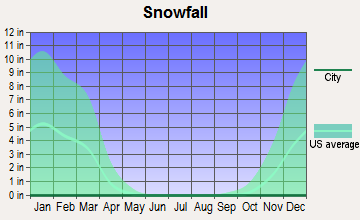
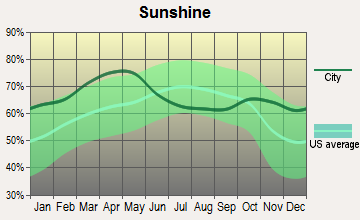
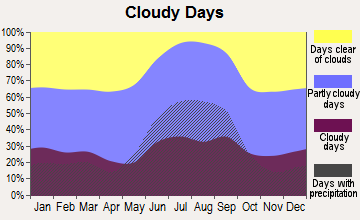
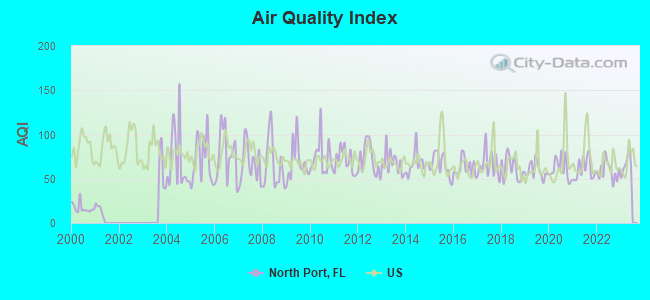
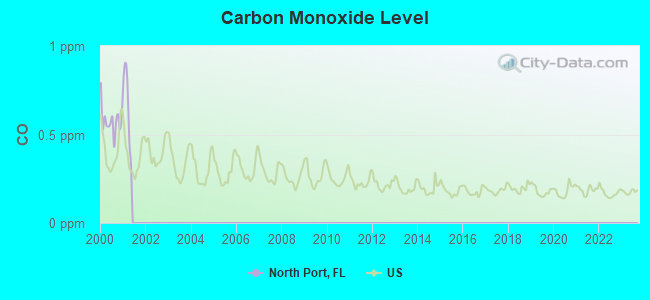
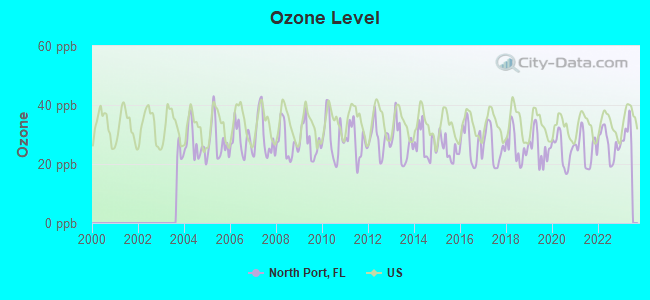
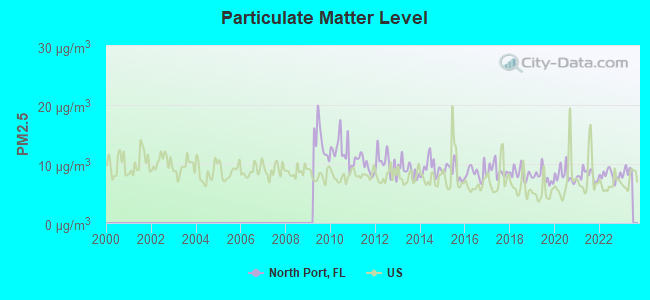

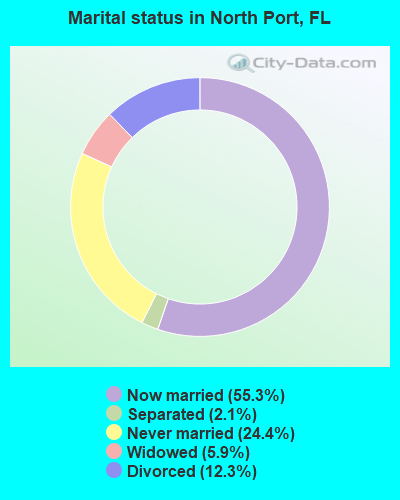
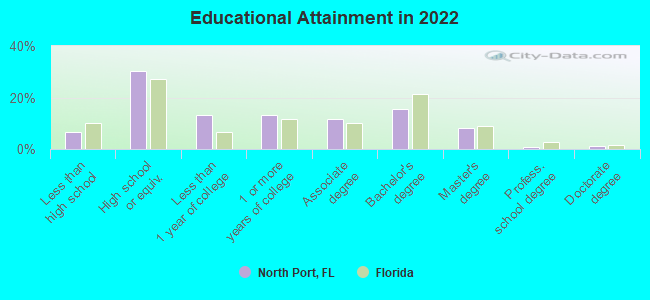
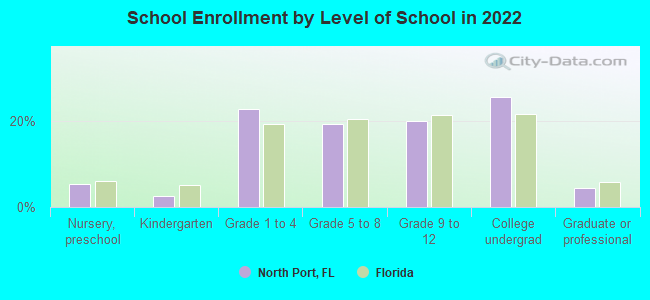
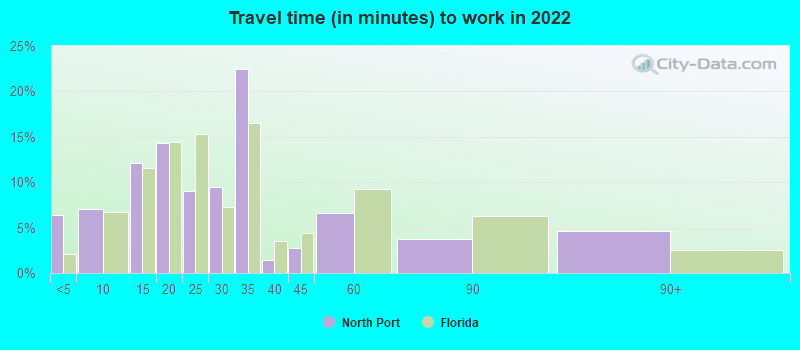
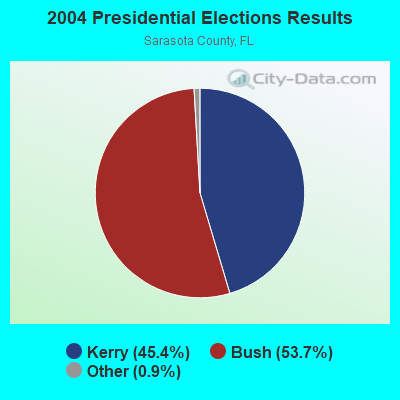
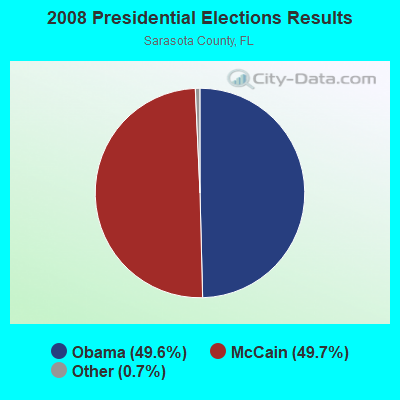
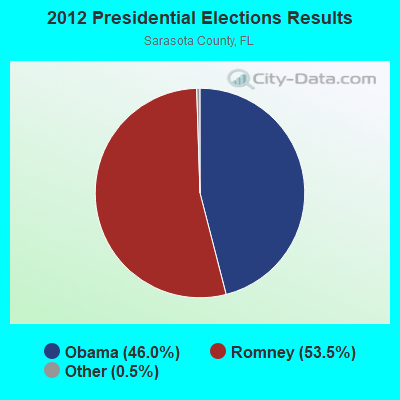
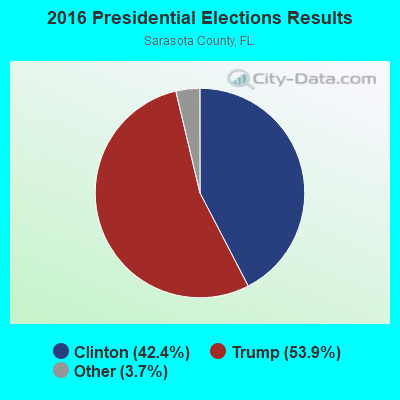
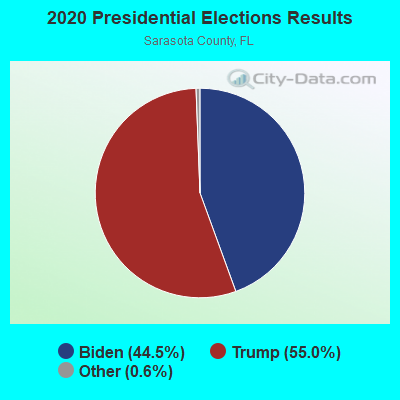
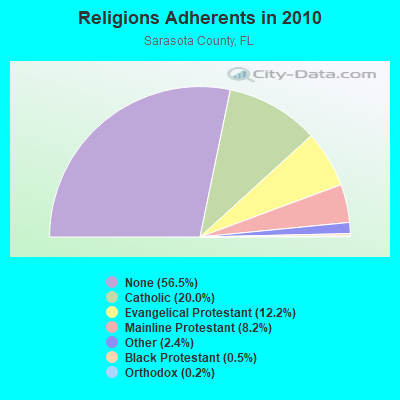
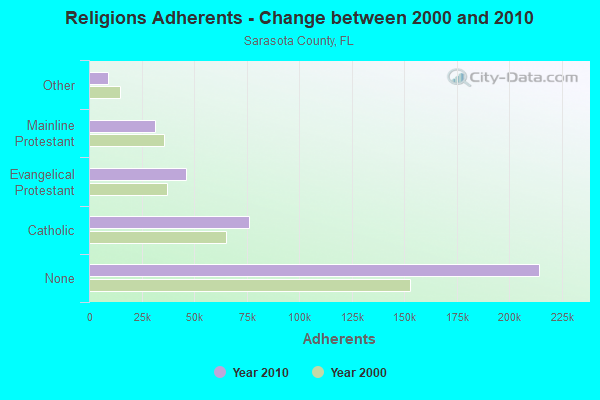
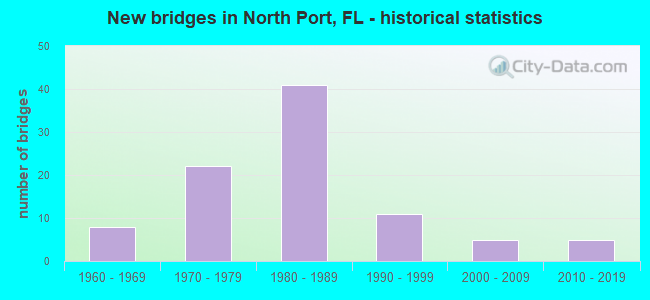
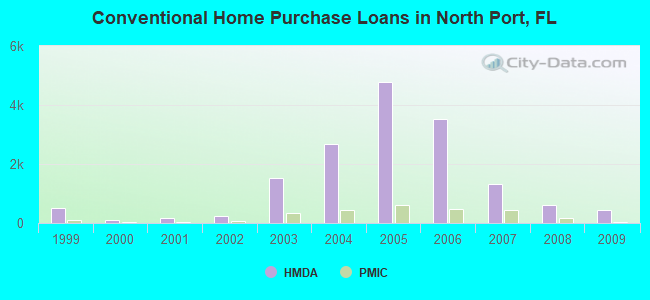
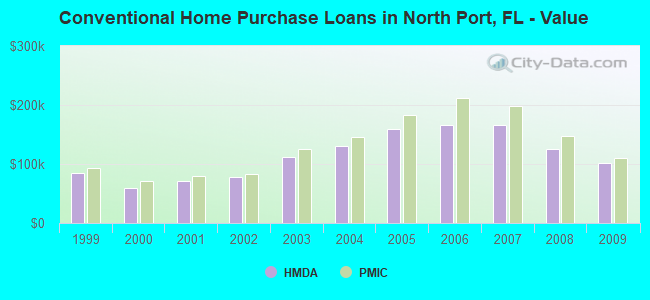
 According to the data from the years 2004 - 2018 the average number of fires per year is 234. The highest number of fires - 377 took place in 2006, and the least - 14 in 2004. The data has a rising trend.
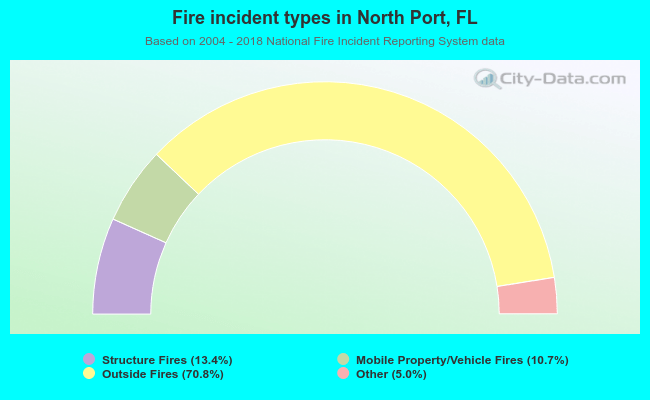 When looking into fire subcategories, the most reports belonged to: Outside Fires (70.8%), and Structure Fires (13.4%).