Port Washington, New York Submit your own pictures of this place and show them to the world
OSM Map
General Map
Google Map
MSN Map
OSM Map
General Map
Google Map
MSN Map
OSM Map
General Map
Google Map
MSN Map
OSM Map
General Map
Google Map
MSN Map
Please wait while loading the map...
Population in 2010: 15,846. Population change since 2000: +4.1%Males: 8,082 Females: 7,764
March 2022 cost of living index in Port Washington: 153.5 (very high, U.S. average is 100) Percentage of residents living in poverty in 2022: 4.9%for White Non-Hispanic residents , 43.7% for Black residents , 21.8% for Hispanic or Latino residents , 36.3% for other race residents , 8.4% for two or more races residents )
Profiles of local businesses
Business Search - 14 Million verified businesses
Data:
Median household income ($)
Median household income (% change since 2000)
Household income diversity
Ratio of average income to average house value (%)
Ratio of average income to average rent
Median household income ($) - White
Median household income ($) - Black or African American
Median household income ($) - Asian
Median household income ($) - Hispanic or Latino
Median household income ($) - American Indian and Alaska Native
Median household income ($) - Multirace
Median household income ($) - Other Race
Median household income for houses/condos with a mortgage ($)
Median household income for apartments without a mortgage ($)
Races - White alone (%)
Races - White alone (% change since 2000)
Races - Black alone (%)
Races - Black alone (% change since 2000)
Races - American Indian alone (%)
Races - American Indian alone (% change since 2000)
Races - Asian alone (%)
Races - Asian alone (% change since 2000)
Races - Hispanic (%)
Races - Hispanic (% change since 2000)
Races - Native Hawaiian and Other Pacific Islander alone (%)
Races - Native Hawaiian and Other Pacific Islander alone (% change since 2000)
Races - Two or more races (%)
Races - Two or more races (% change since 2000)
Races - Other race alone (%)
Races - Other race alone (% change since 2000)
Racial diversity
Unemployment (%)
Unemployment (% change since 2000)
Unemployment (%) - White
Unemployment (%) - Black or African American
Unemployment (%) - Asian
Unemployment (%) - Hispanic or Latino
Unemployment (%) - American Indian and Alaska Native
Unemployment (%) - Multirace
Unemployment (%) - Other Race
Population density (people per square mile)
Population - Males (%)
Population - Females (%)
Population - Males (%) - White
Population - Males (%) - Black or African American
Population - Males (%) - Asian
Population - Males (%) - Hispanic or Latino
Population - Males (%) - American Indian and Alaska Native
Population - Males (%) - Multirace
Population - Males (%) - Other Race
Population - Females (%) - White
Population - Females (%) - Black or African American
Population - Females (%) - Asian
Population - Females (%) - Hispanic or Latino
Population - Females (%) - American Indian and Alaska Native
Population - Females (%) - Multirace
Population - Females (%) - Other Race
Coronavirus confirmed cases (Apr 26, 2024)
Deaths caused by coronavirus (Apr 26, 2024)
Coronavirus confirmed cases (per 100k population) (Apr 26, 2024)
Deaths caused by coronavirus (per 100k population) (Apr 26, 2024)
Daily increase in number of cases (Apr 26, 2024)
Weekly increase in number of cases (Apr 26, 2024)
Cases doubled (in days) (Apr 26, 2024)
Hospitalized patients (Apr 18, 2022)
Negative test results (Apr 18, 2022)
Total test results (Apr 18, 2022)
COVID Vaccine doses distributed (per 100k population) (Sep 19, 2023)
COVID Vaccine doses administered (per 100k population) (Sep 19, 2023)
COVID Vaccine doses distributed (Sep 19, 2023)
COVID Vaccine doses administered (Sep 19, 2023)
Likely homosexual households (%)
Likely homosexual households (% change since 2000)
Likely homosexual households - Lesbian couples (%)
Likely homosexual households - Lesbian couples (% change since 2000)
Likely homosexual households - Gay men (%)
Likely homosexual households - Gay men (% change since 2000)
Cost of living index
Median gross rent ($)
Median contract rent ($)
Median monthly housing costs ($)
Median house or condo value ($)
Median house or condo value ($ change since 2000)
Mean house or condo value by units in structure - 1, detached ($)
Mean house or condo value by units in structure - 1, attached ($)
Mean house or condo value by units in structure - 2 ($)
Mean house or condo value by units in structure by units in structure - 3 or 4 ($)
Mean house or condo value by units in structure - 5 or more ($)
Mean house or condo value by units in structure - Boat, RV, van, etc. ($)
Mean house or condo value by units in structure - Mobile home ($)
Median house or condo value ($) - White
Median house or condo value ($) - Black or African American
Median house or condo value ($) - Asian
Median house or condo value ($) - Hispanic or Latino
Median house or condo value ($) - American Indian and Alaska Native
Median house or condo value ($) - Multirace
Median house or condo value ($) - Other Race
Median resident age
Resident age diversity
Median resident age - Males
Median resident age - Females
Median resident age - White
Median resident age - Black or African American
Median resident age - Asian
Median resident age - Hispanic or Latino
Median resident age - American Indian and Alaska Native
Median resident age - Multirace
Median resident age - Other Race
Median resident age - Males - White
Median resident age - Males - Black or African American
Median resident age - Males - Asian
Median resident age - Males - Hispanic or Latino
Median resident age - Males - American Indian and Alaska Native
Median resident age - Males - Multirace
Median resident age - Males - Other Race
Median resident age - Females - White
Median resident age - Females - Black or African American
Median resident age - Females - Asian
Median resident age - Females - Hispanic or Latino
Median resident age - Females - American Indian and Alaska Native
Median resident age - Females - Multirace
Median resident age - Females - Other Race
Commute - mean travel time to work (minutes)
Travel time to work - Less than 5 minutes (%)
Travel time to work - Less than 5 minutes (% change since 2000)
Travel time to work - 5 to 9 minutes (%)
Travel time to work - 5 to 9 minutes (% change since 2000)
Travel time to work - 10 to 19 minutes (%)
Travel time to work - 10 to 19 minutes (% change since 2000)
Travel time to work - 20 to 29 minutes (%)
Travel time to work - 20 to 29 minutes (% change since 2000)
Travel time to work - 30 to 39 minutes (%)
Travel time to work - 30 to 39 minutes (% change since 2000)
Travel time to work - 40 to 59 minutes (%)
Travel time to work - 40 to 59 minutes (% change since 2000)
Travel time to work - 60 to 89 minutes (%)
Travel time to work - 60 to 89 minutes (% change since 2000)
Travel time to work - 90 or more minutes (%)
Travel time to work - 90 or more minutes (% change since 2000)
Marital status - Never married (%)
Marital status - Now married (%)
Marital status - Separated (%)
Marital status - Widowed (%)
Marital status - Divorced (%)
Median family income ($)
Median family income (% change since 2000)
Median non-family income ($)
Median non-family income (% change since 2000)
Median per capita income ($)
Median per capita income (% change since 2000)
Median family income ($) - White
Median family income ($) - Black or African American
Median family income ($) - Asian
Median family income ($) - Hispanic or Latino
Median family income ($) - American Indian and Alaska Native
Median family income ($) - Multirace
Median family income ($) - Other Race
Median year house/condo built
Median year apartment built
Year house built - Built 2005 or later (%)
Year house built - Built 2000 to 2004 (%)
Year house built - Built 1990 to 1999 (%)
Year house built - Built 1980 to 1989 (%)
Year house built - Built 1970 to 1979 (%)
Year house built - Built 1960 to 1969 (%)
Year house built - Built 1950 to 1959 (%)
Year house built - Built 1940 to 1949 (%)
Year house built - Built 1939 or earlier (%)
Average household size
Household density (households per square mile)
Average household size - White
Average household size - Black or African American
Average household size - Asian
Average household size - Hispanic or Latino
Average household size - American Indian and Alaska Native
Average household size - Multirace
Average household size - Other Race
Occupied housing units (%)
Vacant housing units (%)
Owner occupied housing units (%)
Renter occupied housing units (%)
Vacancy status - For rent (%)
Vacancy status - For sale only (%)
Vacancy status - Rented or sold, not occupied (%)
Vacancy status - For seasonal, recreational, or occasional use (%)
Vacancy status - For migrant workers (%)
Vacancy status - Other vacant (%)
Residents with income below the poverty level (%)
Residents with income below 50% of the poverty level (%)
Children below poverty level (%)
Poor families by family type - Married-couple family (%)
Poor families by family type - Male, no wife present (%)
Poor families by family type - Female, no husband present (%)
Poverty status for native-born residents (%)
Poverty status for foreign-born residents (%)
Poverty among high school graduates not in families (%)
Poverty among people who did not graduate high school not in families (%)
Residents with income below the poverty level (%) - White
Residents with income below the poverty level (%) - Black or African American
Residents with income below the poverty level (%) - Asian
Residents with income below the poverty level (%) - Hispanic or Latino
Residents with income below the poverty level (%) - American Indian and Alaska Native
Residents with income below the poverty level (%) - Multirace
Residents with income below the poverty level (%) - Other Race
Air pollution - Air Quality Index (AQI)
Air pollution - CO
Air pollution - NO2
Air pollution - SO2
Air pollution - Ozone
Air pollution - PM10
Air pollution - PM25
Air pollution - Pb
Crime - Murders per 100,000 population
Crime - Rapes per 100,000 population
Crime - Robberies per 100,000 population
Crime - Assaults per 100,000 population
Crime - Burglaries per 100,000 population
Crime - Thefts per 100,000 population
Crime - Auto thefts per 100,000 population
Crime - Arson per 100,000 population
Crime - City-data.com crime index
Crime - Violent crime index
Crime - Property crime index
Crime - Murders per 100,000 population (5 year average)
Crime - Rapes per 100,000 population (5 year average)
Crime - Robberies per 100,000 population (5 year average)
Crime - Assaults per 100,000 population (5 year average)
Crime - Burglaries per 100,000 population (5 year average)
Crime - Thefts per 100,000 population (5 year average)
Crime - Auto thefts per 100,000 population (5 year average)
Crime - Arson per 100,000 population (5 year average)
Crime - City-data.com crime index (5 year average)
Crime - Violent crime index (5 year average)
Crime - Property crime index (5 year average)
1996 Presidential Elections Results (%) - Democratic Party (Clinton)
1996 Presidential Elections Results (%) - Republican Party (Dole)
1996 Presidential Elections Results (%) - Other
2000 Presidential Elections Results (%) - Democratic Party (Gore)
2000 Presidential Elections Results (%) - Republican Party (Bush)
2000 Presidential Elections Results (%) - Other
2004 Presidential Elections Results (%) - Democratic Party (Kerry)
2004 Presidential Elections Results (%) - Republican Party (Bush)
2004 Presidential Elections Results (%) - Other
2008 Presidential Elections Results (%) - Democratic Party (Obama)
2008 Presidential Elections Results (%) - Republican Party (McCain)
2008 Presidential Elections Results (%) - Other
2012 Presidential Elections Results (%) - Democratic Party (Obama)
2012 Presidential Elections Results (%) - Republican Party (Romney)
2012 Presidential Elections Results (%) - Other
2016 Presidential Elections Results (%) - Democratic Party (Clinton)
2016 Presidential Elections Results (%) - Republican Party (Trump)
2016 Presidential Elections Results (%) - Other
2020 Presidential Elections Results (%) - Democratic Party (Biden)
2020 Presidential Elections Results (%) - Republican Party (Trump)
2020 Presidential Elections Results (%) - Other
Ancestries Reported - Arab (%)
Ancestries Reported - Czech (%)
Ancestries Reported - Danish (%)
Ancestries Reported - Dutch (%)
Ancestries Reported - English (%)
Ancestries Reported - French (%)
Ancestries Reported - French Canadian (%)
Ancestries Reported - German (%)
Ancestries Reported - Greek (%)
Ancestries Reported - Hungarian (%)
Ancestries Reported - Irish (%)
Ancestries Reported - Italian (%)
Ancestries Reported - Lithuanian (%)
Ancestries Reported - Norwegian (%)
Ancestries Reported - Polish (%)
Ancestries Reported - Portuguese (%)
Ancestries Reported - Russian (%)
Ancestries Reported - Scotch-Irish (%)
Ancestries Reported - Scottish (%)
Ancestries Reported - Slovak (%)
Ancestries Reported - Subsaharan African (%)
Ancestries Reported - Swedish (%)
Ancestries Reported - Swiss (%)
Ancestries Reported - Ukrainian (%)
Ancestries Reported - United States (%)
Ancestries Reported - Welsh (%)
Ancestries Reported - West Indian (%)
Ancestries Reported - Other (%)
Educational Attainment - No schooling completed (%)
Educational Attainment - Less than high school (%)
Educational Attainment - High school or equivalent (%)
Educational Attainment - Less than 1 year of college (%)
Educational Attainment - 1 or more years of college (%)
Educational Attainment - Associate degree (%)
Educational Attainment - Bachelor's degree (%)
Educational Attainment - Master's degree (%)
Educational Attainment - Professional school degree (%)
Educational Attainment - Doctorate degree (%)
School Enrollment - Nursery, preschool (%)
School Enrollment - Kindergarten (%)
School Enrollment - Grade 1 to 4 (%)
School Enrollment - Grade 5 to 8 (%)
School Enrollment - Grade 9 to 12 (%)
School Enrollment - College undergrad (%)
School Enrollment - Graduate or professional (%)
School Enrollment - Not enrolled in school (%)
School enrollment - Public schools (%)
School enrollment - Private schools (%)
School enrollment - Not enrolled (%)
Median number of rooms in houses and condos
Median number of rooms in apartments
Housing units lacking complete plumbing facilities (%)
Housing units lacking complete kitchen facilities (%)
Density of houses
Urban houses (%)
Rural houses (%)
Households with people 60 years and over (%)
Households with people 65 years and over (%)
Households with people 75 years and over (%)
Households with one or more nonrelatives (%)
Households with no nonrelatives (%)
Population in households (%)
Family households (%)
Nonfamily households (%)
Population in families (%)
Family households with own children (%)
Median number of bedrooms in owner occupied houses
Mean number of bedrooms in owner occupied houses
Median number of bedrooms in renter occupied houses
Mean number of bedrooms in renter occupied houses
Median number of vehichles in owner occupied houses
Mean number of vehichles in owner occupied houses
Median number of vehichles in renter occupied houses
Mean number of vehichles in renter occupied houses
Mortgage status - with mortgage (%)
Mortgage status - with second mortgage (%)
Mortgage status - with home equity loan (%)
Mortgage status - with both second mortgage and home equity loan (%)
Mortgage status - without a mortgage (%)
Average family size
Average family size - White
Average family size - Black or African American
Average family size - Asian
Average family size - Hispanic or Latino
Average family size - American Indian and Alaska Native
Average family size - Multirace
Average family size - Other Race
Geographical mobility - Same house 1 year ago (%)
Geographical mobility - Moved within same county (%)
Geographical mobility - Moved from different county within same state (%)
Geographical mobility - Moved from different state (%)
Geographical mobility - Moved from abroad (%)
Place of birth - Born in state of residence (%)
Place of birth - Born in other state (%)
Place of birth - Native, outside of US (%)
Place of birth - Foreign born (%)
Housing units in structures - 1, detached (%)
Housing units in structures - 1, attached (%)
Housing units in structures - 2 (%)
Housing units in structures - 3 or 4 (%)
Housing units in structures - 5 to 9 (%)
Housing units in structures - 10 to 19 (%)
Housing units in structures - 20 to 49 (%)
Housing units in structures - 50 or more (%)
Housing units in structures - Mobile home (%)
Housing units in structures - Boat, RV, van, etc. (%)
House/condo owner moved in on average (years ago)
Renter moved in on average (years ago)
Year householder moved into unit - Moved in 1999 to March 2000 (%)
Year householder moved into unit - Moved in 1995 to 1998 (%)
Year householder moved into unit - Moved in 1990 to 1994 (%)
Year householder moved into unit - Moved in 1980 to 1989 (%)
Year householder moved into unit - Moved in 1970 to 1979 (%)
Year householder moved into unit - Moved in 1969 or earlier (%)
Means of transportation to work - Drove car alone (%)
Means of transportation to work - Carpooled (%)
Means of transportation to work - Public transportation (%)
Means of transportation to work - Bus or trolley bus (%)
Means of transportation to work - Streetcar or trolley car (%)
Means of transportation to work - Subway or elevated (%)
Means of transportation to work - Railroad (%)
Means of transportation to work - Ferryboat (%)
Means of transportation to work - Taxicab (%)
Means of transportation to work - Motorcycle (%)
Means of transportation to work - Bicycle (%)
Means of transportation to work - Walked (%)
Means of transportation to work - Other means (%)
Working at home (%)
Industry diversity
Most Common Industries - Agriculture, forestry, fishing and hunting, and mining (%)
Most Common Industries - Agriculture, forestry, fishing and hunting (%)
Most Common Industries - Mining, quarrying, and oil and gas extraction (%)
Most Common Industries - Construction (%)
Most Common Industries - Manufacturing (%)
Most Common Industries - Wholesale trade (%)
Most Common Industries - Retail trade (%)
Most Common Industries - Transportation and warehousing, and utilities (%)
Most Common Industries - Transportation and warehousing (%)
Most Common Industries - Utilities (%)
Most Common Industries - Information (%)
Most Common Industries - Finance and insurance, and real estate and rental and leasing (%)
Most Common Industries - Finance and insurance (%)
Most Common Industries - Real estate and rental and leasing (%)
Most Common Industries - Professional, scientific, and management, and administrative and waste management services (%)
Most Common Industries - Professional, scientific, and technical services (%)
Most Common Industries - Management of companies and enterprises (%)
Most Common Industries - Administrative and support and waste management services (%)
Most Common Industries - Educational services, and health care and social assistance (%)
Most Common Industries - Educational services (%)
Most Common Industries - Health care and social assistance (%)
Most Common Industries - Arts, entertainment, and recreation, and accommodation and food services (%)
Most Common Industries - Arts, entertainment, and recreation (%)
Most Common Industries - Accommodation and food services (%)
Most Common Industries - Other services, except public administration (%)
Most Common Industries - Public administration (%)
Occupation diversity
Most Common Occupations - Management, business, science, and arts occupations (%)
Most Common Occupations - Management, business, and financial occupations (%)
Most Common Occupations - Management occupations (%)
Most Common Occupations - Business and financial operations occupations (%)
Most Common Occupations - Computer, engineering, and science occupations (%)
Most Common Occupations - Computer and mathematical occupations (%)
Most Common Occupations - Architecture and engineering occupations (%)
Most Common Occupations - Life, physical, and social science occupations (%)
Most Common Occupations - Education, legal, community service, arts, and media occupations (%)
Most Common Occupations - Community and social service occupations (%)
Most Common Occupations - Legal occupations (%)
Most Common Occupations - Education, training, and library occupations (%)
Most Common Occupations - Arts, design, entertainment, sports, and media occupations (%)
Most Common Occupations - Healthcare practitioners and technical occupations (%)
Most Common Occupations - Health diagnosing and treating practitioners and other technical occupations (%)
Most Common Occupations - Health technologists and technicians (%)
Most Common Occupations - Service occupations (%)
Most Common Occupations - Healthcare support occupations (%)
Most Common Occupations - Protective service occupations (%)
Most Common Occupations - Fire fighting and prevention, and other protective service workers including supervisors (%)
Most Common Occupations - Law enforcement workers including supervisors (%)
Most Common Occupations - Food preparation and serving related occupations (%)
Most Common Occupations - Building and grounds cleaning and maintenance occupations (%)
Most Common Occupations - Personal care and service occupations (%)
Most Common Occupations - Sales and office occupations (%)
Most Common Occupations - Sales and related occupations (%)
Most Common Occupations - Office and administrative support occupations (%)
Most Common Occupations - Natural resources, construction, and maintenance occupations (%)
Most Common Occupations - Farming, fishing, and forestry occupations (%)
Most Common Occupations - Construction and extraction occupations (%)
Most Common Occupations - Installation, maintenance, and repair occupations (%)
Most Common Occupations - Production, transportation, and material moving occupations (%)
Most Common Occupations - Production occupations (%)
Most Common Occupations - Transportation occupations (%)
Most Common Occupations - Material moving occupations (%)
People in Group quarters - Institutionalized population (%)
People in Group quarters - Correctional institutions (%)
People in Group quarters - Federal prisons and detention centers (%)
People in Group quarters - Halfway houses (%)
People in Group quarters - Local jails and other confinement facilities (including police lockups) (%)
People in Group quarters - Military disciplinary barracks (%)
People in Group quarters - State prisons (%)
People in Group quarters - Other types of correctional institutions (%)
People in Group quarters - Nursing homes (%)
People in Group quarters - Hospitals/wards, hospices, and schools for the handicapped (%)
People in Group quarters - Hospitals/wards and hospices for chronically ill (%)
People in Group quarters - Hospices or homes for chronically ill (%)
People in Group quarters - Military hospitals or wards for chronically ill (%)
People in Group quarters - Other hospitals or wards for chronically ill (%)
People in Group quarters - Hospitals or wards for drug/alcohol abuse (%)
People in Group quarters - Mental (Psychiatric) hospitals or wards (%)
People in Group quarters - Schools, hospitals, or wards for the mentally retarded (%)
People in Group quarters - Schools, hospitals, or wards for the physically handicapped (%)
People in Group quarters - Institutions for the deaf (%)
People in Group quarters - Institutions for the blind (%)
People in Group quarters - Orthopedic wards and institutions for the physically handicapped (%)
People in Group quarters - Wards in general hospitals for patients who have no usual home elsewhere (%)
People in Group quarters - Wards in military hospitals for patients who have no usual home elsewhere (%)
People in Group quarters - Juvenile institutions (%)
People in Group quarters - Long-term care (%)
People in Group quarters - Homes for abused, dependent, and neglected children (%)
People in Group quarters - Residential treatment centers for emotionally disturbed children (%)
People in Group quarters - Training schools for juvenile delinquents (%)
People in Group quarters - Short-term care, detention or diagnostic centers for delinquent children (%)
People in Group quarters - Type of juvenile institution unknown (%)
People in Group quarters - Noninstitutionalized population (%)
People in Group quarters - College dormitories (includes college quarters off campus) (%)
People in Group quarters - Military quarters (%)
People in Group quarters - On base (%)
People in Group quarters - Barracks, unaccompanied personnel housing (UPH), (Enlisted/Officer), ;and similar group living quarters for military personnel (%)
People in Group quarters - Transient quarters for temporary residents (%)
People in Group quarters - Military ships (%)
People in Group quarters - Group homes (%)
People in Group quarters - Homes or halfway houses for drug/alcohol abuse (%)
People in Group quarters - Homes for the mentally ill (%)
People in Group quarters - Homes for the mentally retarded (%)
People in Group quarters - Homes for the physically handicapped (%)
People in Group quarters - Other group homes (%)
People in Group quarters - Religious group quarters (%)
People in Group quarters - Dormitories (%)
People in Group quarters - Agriculture workers' dormitories on farms (%)
People in Group quarters - Job Corps and vocational training facilities (%)
People in Group quarters - Other workers' dormitories (%)
People in Group quarters - Crews of maritime vessels (%)
People in Group quarters - Other nonhousehold living situations (%)
People in Group quarters - Other noninstitutional group quarters (%)
Residents speaking English at home (%)
Residents speaking English at home - Born in the United States (%)
Residents speaking English at home - Native, born elsewhere (%)
Residents speaking English at home - Foreign born (%)
Residents speaking Spanish at home (%)
Residents speaking Spanish at home - Born in the United States (%)
Residents speaking Spanish at home - Native, born elsewhere (%)
Residents speaking Spanish at home - Foreign born (%)
Residents speaking other language at home (%)
Residents speaking other language at home - Born in the United States (%)
Residents speaking other language at home - Native, born elsewhere (%)
Residents speaking other language at home - Foreign born (%)
Class of Workers - Employee of private company (%)
Class of Workers - Self-employed in own incorporated business (%)
Class of Workers - Private not-for-profit wage and salary workers (%)
Class of Workers - Local government workers (%)
Class of Workers - State government workers (%)
Class of Workers - Federal government workers (%)
Class of Workers - Self-employed workers in own not incorporated business and Unpaid family workers (%)
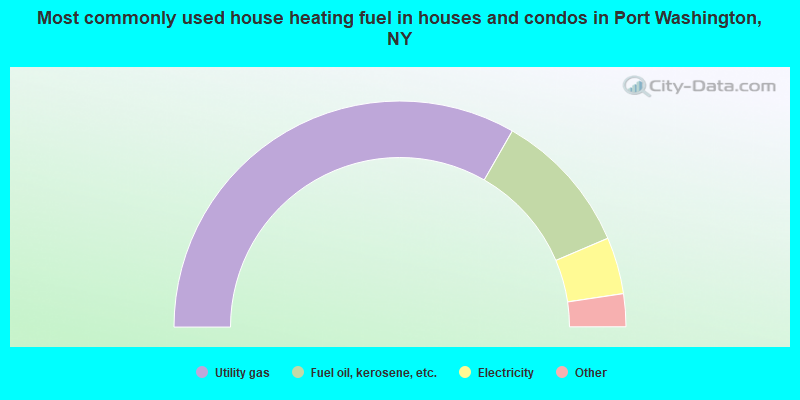
House heating fuel used in houses and condos - Utility gas (%)
House heating fuel used in houses and condos - Bottled, tank, or LP gas (%)
House heating fuel used in houses and condos - Electricity (%)
House heating fuel used in houses and condos - Fuel oil, kerosene, etc. (%)
House heating fuel used in houses and condos - Coal or coke (%)
House heating fuel used in houses and condos - Wood (%)
House heating fuel used in houses and condos - Solar energy (%)
House heating fuel used in houses and condos - Other fuel (%)
House heating fuel used in houses and condos - No fuel used (%)
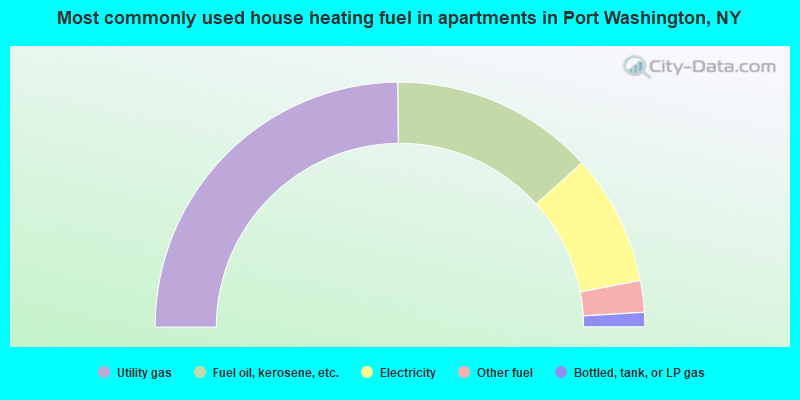
House heating fuel used in apartments - Utility gas (%)
House heating fuel used in apartments - Bottled, tank, or LP gas (%)
House heating fuel used in apartments - Electricity (%)
House heating fuel used in apartments - Fuel oil, kerosene, etc. (%)
House heating fuel used in apartments - Coal or coke (%)
House heating fuel used in apartments - Wood (%)
House heating fuel used in apartments - Solar energy (%)
House heating fuel used in apartments - Other fuel (%)
House heating fuel used in apartments - No fuel used (%)
Armed forces status - In Armed Forces (%)
Armed forces status - Civilian (%)
Armed forces status - Civilian - Veteran (%)
Armed forces status - Civilian - Nonveteran (%)
Fatal accidents locations in years 2005-2021
Fatal accidents locations in 2005
Fatal accidents locations in 2006
Fatal accidents locations in 2007
Fatal accidents locations in 2008
Fatal accidents locations in 2009
Fatal accidents locations in 2010
Fatal accidents locations in 2011
Fatal accidents locations in 2012
Fatal accidents locations in 2013
Fatal accidents locations in 2014
Fatal accidents locations in 2015
Fatal accidents locations in 2016
Fatal accidents locations in 2017
Fatal accidents locations in 2018
Fatal accidents locations in 2019
Fatal accidents locations in 2020
Fatal accidents locations in 2021
Alcohol use - People drinking some alcohol every month (%)
Alcohol use - People not drinking at all (%)
Alcohol use - Average days/month drinking alcohol
Alcohol use - Average drinks/week
Alcohol use - Average days/year people drink much
Audiometry - Average condition of hearing (%)
Audiometry - People that can hear a whisper from across a quiet room (%)
Audiometry - People that can hear normal voice from across a quiet room (%)
Audiometry - Ears ringing, roaring, buzzing (%)
Audiometry - Had a job exposure to loud noise (%)
Audiometry - Had off-work exposure to loud noise (%)
Blood Pressure & Cholesterol - Has high blood pressure (%)
Blood Pressure & Cholesterol - Checking blood pressure at home (%)
Blood Pressure & Cholesterol - Frequently checking blood cholesterol (%)
Blood Pressure & Cholesterol - Has high cholesterol level (%)
Consumer Behavior - Money monthly spent on food at supermarket/grocery store
Consumer Behavior - Money monthly spent on food at other stores
Consumer Behavior - Money monthly spent on eating out
Consumer Behavior - Money monthly spent on carryout/delivered foods
Consumer Behavior - Income spent on food at supermarket/grocery store (%)
Consumer Behavior - Income spent on food at other stores (%)
Consumer Behavior - Income spent on eating out (%)
Consumer Behavior - Income spent on carryout/delivered foods (%)
Current Health Status - General health condition (%)
Current Health Status - Blood donors (%)
Current Health Status - Has blood ever tested for HIV virus (%)
Current Health Status - Left-handed people (%)
Dermatology - People using sunscreen (%)
Diabetes - Diabetics (%)
Diabetes - Had a blood test for high blood sugar (%)
Diabetes - People taking insulin (%)
Diet Behavior & Nutrition - Diet health (%)
Diet Behavior & Nutrition - Milk product consumption (# of products/month)
Diet Behavior & Nutrition - Meals not home prepared (#/week)
Diet Behavior & Nutrition - Meals from fast food or pizza place (#/week)
Diet Behavior & Nutrition - Ready-to-eat foods (#/month)
Diet Behavior & Nutrition - Frozen meals/pizza (#/month)
Drug Use - People that ever used marijuana or hashish (%)
Drug Use - Ever used hard drugs (%)
Drug Use - Ever used any form of cocaine (%)
Drug Use - Ever used heroin (%)
Drug Use - Ever used methamphetamine (%)
Health Insurance - People covered by health insurance (%)
Kidney Conditions-Urology - Avg. # of times urinating at night
Medical Conditions - People with asthma (%)
Medical Conditions - People with anemia (%)
Medical Conditions - People with psoriasis (%)
Medical Conditions - People with overweight (%)
Medical Conditions - Elderly people having difficulties in thinking or remembering (%)
Medical Conditions - People who ever received blood transfusion (%)
Medical Conditions - People having trouble seeing even with glass/contacts (%)
Medical Conditions - People with arthritis (%)
Medical Conditions - People with gout (%)
Medical Conditions - People with congestive heart failure (%)
Medical Conditions - People with coronary heart disease (%)
Medical Conditions - People with angina pectoris (%)
Medical Conditions - People who ever had heart attack (%)
Medical Conditions - People who ever had stroke (%)
Medical Conditions - People with emphysema (%)
Medical Conditions - People with thyroid problem (%)
Medical Conditions - People with chronic bronchitis (%)
Medical Conditions - People with any liver condition (%)
Medical Conditions - People who ever had cancer or malignancy (%)
Mental Health - People who have little interest in doing things (%)
Mental Health - People feeling down, depressed, or hopeless (%)
Mental Health - People who have trouble sleeping or sleeping too much (%)
Mental Health - People feeling tired or having little energy (%)
Mental Health - People with poor appetite or overeating (%)
Mental Health - People feeling bad about themself (%)
Mental Health - People who have trouble concentrating on things (%)
Mental Health - People moving or speaking slowly or too fast (%)
Mental Health - People having thoughts they would be better off dead (%)
Oral Health - Average years since last visit a dentist
Oral Health - People embarrassed because of mouth (%)
Oral Health - People with gum disease (%)
Oral Health - General health of teeth and gums (%)
Oral Health - Average days a week using dental floss/device
Oral Health - Average days a week using mouthwash for dental problem
Oral Health - Average number of teeth
Pesticide Use - Households using pesticides to control insects (%)
Pesticide Use - Households using pesticides to kill weeds (%)
Physical Activity - People doing vigorous-intensity work activities (%)
Physical Activity - People doing moderate-intensity work activities (%)
Physical Activity - People walking or bicycling (%)
Physical Activity - People doing vigorous-intensity recreational activities (%)
Physical Activity - People doing moderate-intensity recreational activities (%)
Physical Activity - Average hours a day doing sedentary activities
Physical Activity - Average hours a day watching TV or videos
Physical Activity - Average hours a day using computer
Physical Functioning - People having limitations keeping them from working (%)
Physical Functioning - People limited in amount of work they can do (%)
Physical Functioning - People that need special equipment to walk (%)
Physical Functioning - People experiencing confusion/memory problems (%)
Physical Functioning - People requiring special healthcare equipment (%)
Prescription Medications - Average number of prescription medicines taking
Preventive Aspirin Use - Adults 40+ taking low-dose aspirin (%)
Reproductive Health - Vaginal deliveries (%)
Reproductive Health - Cesarean deliveries (%)
Reproductive Health - Deliveries resulted in a live birth (%)
Reproductive Health - Pregnancies resulted in a delivery (%)
Reproductive Health - Women breastfeeding newborns (%)
Reproductive Health - Women that had a hysterectomy (%)
Reproductive Health - Women that had both ovaries removed (%)
Reproductive Health - Women that have ever taken birth control pills (%)
Reproductive Health - Women taking birth control pills (%)
Reproductive Health - Women that have ever used Depo-Provera or injectables (%)
Reproductive Health - Women that have ever used female hormones (%)
Sexual Behavior - People 18+ that ever had sex (vaginal, anal, or oral) (%)
Sexual Behavior - Males 18+ that ever had vaginal sex with a woman (%)
Sexual Behavior - Males 18+ that ever performed oral sex on a woman (%)
Sexual Behavior - Males 18+ that ever had anal sex with a woman (%)
Sexual Behavior - Males 18+ that ever had any sex with a man (%)
Sexual Behavior - Females 18+ that ever had vaginal sex with a man (%)
Sexual Behavior - Females 18+ that ever performed oral sex on a man (%)
Sexual Behavior - Females 18+ that ever had anal sex with a man (%)
Sexual Behavior - Females 18+ that ever had any kind of sex with a woman (%)
Sexual Behavior - Average age people first had sex
Sexual Behavior - Average number of female sex partners in lifetime (males 18+)
Sexual Behavior - Average number of female vaginal sex partners in lifetime (males 18+)
Sexual Behavior - Average age people first performed oral sex on a woman (18+)
Sexual Behavior - Average number of woman performed oral sex on in lifetime (18+)
Sexual Behavior - Average number of male sex partners in lifetime (males 18+)
Sexual Behavior - Average number of male anal sex partners in lifetime (males 18+)
Sexual Behavior - Average age people first performed oral sex on a man (18+)
Sexual Behavior - Average number of male oral sex partners in lifetime (18+)
Sexual Behavior - People using protection when performing oral sex (%)
Sexual Behavior - Average number of times people have vaginal or anal sex a year
Sexual Behavior - People having sex without condom (%)
Sexual Behavior - Average number of male sex partners in lifetime (females 18+)
Sexual Behavior - Average number of male vaginal sex partners in lifetime (females 18+)
Sexual Behavior - Average number of female sex partners in lifetime (females 18+)
Sexual Behavior - Circumcised males 18+ (%)
Sleep Disorders - Average hours sleeping at night
Sleep Disorders - People that has trouble sleeping (%)
Smoking-Cigarette Use - People smoking cigarettes (%)
Taste & Smell - People 40+ having problems with smell (%)
Taste & Smell - People 40+ having problems with taste (%)
Taste & Smell - People 40+ that ever had wisdom teeth removed (%)
Taste & Smell - People 40+ that ever had tonsils teeth removed (%)
Taste & Smell - People 40+ that ever had a loss of consciousness because of a head injury (%)
Taste & Smell - People 40+ that ever had a broken nose or other serious injury to face or skull (%)
Taste & Smell - People 40+ that ever had two or more sinus infections (%)
Weight - Average height (inches)
Weight - Average weight (pounds)
Weight - Average BMI
Weight - People that are obese (%)
Weight - People that ever were obese (%)
Weight - People trying to lose weight (%)
According to our research of New York and other state lists, there were 2 registered sex offenders living in Port Washington, New York as of April 26, 2024 . The ratio of all residents to sex offenders in Port Washington is 7,990 to 1.The ratio of registered sex offenders to all residents in this city is much lower than the state average.
Officers per 1,000 residents here:
3.21New York average:
3.28
Latest news from Port Washington, NY collected exclusively by city-data.com from local newspapers, TV, and radio stations
Port Washington, NY City Guides: Ancestries: Italian (16.9%), Irish (10.2%), Eastern European (9.1%), European (4.9%), American (4.4%), German (3.3%).
Current Local Time:
Land area: 4.21 square miles.
Population density: 3,764 people per square mile (average).
2,412 residents are foreign born (6.0% Asia , 4.8% Europe , 3.1% Latin America ).
This place:
14.2%New York:
22.6%
Median real estate property taxes paid for housing units with mortgages in 2022: $10,001 (1.0%)Median real estate property taxes paid for housing units with no mortgage in 2022: $10,001 (1.1%)
Nearest city with pop. 50,000+: North Hempstead, NY
Nearest city with pop. 1,000,000+: Bronx, NY
Nearest cities:
Latitude: 40.83 N, Longitude: 73.69 W
Daytime population change due to commuting: +5,284 (+31.2%)Workers who live and work in this place: 2,986 (36.7%)
Unemployment in December 2023:
Most common industries in Port Washington, NY (%)
Both Males Females
Professional, scientific, technical services (15.0%)
Educational services (11.9%)
Finance & insurance (11.4%)
Health care (9.8%)
Accommodation & food services (4.9%)
Construction (4.0%)
Administrative & support & waste management services (3.7%)
Professional, scientific, technical services (17.0%)
Finance & insurance (12.7%)
Health care (7.4%)
Accommodation & food services (7.1%)
Construction (6.5%)
Educational services (5.5%)
Administrative & support & waste management services (5.0%)
Educational services (19.3%)
Professional, scientific, technical services (12.6%)
Health care (12.5%)
Finance & insurance (9.8%)
Publishing, motion picture & sound recording industries (4.4%)
Private households (2.8%)
Arts, entertainment, recreation (2.8%)
Most common occupations in Port Washington, NY (%)
Both Males Females
Other management occupations, except farmers and farm managers (6.1%)
Sales representatives, services, wholesale and manufacturing (5.8%)
Lawyers (5.0%)
Top executives (4.2%)
Other sales and related occupations, including supervisors (4.1%)
Preschool, kindergarten, elementary, and middle school teachers (3.9%)
Other office and administrative support workers, including supervisors (3.5%)
Other management occupations, except farmers and farm managers (7.8%)
Sales representatives, services, wholesale and manufacturing (7.5%)
Lawyers (6.3%)
Top executives (6.2%)
Other sales and related occupations, including supervisors (4.6%)
Accountants and auditors (4.0%)
Physicians and surgeons (3.9%)
Preschool, kindergarten, elementary, and middle school teachers (7.1%)
Secretaries and administrative assistants (5.5%)
Other office and administrative support workers, including supervisors (5.4%)
Other management occupations, except farmers and farm managers (4.2%)
Sales representatives, services, wholesale and manufacturing (3.9%)
Lawyers (3.6%)
Other sales and related occupations, including supervisors (3.6%)
Tornado activity:
Port Washington-area historical tornado activity is slightly above New York state average. It is 46% smaller than the overall U.S. average.
On 7/10/1989, a category F4 (max. wind speeds 207-260 mph) tornado 52.5 miles away from the Port Washington place center injured 40 people and caused between $50,000,000 and $500,000,000 in damages.
On 9/7/1998, a category F2 (max. wind speeds 113-157 mph) tornado 12.4 miles away from the place center injured 6 people and caused $1 million in damages.
Earthquake activity:
Port Washington-area historical earthquake activity is significantly above New York state average. It is 70% smaller than the overall U.S. average. On 8/23/2011 at 17:51:04, a magnitude 5.8 (5.8 MW, Depth: 3.7 mi, Class: Moderate, Intensity: VI - VII) earthquake occurred 303.9 miles away from the city center On 10/7/1983 at 10:18:46, a magnitude 5.3 (5.1 MB, 5.3 LG, 5.1 ML) earthquake occurred 218.7 miles away from the city center On 4/20/2002 at 10:50:47, a magnitude 5.3 (5.3 ML, Depth: 3.0 mi) earthquake occurred 254.8 miles away from the city center On 1/16/1994 at 01:49:16, a magnitude 4.6 (4.6 MB, 4.6 LG, Depth: 3.1 mi, Class: Light, Intensity: IV - V) earthquake occurred 128.2 miles away from the city center On 4/20/2002 at 10:50:47, a magnitude 5.2 (5.2 MB, 4.2 MS, 5.2 MW, 5.0 MW) earthquake occurred 253.0 miles away from Port Washington center On 8/22/1992 at 12:20:32, a magnitude 4.8 (4.8 MB, 3.8 MS, 4.7 LG, Depth: 6.2 mi) earthquake occurred 214.6 miles away from the city center Magnitude types: regional Lg-wave magnitude (LG), body-wave magnitude (MB), local magnitude (ML), surface-wave magnitude (MS), moment magnitude (MW) Natural disasters: The number of natural disasters in Nassau County (25) is a lot greater than the US average (15).Major Disasters (Presidential) Declared: 17Emergencies Declared: 7Hurricanes: 8, Storms: 7, Floods: 6, Blizzards: 2, Snowstorms: 2, Heavy Rain: 1, Power Outage: 1, Tropical Depression: 1, Tropical Storm: 1, Water Shortage: 1, Winter Storm: 1, Other: 3 (Note: some incidents may be assigned to more than one category). Main business address for: NATIONAL MEDICAL HEALTH CARD SYSTEMS INC INSURANCE AGENTS BROKERS & SERVICES ), CEDAR SHOPPING CENTERS INC REAL ESTATE INVESTMENT TRUSTS ), SYSTEMAX INC RETAIL-CATALOG & MAIL-ORDER HOUSES ).
Hospitals and medical centers in Port Washington: SANDS POINT CENTER FOR H AND R (1440 PORT WASHINGTON BLVD)
THE AMSTERDAM AT HARBORSIDE (300 EAST OVERLOOK)
PORT WASHINGTON DIALYSIS CENTER (50 SEAVIEW BLVD)
Amtrak stations near Port Washington: 8 miles: NEW ROCHELLE (DEPOT PLAZA NORTH) Services: enclosed waiting area, public restrooms, public payphones, paid short-term parking, paid long-term parking, call for car rental service, taxi stand, public transit connection.
11 miles: LA GUARDIA AIRPORT (QUEENS, ) - Bus Station Services: enclosed waiting area, public restrooms, public payphones, snack bar and vending machines, ATM, paid short-term parking, paid long-term parking, car rental agency, taxi stand.
14 miles: YONKERS (FOOT OF DOCK ST. & WELLS AVE.) Services: fully wheelchair accessible, enclosed waiting area, public restrooms, public payphones, snack bar, paid short-term parking, paid long-term parking, call for car rental service, taxi stand, public transit connection.
Colleges/universities with over 2000 students nearest to Port Washington:
New York Institute of Technology (about 5 miles; Old Westbury, NY ; Full-time enrollment: 5,745)
LIU Post (about 5 miles; Brookville, NY ; FT enrollment: 6,854)
SUNY Maritime College (about 7 miles; Throggs Neck, NY ; FT enrollment: 2,098)
CUNY Queensborough Community College (about 7 miles; Bayside, NY ; FT enrollment: 11,931)
SUNY College at Old Westbury (about 7 miles; Old Westbury, NY ; FT enrollment: 4,096)
The College of New Rochelle (about 7 miles; New Rochelle, NY ; FT enrollment: 3,635)
Adelphi University (about 8 miles; Garden City, NY ; FT enrollment: 7,312)
Public high school in Port Washington:
Private high school in Port Washington:
Public elementary/middle schools in Port Washington: CARRIE PALMER WEBER MIDDLE SCHOOL Students: 1,116, Location: PORT WASHINGTON BLVD, Grades: 6-8)JOHN PHILIP SOUSA ELEMENTARY SCHOOL Students: 539, Location: 101 SANDS POINT RD, Grades: KG-5)GUGGENHEIM ELEMENTARY SCHOOL Students: 508, Location: POPLAR PL, Grades: KG-5)SOUTH SALEM ELEMENTARY SCHOOL Students: 429, Location: 10 NEWBURY RD, Grades: KG-5)JOHN J DALY ELEMENTARY SCHOOL Students: 416, Location: 36 ROCKWOOD AVE, Grades: PK-5)MANORHAVEN ELEMENTARY SCHOOL Students: 410, Location: MOREWOOD OAKS, Grades: KG-5)Private elementary/middle school in Port Washington:
See full list of schools located in Port Washington Library in Port Washington: PORT WASHINGTON PUBLIC LIBRARY Operating income: $6,410,615; Location: 1 LIBRARY DRIVE; 196,420 books ; 109 e-books ; 20,258 audio materials ; 26,540 video materials ; 72 local licensed databases ; 14 state licensed databases ; 3 other licensed databases ; 474 print serial subscriptions )
Notable locations in Port Washington: (A) , Hempstead Harbor Industrial Park (B) , Knickerbocker Yacht Club (C) , Manhasset Bay Yacht Club (D) , North Hempstead Town Dock (E) , Port Washington Station (F) , Port Washington Yacht Club (G) , Sands Point Center for Health and Rehabilitation (H) , Port Washington Fire Department (I) . Display/hide their locations on the map
Main business address in Port Washington include: (A) , CEDAR SHOPPING CENTERS INC (B) , SYSTEMAX INC (C) . Display/hide their locations on the map
Churches in Port Washington include: (A) , Zion Baptist Church (B) , Saint Peter of Alcantara Catholic Church (C) , Port Washington United Methodist Church (D) , Mission Pentecostal Church (E) , New York Philadelphia Presbyterian Church (F) , Bible Church of Port Washington (G) , Mount Olive African Methodist Episcopal Church (H) , Lutheran Church of Our Savior (I) . Display/hide their locations on the map
Cemeteries: (1) , Nassau Knolls Cemetery (2) . Display/hide their locations on the map
Parks in Port Washington include: (1) , Bar Beach Town Park (2) , Stannards Brook County Park (3) , Sunset Park (4) . Display/hide their locations on the map
Beach: (A) . Display/hide its location on the map
Tourist attractions:
Hotels:
Birthplace of: Paul Grafer - Soccer player-coach, Nancy Overton - Singer, Ann Murdock - Stage actor, Doug Block - Independent director, Eileen Flockhart - Politician, Keith Osik - Baseball player, Leland Palmer (actress) - Choreographer, Marcel Freeman - Male tennis player, Philip H. Iselin - Sportsman.
Nassau County has a predicted average indoor radon screening level less than 2 pCi/L (pico curies per liter) - Low Potential Average household size: This place:
2.7 peopleNew York:
2.6 people
Percentage of family households: This place:
76.0%Whole state:
63.5%
Percentage of households with unmarried partners: This place:
3.7%Whole state:
6.8%
Likely homosexual households (counted as self-reported same-sex unmarried-partner households)
Lesbian couples: 0.5% of all households Gay men: 0.3% of all households
People in group quarters in Port Washington in 2010:
173 people in nursing facilities/skilled-nursing facilities
16 people in group homes intended for adults
13 people in correctional facilities intended for juveniles
3 people in workers' group living quarters and job corps centers
People in group quarters in Port Washington in 2000:
118 people in nursing homes
13 people in other noninstitutional group quarters
6 people in other workers' dormitories
Banks with most branches in Port Washington (2011 data):
JPMorgan Chase Bank, National Association: Port Washington Branch, Port Washington Branch, Port Washington Branch. Info updated 2011/11/10: Bank assets: $1,811,678.0 mil, Deposits: $1,190,738.0 mil, headquarters in Columbus, OH, positive income , International Specialization, 5577 total offices , Holding Company: Jpmorgan Chase & Co.
Wells Fargo Bank, National Association: Port Washington Drive-In Branch at 100 Shore Road, branch established on 2007/01/29; Uptown Port Washington at 1029 Port Washington Boulevard, branch established on 2007/05/14. Info updated 2011/04/05: Bank assets: $1,161,490.0 mil, Deposits: $905,653.0 mil, headquarters in Sioux Falls, SD, positive income , 6395 total offices , Holding Company: Wells Fargo & Company
The Dime Svgs. Bank of Williamsburgh: Port Washington Branch at 1000 Port Washington Boulevard, branch established on 1885/01/01. Info updated 2011/07/21: Bank assets: $4,009.9 mil, Deposits: $2,426.7 mil, headquarters in Brooklyn, NY, positive income , Commercial Lending Specialization, 26 total offices
Astoria Federal Savings and Loan Association: Port Washington Branch at 110 Main Street, branch established on 1889/01/01. Info updated 2011/07/21: Bank assets: $16,975.1 mil, Deposits: $11,426.8 mil, headquarters in Long Island City, NY, positive income , Mortgage Lending Specialization, 86 total offices
Citibank, National Association: Port Washington Branch at 830 Port Washington Boulevard, branch established on 1960/05/21. Info updated 2012/01/10: Bank assets: $1,288,658.0 mil, Deposits: $882,541.0 mil, headquarters in Sioux Falls, SD, positive income , International Specialization, 1048 total offices , Holding Company: Citigroup Inc.
Valley National Bank: Port Washington Branch at 960 Port Washington Blvd., branch established on 2002/03/25. Info updated 2012/01/10: Bank assets: $14,186.7 mil, Deposits: $9,715.7 mil, headquarters in Wayne, NJ, positive income , Commercial Lending Specialization, 219 total offices , Holding Company: Valley National Bancorp
TD Bank, National Association: Port Washington Branch at 475 Port Washington Blvd, branch established on 2009/08/08. Info updated 2010/10/04: Bank assets: $188,912.6 mil, Deposits: $153,149.8 mil, headquarters in Wilmington, DE, positive income , 1314 total offices , Holding Company: Toronto-Dominion Bank, The
New York Community Bank: Port Washington Branch at 167 Shore Road, branch established on 2003/09/18. Info updated 2010/03/29: Bank assets: $39,468.7 mil, Deposits: $20,709.8 mil, headquarters in Westbury, NY, positive income , Commercial Lending Specialization, 247 total offices , Holding Company: New York Community Bancorp, Inc.
Capital One, National Association: Port Washington Branch at 1020 Port Washintgon Boulevard, branch established on 2002/02/04. Info updated 2011/07/01: Bank assets: $133,477.8 mil, Deposits: $97,063.7 mil, headquarters in Mclean, VA, positive income , 984 total offices , Holding Company: Capital One Financial Corporation
3 other banks with 3 local branches
For population 15 years and over in Port Washington:
Never married: 22.5%Now married: 65.3%Separated: 1.0%Widowed: 5.5%Divorced: 5.6% For population 25 years and over in Port Washington:
High school or higher: 95.4%Bachelor's degree or higher: 73.1%Graduate or professional degree: 35.8%Unemployed: 2.4%Mean travel time to work (commute): 29.7 minutes
Education Gini index (Inequality in education) Here:
10.5New York average:
13.9
Religion statistics for Port Washington, NY (based on Nassau County data)
Religion Adherents Congregations Catholic 677,149 73 Other 102,012 168 Mainline Protestant 50,181 184 Evangelical Protestant 39,923 251 Orthodox 16,758 22 Black Protestant 13,189 45 None 440,320 -
Source: Clifford Grammich, Kirk Hadaway, Richard Houseal, Dale E.Jones, Alexei Krindatch, Richie Stanley and Richard H.Taylor. 2012. 2010 U.S.Religion Census: Religious Congregations & Membership Study. Association of Statisticians of American Religious Bodies. Jones, Dale E., et al. 2002. Congregations and Membership in the United States 2000. Nashville, TN: Glenmary Research Center. Graphs represent county-level data
Food Environment Statistics: Number of grocery stores : 556Nassau County :
4.11 / 10,000 pop.New York :
4.13 / 10,000 pop.
Number of supercenters and club stores : 7This county :
0.05 / 10,000 pop.New York :
0.06 / 10,000 pop.
Number of convenience stores (no gas) : 201Nassau County :
1.49 / 10,000 pop.New York :
0.92 / 10,000 pop.
Number of convenience stores (with gas) : 174This county :
1.29 / 10,000 pop.State :
1.68 / 10,000 pop.
Number of full-service restaurants : 1,219Nassau County :
9.01 / 10,000 pop.New York :
8.82 / 10,000 pop.
Adult diabetes rate : This county :
8.3%New York :
8.2%
Adult obesity rate : Nassau County :
20.9%New York :
23.8%
Low-income preschool obesity rate : This county :
22.2%New York :
15.6%
Health and Nutrition: Healthy diet rate : Port Washington:
52.8%New York:
50.1%
Average overall health of teeth and gums : Port Washington:
51.5%New York:
48.1%
Average BMI : Port Washington:
28.3State:
28.5
People feeling badly about themselves : Port Washington:
19.6%New York:
20.3%
People not drinking alcohol at all : Average hours sleeping at night : Overweight people : Port Washington:
35.2%New York:
33.4%
General health condition : Average condition of hearing : This city:
79.6%New York:
80.2%
More about Health and Nutrition of Port Washington, NY Residents
4.70% of this county's 2021 resident taxpayers lived in other counties in 2020 ($121,726 average adjusted gross income )
Here:
4.70%New York average:
5.29%
0.01% of residents moved from foreign countries ($55 average AGI )Nassau County:
0.01%New York average:
0.01%
Top counties from which taxpayers relocated into this county between 2020 and 2021:
5.44% of this county's 2020 resident taxpayers moved to other counties in 2021 ($120,429 average adjusted gross income )
Here:
5.44%New York average:
6.93%
0.01% of residents moved to foreign countries ($114 average AGI )Nassau County:
0.01%New York average:
0.02%
Top counties to which taxpayers relocated from this county between 2020 and 2021:
Businesses in Port Washington, NY
Name Count Name Count
AT&T 1 Jones New York 1 Ace Hardware 1 Nike 1 Baskin-Robbins 1 Payless 1 Burger King 1 RadioShack 1 Domino's Pizza 1 Rite Aid 2 Dunkin Donuts 2 Sprint Nextel 1 FedEx 5 Starbucks 2 GNC 1 Stop & Shop 1 GameStop 1 True Value 1 H&R Block 1 UPS 6
Strongest AM radio stations in Port Washington:
WFAN (660 AM; 50 kW; NEW YORK, NY; Owner: INFINITY BROADCASTING OPERATIONS, INC.)
WCBS (880 AM; 50 kW; NEW YORK, NY; Owner: INFINITY BROADCASTING OPERATIONS, INC.)
WGSM (740 AM; 25 kW; HUNTINGTON, NY; Owner: K RADIO LICENSEE, INC.)
WMCA (570 AM; 50 kW; NEW YORK, NY; Owner: SALEM MEDIA OF NEW YORK, LLC)
WQEW (1560 AM; 50 kW; NEW YORK, NY; Owner: THE NEW YORK TIMES ELECTRONIC MEDIA COMPANY)
WABC (770 AM; 50 kW; NEW YORK, NY; Owner: WABC-AM RADIO, INC.)
WOR (710 AM; 50 kW; NEW YORK, NY; Owner: BUCKLEY BROADCASTING CORPORATION)
WBBR (1130 AM; 50 kW; NEW YORK, NY; Owner: BLOOMBERG COMMUNICATIONS INC.)
WEPN (1050 AM; 50 kW; NEW YORK, NY; Owner: NEW YORK AM RADIO, LLC)
WINS (1010 AM; 50 kW; NEW YORK, NY; Owner: INFINITY BROADCASTING OPERATIONS, INC.)
WADO (1280 AM; 50 kW; NEW YORK, NY; Owner: WADO-AM LICENSE CORP.)
WHLI (1100 AM; daytime; 10 kW; HEMPSTEAD, NY)
WLIB (1190 AM; 30 kW; NEW YORK, NY; Owner: ICBC BROADCAST HOLDINGS-NY, INC.)
Strongest FM radio stations in Port Washington:
WLIR-FM (92.7 FM; GARDEN CITY, NY; Owner: JARAD BROADCASTING COMPANY INC.)
WKCR-FM (89.9 FM; NEW YORK, NY; Owner: TRUSTEES OF COLUMBIA UNIVERSITY IN NEW YORK)
WPLJ (95.5 FM; NEW YORK, NY; Owner: WPLJ-FM RADIO, INC.)
WKTU (103.5 FM; LAKE SUCCESS, NY; Owner: AMFM RADIO LICENSES, LLC)
WQCD (101.9 FM; NEW YORK, NY; Owner: EMMIS RADIO LICENSE CORPORATION)
WAXQ (104.3 FM; NEW YORK, NY; Owner: AMFM NEW YORK LICENSES, LLC)
WHTZ (100.3 FM; NEWARK, NJ; Owner: AMFM RADIO LICENSES, L.L.C.)
WWPR-FM (105.1 FM; NEW YORK, NY; Owner: AMFM RADIO LICENSES, L.L.C.)
WCAA (105.9 FM; NEWARK, NJ; Owner: WADO-AM LICENSE CORP. ("WADO"))
WBAI (99.5 FM; NEW YORK, NY; Owner: PACIFICA FOUNDATION, INC.)
WBLS (107.5 FM; NEW YORK, NY; Owner: ICBC BROADCAST HOLDINGS-NY, INC.)
WLTW (106.7 FM; NEW YORK, NY; Owner: AMFM NEW YORK LICENSES, LLC)
WQXR-FM (96.3 FM; NEW YORK, NY; Owner: THE NEW YORK TIMES ELECTRONIC MEDIA COMPANY)
WSKQ-FM (97.9 FM; NEW YORK, NY; Owner: WSKQ LICENSING, INC.)
WXRK (92.3 FM; NEW YORK, NY; Owner: INFINITY BROADCASTING OPERATIONS, INC.)
WCBS-FM (101.1 FM; NEW YORK, NY; Owner: INFINITY BROADCASTING OPERATIONS, INC.)
WQHT (97.1 FM; NEW YORK, NY; Owner: EMMIS LICENSE CORPORATION OF NEW YORK)
WNYC-FM (93.9 FM; NEW YORK, NY; Owner: WNYC RADIO)
WPAT-FM (93.1 FM; PATERSON, NJ; Owner: WPAT LICENSING, INC.)
WCWP (88.1 FM; BROOKVILLE, NY; Owner: LONG ISLAND UNIVERSITY PUBLIC RADIO NETWORK)
TV broadcast stations around Port Washington:
WNYW (Channel 5; NEW YORK, NY; Owner: FOX TELEVISION STATIONS, INC.)
WCBS-TV (Channel 2; NEW YORK, NY; Owner: CBS BROADCASTING INC.)
WXNY-LP (Channel 32; NEW YORK, NY; Owner: ISLAND BROADCASTING COMPANY)
WABC-TV (Channel 7; NEW YORK, NY; Owner: AMERICAN BROADCASTING COMPANIES, INC)
WPIX (Channel 11; NEW YORK, NY; Owner: WPIX, INC.)
WWOR-TV (Channel 9; SECAUCUS, NJ; Owner: FOX TELEVISION STATIONS, INC.)
WNJU (Channel 47; LINDEN, NJ; Owner: WNJU LICENSE CORPORATION)
W38CL (Channel 38; BRONX, NY; Owner: RENARD COMMUNICATIONS CORP.)
WFUT (Channel 68; NEWARK, NJ; Owner: UNIVISION NEW YORK LLC)
WNYE-TV (Channel 25; NEW YORK, NY; Owner: NEW YORK CITY BOARD OF EDUCATION)
WPXN-TV (Channel 31; NEW YORK, NY; Owner: PAXSON COMMUNICATIONS LICENSE COMPANY, LLC)
WNBC (Channel 4; NEW YORK, NY; Owner: NATIONAL BROADCASTING COMPANY, INC.)
WNET (Channel 13; NEWARK, NJ; Owner: EDUCATIONAL BROADCASTING CORPORATION)
WXTV (Channel 41; PATERSON, NJ; Owner: WXTV LICENSE PARTNERSHIP, G.P.)
WKOB-LP (Channel 53; NEW YORK, NY; Owner: WKOB COMMUNICATIONS, INC.)
WEBR-CA (Channel 17; MANHATTAN, NY; Owner: K LICENSEE INC.)
WRNN-LP (Channel 57; NYACK, NY; Owner: LP NYACK LIMITED PARTNERSHIP)
W60AI (Channel 60; NEW YORK, NY; Owner: VENTANA TELEVISION, INC.)
WLIG-LP (Channel 54; MINEOLA, NY; Owner: WLNY-TV, INC.)
WPXU-LP (Channel 38; AMITYVILLE, NY; Owner: PAXSON COMMUNICATIONS LPTV, INC.)
W68DN (Channel 68; CHERRY HILL, ETC., NJ; Owner: MARCIA COHEN)
WNYX-LP (Channel 35; NEW YORK, NY; Owner: ISLAND BROADCASTING COMPANY)
W33BS (Channel 33; DARIEN, CT; Owner: CT&T BROADCASTING, INC.)
WNYN-LP (Channel 39; NEW YORK, NY; Owner: ISLAND BROADCASTING COMPANY)
WNXY-LP (Channel 26; NEW YORK, NY; Owner: ISLAND BROADCASTING COMPANY)
FCC Registered Antenna Towers: 6
ED MOONEY, West Shore Drive (Lat: 40.814750 Lon: -73.668083), Type: 45.7, Overall height: 45.7 m, Registrant: Crescent Group, Inc., Emooney@highlanderinc.Com, , East -Islip, Phone: (631) 581-8105 JOY MOONEY, West Shore Drive (Lat: 40.814750 Lon: -73.668083), Type: 45.7, Overall height: 45.7 m, Registrant: Crescent Group, Inc., Emooney@highlanderinc.Com, , East -Islip, Phone: (631) 581-8105 Edward G Roach, West Shore Drive (Lat: 40.814750 Lon: -73.668083), Type: 45.7, Overall height: 45.7 m, Registrant: Sba Towers Ii LLC, Eroach@sbasite.Com, , Boca -Raton, Phone: (561) 995-7670 Edward G Roach, 802 West Shore Road (Ny10878-A) (Lat: 40.814361 Lon: -73.668056), Type: 45.7, Overall height: 44.5 m, Registrant: Sba Towers Ii LLC, Eroach@sbasite.Com, , Boca -Raton, Phone: (561) 995-7670 Edward G Roach, 802 West Shore Road (Ny10878-A) (Lat: 40.814361 Lon: -73.668056), Type: 45.7, Overall height: 44.5 m, Registrant: Sba Towers Ii LLC, Eroach@sbasite.Com, , Boca -Raton, Phone: (561) 995-7670 James Salerno, 500 Port Washington Blvd (Lat: 40.821222 Lon: -73.681250), Type: 23.2, Structure height: 36059 m, Overall height: 21.3 m, Registrant: Port Washington Police District Apco Ls 121614 Cmp, Radio@portwashingtonpd.Com, , Port -Washington, Phone: (516) 883-0500 FCC Registered Broadcast Land Mobile Towers: 18 (
See the full list of FCC Registered Broadcast Land Mobile Towers in Port Washington, NY )
FCC Registered Microwave Towers: 2 (
See the full list of FCC Registered Microwave Towers in this town )
FCC Registered Maritime Coast & Aviation Ground Towers: 24 (
See the full list of FCC Registered Maritime Coast & Aviation Ground Towers )
FCC Registered Amateur Radio Licenses: 119 (
See the full list of FCC Registered Amateur Radio Licenses in Port Washington )
FAA Registered Aircraft: 14 (
See the full list of FAA Registered Aircraft in Port Washington )
Home Mortgage Disclosure Act Aggregated Statistics For Year 2009(Based on 2 full and 4 partial tracts) A) FHA, FSA/RHS & VA B) Conventional C) Refinancings D) Home Improvement Loans E) Loans on Dwellings For 5+ Families F) Non-occupant Loans on Number Average Value Number Average Value Number Average Value Number Average Value Number Average Value Number Average Value
LOANS ORIGINATED 6 $487,110 96 $486,149 175 $398,752 7 $298,626 2 $1,428,615 8 $501,251 APPLICATIONS APPROVED, NOT ACCEPTED 2 $492,565 15 $441,840 30 $462,712 3 $108,637 0 $0 1 $453,440 APPLICATIONS DENIED 1 $736,880 15 $653,563 91 $472,151 9 $95,676 0 $0 7 $386,987 APPLICATIONS WITHDRAWN 4 $563,148 17 $541,968 52 $434,322 0 $0 0 $0 4 $437,200 FILES CLOSED FOR INCOMPLETENESS 0 $0 4 $630,008 17 $435,691 0 $0 0 $0 1 $344,000
Aggregated Statistics For Year 2008(Based on 2 full and 4 partial tracts) A) FHA, FSA/RHS & VA B) Conventional C) Refinancings D) Home Improvement Loans E) Loans on Dwellings For 5+ Families F) Non-occupant Loans on Number Average Value Number Average Value Number Average Value Number Average Value Number Average Value Number Average Value
LOANS ORIGINATED 1 $684,610 104 $458,758 56 $480,584 15 $289,038 2 $1,097,925 6 $598,493 APPLICATIONS APPROVED, NOT ACCEPTED 0 $0 28 $449,044 23 $433,864 0 $0 0 $0 3 $390,120 APPLICATIONS DENIED 0 $0 37 $535,066 37 $455,781 10 $278,151 0 $0 5 $617,574 APPLICATIONS WITHDRAWN 2 $266,990 14 $359,771 25 $465,746 1 $92,670 0 $0 3 $708,453 FILES CLOSED FOR INCOMPLETENESS 0 $0 6 $539,398 5 $325,130 3 $156,007 0 $0 0 $0
Aggregated Statistics For Year 2007(Based on 2 full and 4 partial tracts) B) Conventional C) Refinancings D) Home Improvement Loans F) Non-occupant Loans on Number Average Value Number Average Value Number Average Value Number Average Value
LOANS ORIGINATED 174 $453,539 94 $459,327 19 $241,741 15 $451,566 APPLICATIONS APPROVED, NOT ACCEPTED 48 $494,798 32 $386,106 3 $134,607 2 $574,815 APPLICATIONS DENIED 31 $527,018 73 $524,820 16 $230,218 6 $655,612 APPLICATIONS WITHDRAWN 19 $506,685 23 $520,810 4 $180,832 2 $509,480 FILES CLOSED FOR INCOMPLETENESS 10 $391,056 10 $413,445 3 $548,267 3 $383,613
Aggregated Statistics For Year 2006(Based on 2 full and 4 partial tracts) B) Conventional C) Refinancings D) Home Improvement Loans E) Loans on Dwellings For 5+ Families F) Non-occupant Loans on Number Average Value Number Average Value Number Average Value Number Average Value Number Average Value
LOANS ORIGINATED 169 $475,677 141 $418,847 23 $255,993 2 $588,520 18 $368,729 APPLICATIONS APPROVED, NOT ACCEPTED 28 $356,709 32 $394,636 7 $75,274 0 $0 2 $347,370 APPLICATIONS DENIED 34 $459,352 92 $492,124 10 $294,779 0 $0 15 $393,047 APPLICATIONS WITHDRAWN 12 $493,620 68 $385,483 2 $313,705 0 $0 9 $430,919 FILES CLOSED FOR INCOMPLETENESS 11 $505,795 23 $508,419 1 $169,010 0 $0 1 $190,670
Aggregated Statistics For Year 2005(Based on 2 full and 4 partial tracts) B) Conventional C) Refinancings D) Home Improvement Loans F) Non-occupant Loans on Number Average Value Number Average Value Number Average Value Number Average Value
LOANS ORIGINATED 240 $472,617 178 $441,383 22 $239,581 30 $375,954 APPLICATIONS APPROVED, NOT ACCEPTED 35 $510,620 32 $443,648 7 $341,857 4 $432,218 APPLICATIONS DENIED 45 $473,969 100 $432,204 12 $261,567 7 $361,381 APPLICATIONS WITHDRAWN 37 $493,696 73 $417,426 6 $418,493 9 $522,626 FILES CLOSED FOR INCOMPLETENESS 8 $498,501 37 $417,046 1 $393,820 1 $369,950
Aggregated Statistics For Year 2004(Based on 2 full and 4 partial tracts) A) FHA, FSA/RHS & VA B) Conventional C) Refinancings D) Home Improvement Loans E) Loans on Dwellings For 5+ Families F) Non-occupant Loans on Number Average Value Number Average Value Number Average Value Number Average Value Number Average Value Number Average Value
LOANS ORIGINATED 1 $270,000 198 $471,977 205 $361,775 15 $225,636 0 $0 29 $341,779 APPLICATIONS APPROVED, NOT ACCEPTED 0 $0 35 $513,253 43 $340,982 4 $80,110 0 $0 6 $380,452 APPLICATIONS DENIED 0 $0 31 $527,759 79 $377,036 18 $173,459 0 $0 3 $530,687 APPLICATIONS WITHDRAWN 0 $0 28 $518,495 86 $354,414 10 $271,915 1 $63,000 7 $462,194 FILES CLOSED FOR INCOMPLETENESS 0 $0 9 $488,633 32 $399,351 4 $146,065 0 $0 1 $450,410
Aggregated Statistics For Year 2003(Based on 2 full and 4 partial tracts) A) FHA, FSA/RHS & VA B) Conventional C) Refinancings D) Home Improvement Loans E) Loans on Dwellings For 5+ Families F) Non-occupant Loans on Number Average Value Number Average Value Number Average Value Number Average Value Number Average Value Number Average Value
LOANS ORIGINATED 2 $238,155 191 $452,755 612 $316,684 10 $250,580 2 $830,010 29 $294,976 APPLICATIONS APPROVED, NOT ACCEPTED 0 $0 33 $435,062 125 $304,261 5 $117,370 0 $0 4 $425,918 APPLICATIONS DENIED 0 $0 29 $447,421 126 $366,856 12 $56,470 1 $293,770 7 $297,713 APPLICATIONS WITHDRAWN 0 $0 28 $390,015 114 $322,056 3 $268,600 0 $0 8 $307,446 FILES CLOSED FOR INCOMPLETENESS 0 $0 5 $386,988 34 $322,881 1 $69,940 0 $0 2 $188,015
Aggregated Statistics For Year 2002(Based on 2 full and 4 partial tracts) B) Conventional C) Refinancings D) Home Improvement Loans E) Loans on Dwellings For 5+ Families F) Non-occupant Loans on Number Average Value Number Average Value Number Average Value Number Average Value Number Average Value
LOANS ORIGINATED 197 $405,288 410 $301,696 51 $73,250 1 $430,870 20 $304,506 APPLICATIONS APPROVED, NOT ACCEPTED 27 $486,230 100 $289,755 10 $78,090 0 $0 9 $236,140 APPLICATIONS DENIED 28 $459,402 107 $300,553 13 $142,403 0 $0 9 $262,403 APPLICATIONS WITHDRAWN 21 $457,609 81 $272,649 6 $78,230 0 $0 8 $318,002 FILES CLOSED FOR INCOMPLETENESS 8 $284,352 31 $281,978 1 $117,510 0 $0 0 $0
Aggregated Statistics For Year 2001(Based on 2 full and 4 partial tracts) A) FHA, FSA/RHS & VA B) Conventional C) Refinancings D) Home Improvement Loans E) Loans on Dwellings For 5+ Families F) Non-occupant Loans on Number Average Value Number Average Value Number Average Value Number Average Value Number Average Value Number Average Value
LOANS ORIGINATED 0 $0 177 $331,569 262 $281,560 39 $76,102 2 $168,430 13 $228,112 APPLICATIONS APPROVED, NOT ACCEPTED 0 $0 18 $307,448 56 $263,462 18 $65,790 0 $0 4 $252,065 APPLICATIONS DENIED 0 $0 24 $290,715 86 $281,625 17 $100,690 1 $175,000 6 $273,278 APPLICATIONS WITHDRAWN 0 $0 14 $462,338 51 $226,288 10 $60,572 0 $0 1 $398,780 FILES CLOSED FOR INCOMPLETENESS 1 $251,470 6 $348,527 19 $218,108 7 $52,807 0 $0 0 $0
Aggregated Statistics For Year 2000(Based on 2 full and 4 partial tracts) A) FHA, FSA/RHS & VA B) Conventional C) Refinancings D) Home Improvement Loans F) Non-occupant Loans on Number Average Value Number Average Value Number Average Value Number Average Value Number Average Value
LOANS ORIGINATED 1 $120,230 160 $313,176 63 $180,123 42 $62,559 13 $203,728 APPLICATIONS APPROVED, NOT ACCEPTED 0 $0 18 $454,249 24 $216,930 17 $73,214 4 $155,250 APPLICATIONS DENIED 0 $0 19 $326,621 32 $293,506 18 $98,907 3 $230,653 APPLICATIONS WITHDRAWN 0 $0 13 $378,344 52 $171,814 10 $110,646 2 $172,855 FILES CLOSED FOR INCOMPLETENESS 0 $0 6 $294,242 3 $111,527 2 $55,855 0 $0
Aggregated Statistics For Year 1999(Based on 2 full and 4 partial tracts) A) FHA, FSA/RHS & VA B) Conventional C) Refinancings D) Home Improvement Loans E) Loans on Dwellings For 5+ Families F) Non-occupant Loans on Number Average Value Number Average Value Number Average Value Number Average Value Number Average Value Number Average Value
LOANS ORIGINATED 2 $175,610 184 $304,062 210 $218,977 45 $55,346 0 $0 14 $161,756 APPLICATIONS APPROVED, NOT ACCEPTED 0 $0 30 $356,014 45 $235,044 4 $23,775 0 $0 4 $165,148 APPLICATIONS DENIED 0 $0 23 $295,632 44 $221,292 21 $79,869 0 $0 8 $127,325 APPLICATIONS WITHDRAWN 0 $0 15 $347,541 60 $181,412 11 $76,223 1 $73,770 1 $222,470 FILES CLOSED FOR INCOMPLETENESS 0 $0 8 $259,389 13 $240,557 5 $39,532 0 $0 0 $0
Detailed HMDA statistics for the following Tracts:
3010.00
, 3011.02 , 3012.00 , 3013.00 , 3014.00
Private Mortgage Insurance Companies Aggregated Statistics For Year 2009(Based on 1 full and 4 partial tracts) A) Conventional B) Refinancings Number Average Value Number Average Value
LOANS ORIGINATED 4 $386,488 0 $0 APPLICATIONS APPROVED, NOT ACCEPTED 4 $485,388 0 $0 APPLICATIONS DENIED 1 $744,970 0 $0 APPLICATIONS WITHDRAWN 0 $0 2 $437,610 FILES CLOSED FOR INCOMPLETENESS 0 $0 0 $0
Aggregated Statistics For Year 2008(Based on 2 full and 4 partial tracts) A) Conventional C) Non-occupant Loans on Number Average Value Number Average Value
LOANS ORIGINATED 4 $470,292 0 $0 APPLICATIONS APPROVED, NOT ACCEPTED 5 $511,276 1 $194,280 APPLICATIONS DENIED 2 $738,050 1 $392,000 APPLICATIONS WITHDRAWN 1 $1,035,100 0 $0 FILES CLOSED FOR INCOMPLETENESS 1 $392,000 0 $0
Aggregated Statistics For Year 2007(Based on 2 full and 2 partial tracts) A) Conventional B) Refinancings C) Non-occupant Loans on Number Average Value Number Average Value Number Average Value
LOANS ORIGINATED 6 $450,723 0 $0 1 $466,000 APPLICATIONS APPROVED, NOT ACCEPTED 1 $391,700 1 $180,180 0 $0 APPLICATIONS DENIED 0 $0 0 $0 0 $0 APPLICATIONS WITHDRAWN 1 $347,050 0 $0 0 $0 FILES CLOSED FOR INCOMPLETENESS 0 $0 0 $0 0 $0
Aggregated Statistics For Year 2006(Based on 1 full and 2 partial tracts) A) Conventional Number Average Value
LOANS ORIGINATED 2 $575,400 APPLICATIONS APPROVED, NOT ACCEPTED 1 $248,340 APPLICATIONS DENIED 0 $0 APPLICATIONS WITHDRAWN 2 $385,040 FILES CLOSED FOR INCOMPLETENESS 0 $0
Aggregated Statistics For Year 2005(Based on 1 full and 1 partial tracts) A) Conventional C) Non-occupant Loans on Number Average Value Number Average Value
LOANS ORIGINATED 3 $196,520 0 $0 APPLICATIONS APPROVED, NOT ACCEPTED 1 $300,000 0 $0 APPLICATIONS DENIED 2 $713,000 1 $713,000 APPLICATIONS WITHDRAWN 0 $0 0 $0 FILES CLOSED FOR INCOMPLETENESS 0 $0 0 $0
Aggregated Statistics For Year 2004(Based on 2 full and 4 partial tracts) A) Conventional B) Refinancings Number Average Value Number Average Value
LOANS ORIGINATED 4 $375,012 1 $362,830 APPLICATIONS APPROVED, NOT ACCEPTED 5 $441,814 0 $0 APPLICATIONS DENIED 1 $413,640 0 $0 APPLICATIONS WITHDRAWN 1 $509,210 0 $0 FILES CLOSED FOR INCOMPLETENESS 0 $0 0 $0
Aggregated Statistics For Year 2003(Based on 1 full and 4 partial tracts) A) Conventional B) Refinancings Number Average Value Number Average Value
LOANS ORIGINATED 4 $368,635 1 $374,000 APPLICATIONS APPROVED, NOT ACCEPTED 4 $553,838 0 $0 APPLICATIONS DENIED 0 $0 0 $0 APPLICATIONS WITHDRAWN 1 $135,530 0 $0 FILES CLOSED FOR INCOMPLETENESS 0 $0 0 $0
Aggregated Statistics For Year 2002(Based on 2 full and 4 partial tracts) A) Conventional B) Refinancings Number Average Value Number Average Value
LOANS ORIGINATED 16 $372,785 2 $338,430 APPLICATIONS APPROVED, NOT ACCEPTED 10 $386,889 2 $549,000 APPLICATIONS DENIED 0 $0 0 $0 APPLICATIONS WITHDRAWN 0 $0 0 $0 FILES CLOSED FOR INCOMPLETENESS 0 $0 0 $0
Aggregated Statistics For Year 2001(Based on 2 full and 4 partial tracts) A) Conventional B) Refinancings C) Non-occupant Loans on Number Average Value Number Average Value Number Average Value
LOANS ORIGINATED 17 $294,497 1 $175,000 1 $182,580 APPLICATIONS APPROVED, NOT ACCEPTED 11 $354,833 1 $296,000 0 $0 APPLICATIONS DENIED 2 $265,500 0 $0 0 $0 APPLICATIONS WITHDRAWN 1 $355,150 1 $214,650 0 $0 FILES CLOSED FOR INCOMPLETENESS 0 $0 0 $0 0 $0
Aggregated Statistics For Year 2000(Based on 2 full and 4 partial tracts) A) Conventional C) Non-occupant Loans on Number Average Value Number Average Value
LOANS ORIGINATED 18 $260,673 1 $80,000 APPLICATIONS APPROVED, NOT ACCEPTED 3 $433,273 0 $0 APPLICATIONS DENIED 0 $0 0 $0 APPLICATIONS WITHDRAWN 0 $0 0 $0 FILES CLOSED FOR INCOMPLETENESS 0 $0 0 $0
Aggregated Statistics For Year 1999(Based on 2 full and 4 partial tracts) A) Conventional B) Refinancings C) Non-occupant Loans on Number Average Value Number Average Value Number Average Value
LOANS ORIGINATED 19 $285,965 3 $302,360 1 $192,360 APPLICATIONS APPROVED, NOT ACCEPTED 3 $422,817 1 $245,250 0 $0 APPLICATIONS DENIED 1 $209,660 0 $0 0 $0 APPLICATIONS WITHDRAWN 1 $347,160 0 $0 0 $0 FILES CLOSED FOR INCOMPLETENESS 0 $0 0 $0 0 $0
Detailed PMIC statistics for the following Tracts:
3010.00
, 3011.02 , 3012.00 , 3013.00 , 3014.00
Most common first names in Port Washington, NY among deceased individuals Name Count Lived (average)
John 227 75.1 years Mary 215 81.7 years William 154 75.6 years Joseph 139 77.5 years Margaret 112 78.4 years George 101 76.0 years Helen 94 81.3 years Robert 92 71.7 years Frank 91 76.8 years Anna 89 84.1 years
Most common last names in Port Washington, NY among deceased individuals Last name Count Lived (average)
Smith 48 78.1 years Salerno 28 80.5 years Brown 25 80.4 years Johnson 25 81.2 years Miller 19 78.8 years Demeo 19 77.6 years Lewis 18 77.9 years Moore 16 75.4 years Obrien 16 77.3 years Kelly 14 72.8 years
Port Washington compared to New York state average:
Median household income above state average. Median house value significantly above state average. Unemployed percentage significantly below state average. Black race population percentage significantly below state average. Renting percentage below state average. Length of stay since moving in above state average. Number of rooms per house above state average. Percentage of population with a bachelor's degree or higher significantly above state average. Port Washington on our top lists :
#16 on the list of "Top 101 cities with the smallest city-data.com crime index per police officer (population 5,000+)"
#27 on the list of "Top 101 cities with the most residents born in Chile (population 500+)"
#33 on the list of "Top 101 cities with the lowest number of assaults per 100,000 residents (population 5,000+)"
#38 on the list of "Top 101 cities with the lowest number of burglaries per 100,000 residents (population 5,000+)"
#40 on the list of "Top 101 cities with the largest city-data.com crime index decrease from 2002 to 2012 (population 5,000+)"
#58 on the list of "Top 101 cities with the lowest city-data.com crime index (population 5,000+)"
#58 on the list of "Top 100 safest cities (lowest city-data.com crime index) (pop. 5,000+)"
#64 on the list of "Top 101 cities with largest percentage of females in occupations: arts, design, entertainment, sports, and media occupations (population 5,000+)"
#81 on the list of "Top 101 cities with the largest racial income disparity between any two races with at least 200 householders"
#101 on the list of "Top 101 cities with the most residents born in Ecuador (population 500+)"
#8 on the list of "Top 101 counties with the most Orthodox adherents"
#9 on the list of "Top 101 counties with the most Catholic adherents"
#11 on the list of "Top 101 counties with the lowest percentage of residents that keep firearms around their homes"
#13 on the list of "Top 101 counties with the highest ground withdrawal of fresh water for public supply"
#13 on the list of "Top 101 counties with the most Orthodox congregations"
Top Patent Applicants
Fatih M. Ozluturk (43)
Hirotake Nozaki (24)
Todd J. Cohen (19)
Voravit Puvanakijjakorn (16)
Khaled Abdel-Hakim Helmy Aamer (14)
Seth Cirker (10)
Kyu Sang Han (10)
Fatih Ozluturk (10)
Shane Edward Harton (9)
Won Seok Oh (8)
Total of 420 patent applications in 2008-2024.


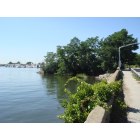

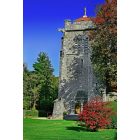
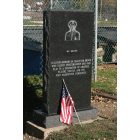


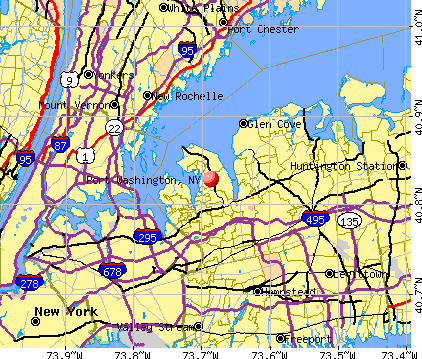


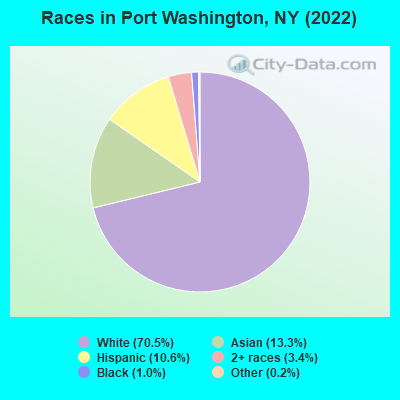
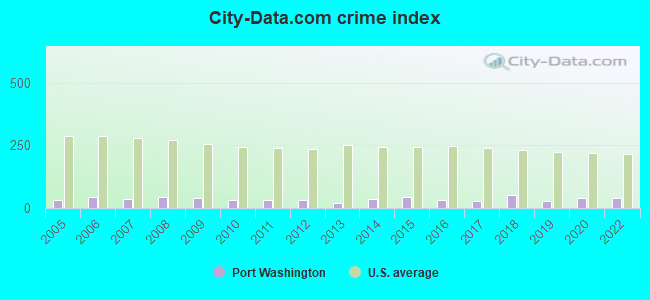
 Recent articles from our blog. Our writers, many of them Ph.D. graduates or candidates, create easy-to-read articles on a wide variety of topics.


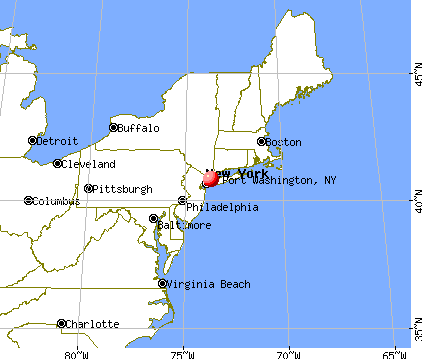
 (3.7 miles
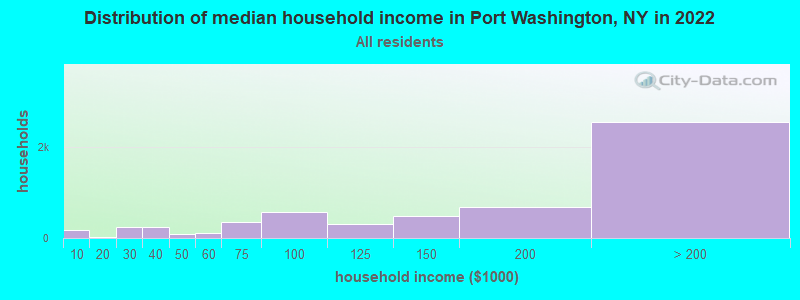
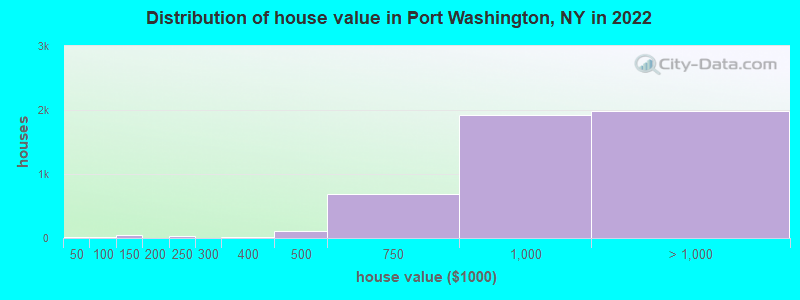
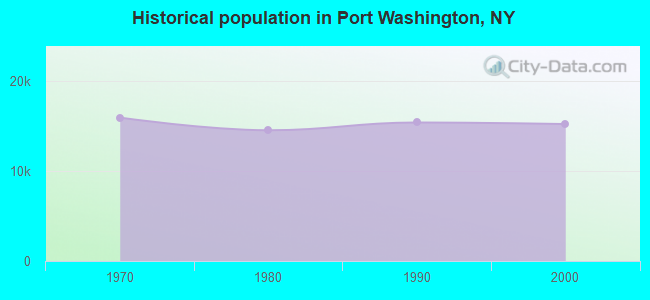
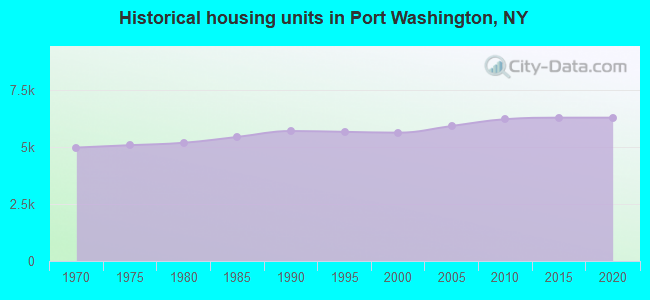
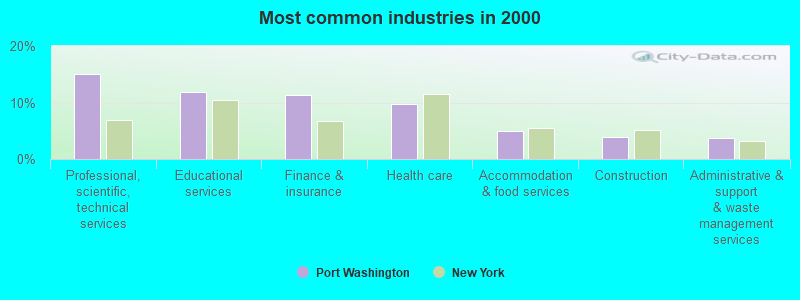
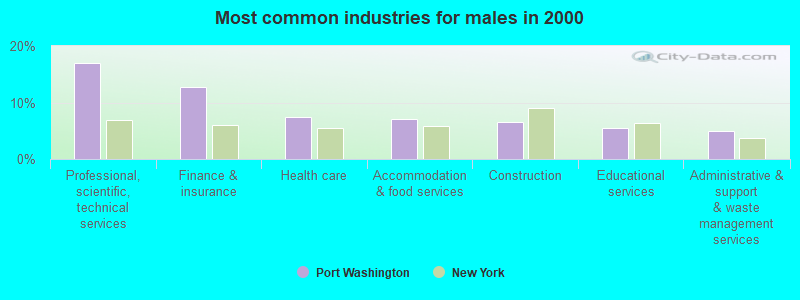
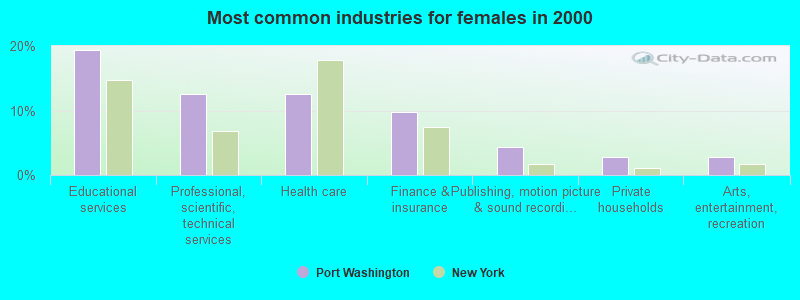
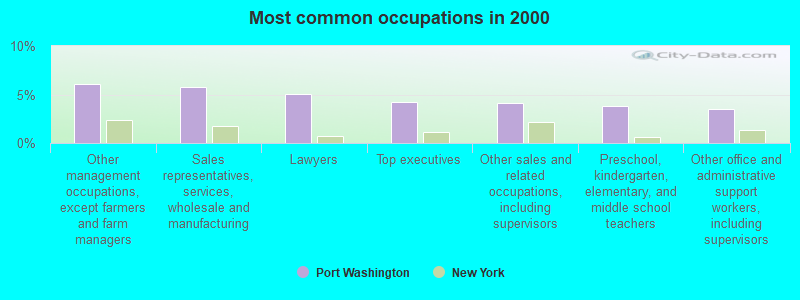
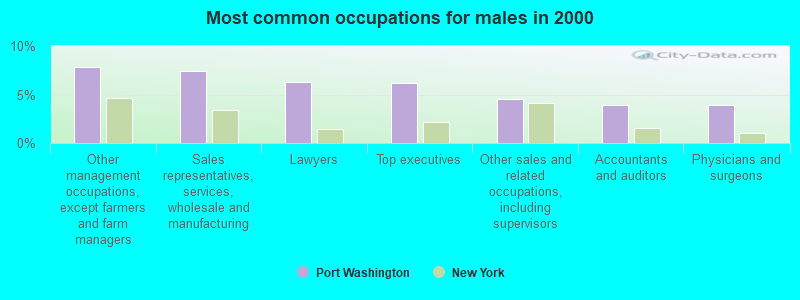
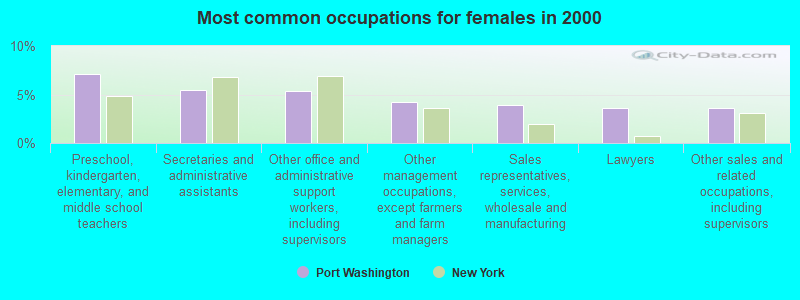
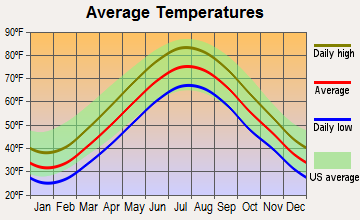
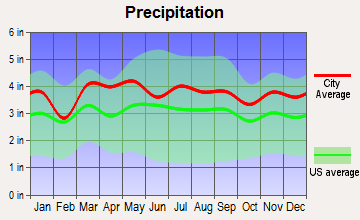
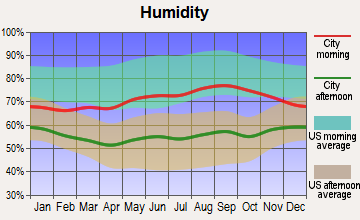
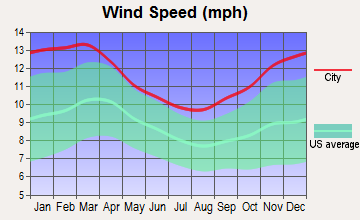
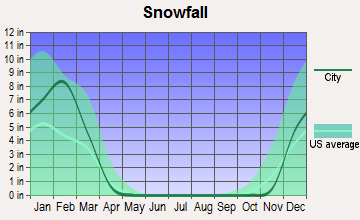
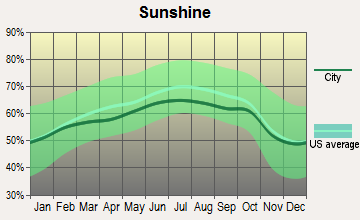
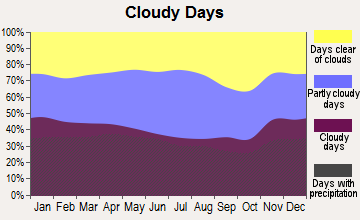


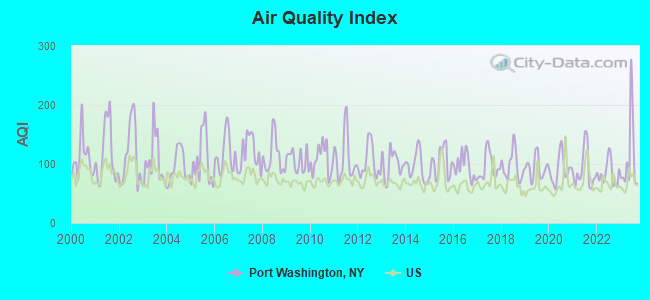
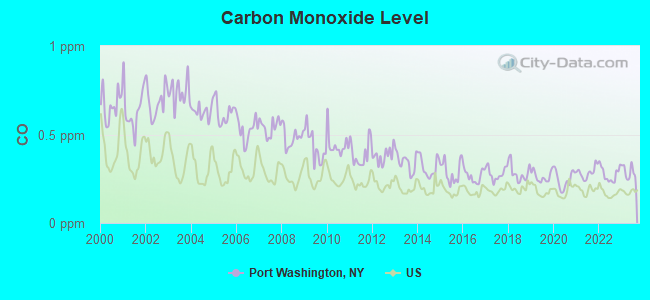
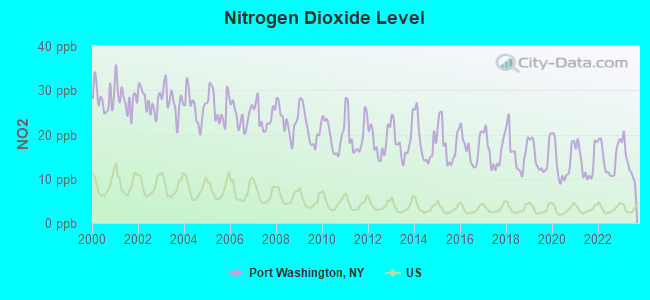
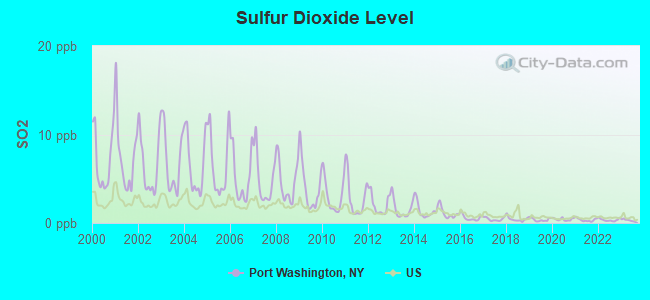
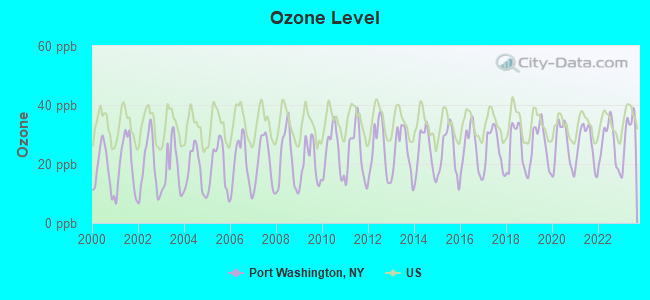
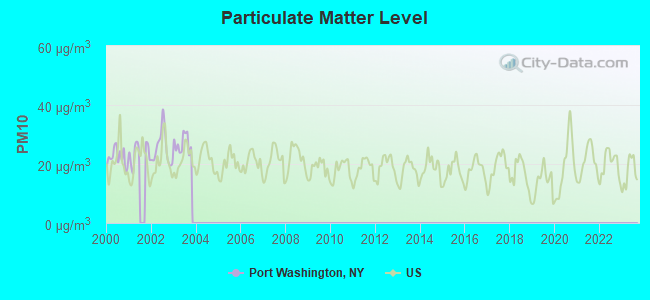
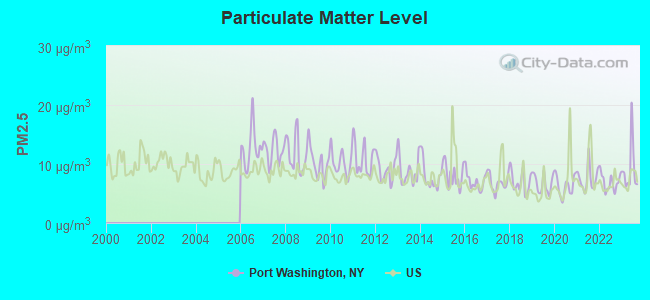
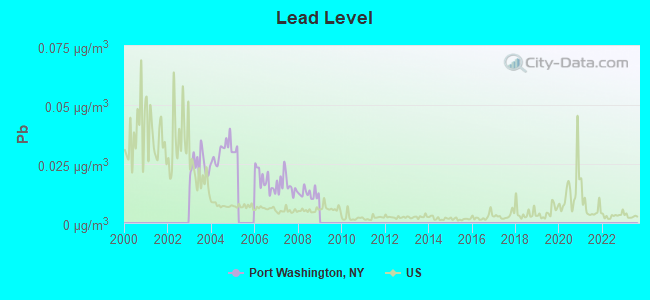
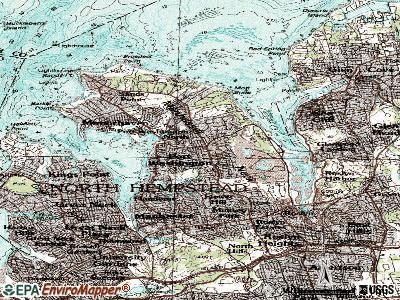
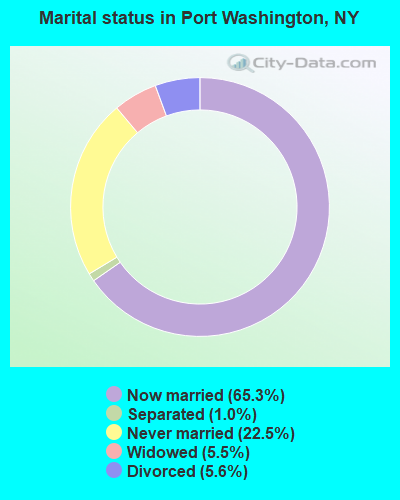
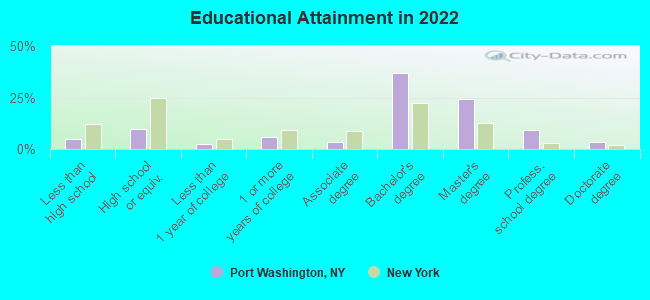
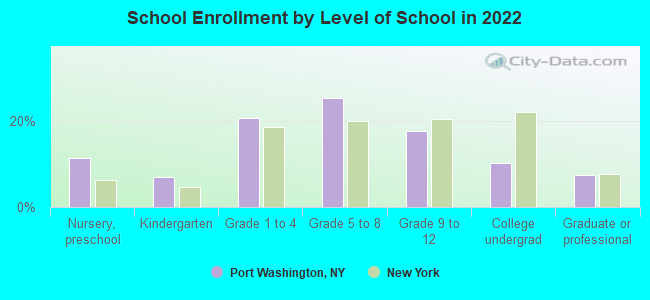
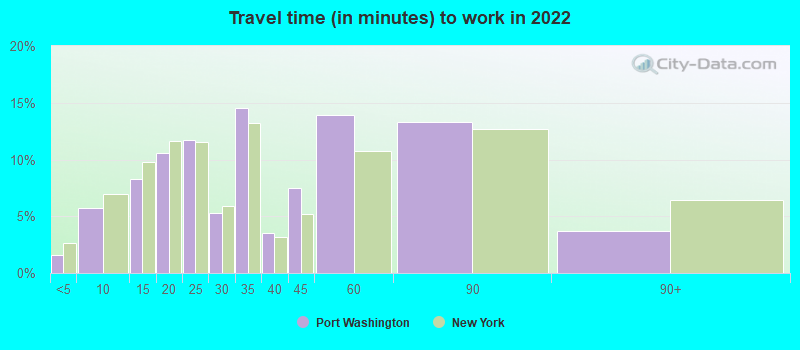
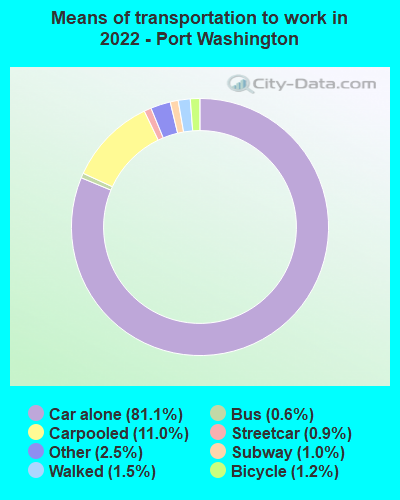
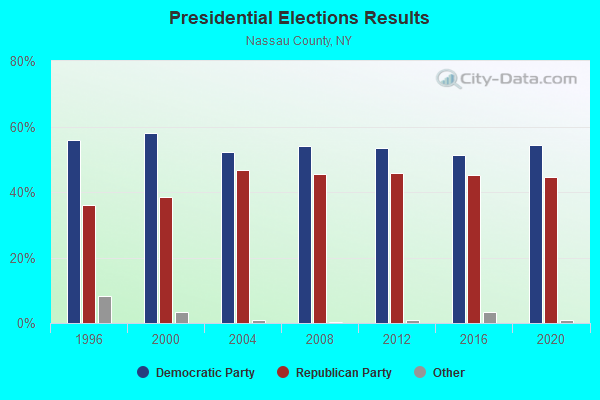
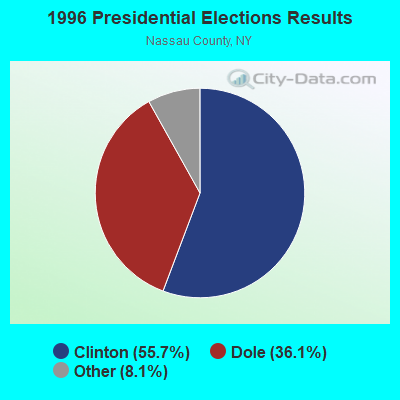
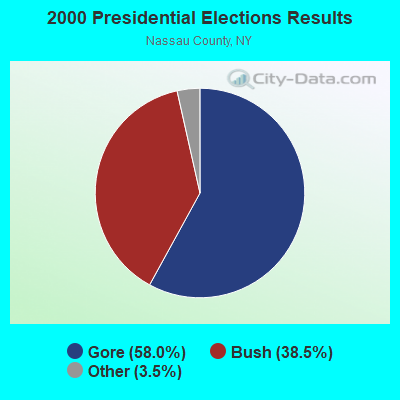
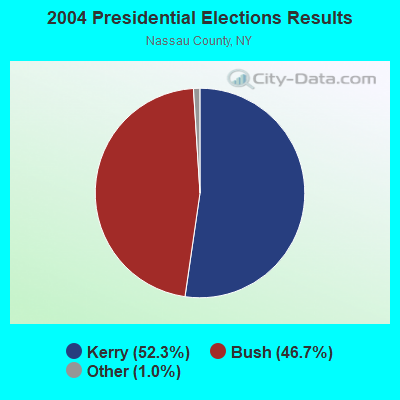
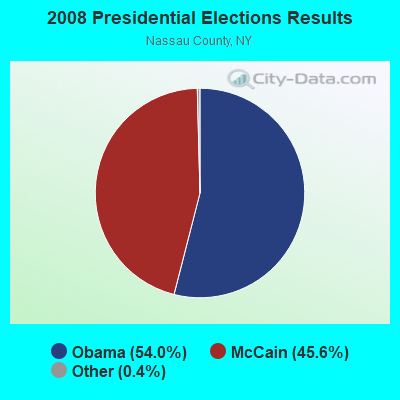
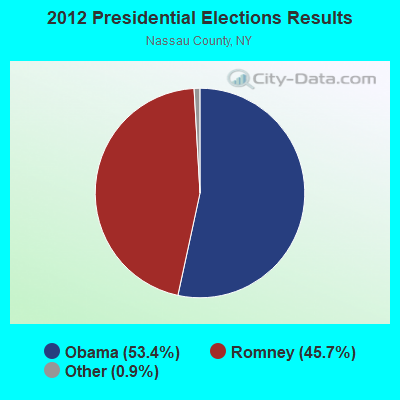
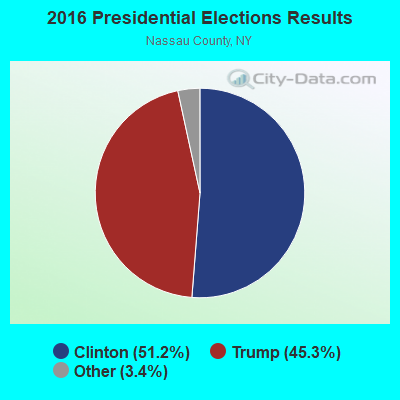
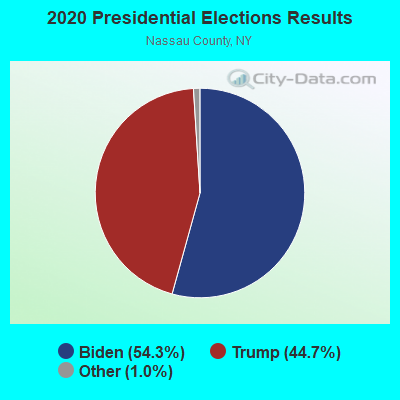
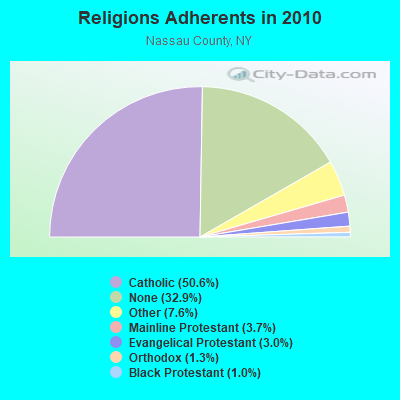
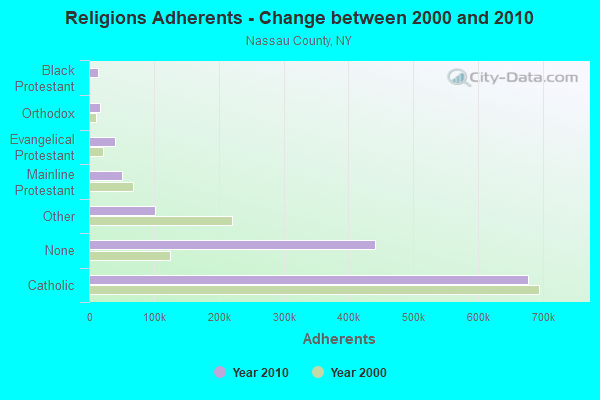
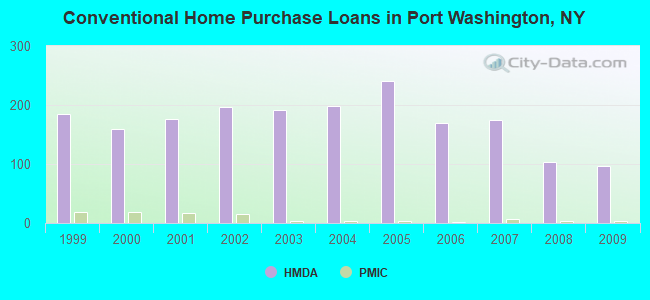
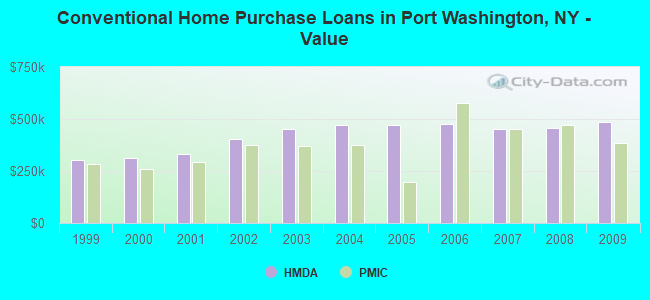
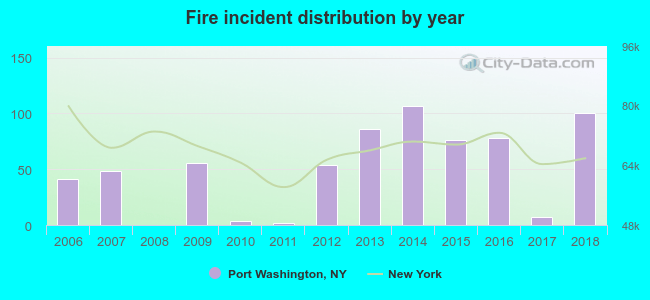 According to the data from the years 2006 - 2018 the average number of fire incidents per year is 51. The highest number of reported fire incidents - 107 took place in 2014, and the least - 0 in 2008. The data has an increasing trend.
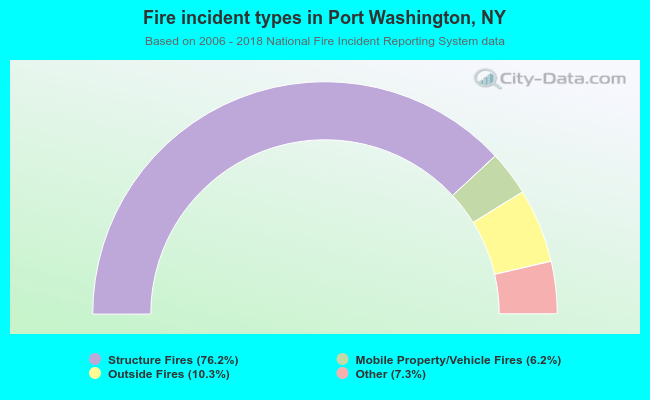 When looking into fire subcategories, the most incidents belonged to: Structure Fires (76.2%), and Outside Fires (10.3%).