Redmond, Washington Submit your own pictures of this city and show them to the world
OSM Map
General Map
Google Map
MSN Map
OSM Map
General Map
Google Map
MSN Map
OSM Map
General Map
Google Map
MSN Map
OSM Map
General Map
Google Map
MSN Map
Please wait while loading the map...
Population in 2022: 76,732 (100% urban, 0% rural). Population change since 2000: +69.6%Males: 40,054 Females: 36,678
March 2022 cost of living index in Redmond: 118.8 (more than average, U.S. average is 100) Percentage of residents living in poverty in 2022: 5.1%for White Non-Hispanic residents , 5.4% for Black residents , 10.6% for Hispanic or Latino residents , 21.6% for other race residents , 7.8% for two or more races residents )
Profiles of local businesses
Business Search - 14 Million verified businesses
Data:
Median household income ($)
Median household income (% change since 2000)
Household income diversity
Ratio of average income to average house value (%)
Ratio of average income to average rent
Median household income ($) - White
Median household income ($) - Black or African American
Median household income ($) - Asian
Median household income ($) - Hispanic or Latino
Median household income ($) - American Indian and Alaska Native
Median household income ($) - Multirace
Median household income ($) - Other Race
Median household income for houses/condos with a mortgage ($)
Median household income for apartments without a mortgage ($)
Races - White alone (%)
Races - White alone (% change since 2000)
Races - Black alone (%)
Races - Black alone (% change since 2000)
Races - American Indian alone (%)
Races - American Indian alone (% change since 2000)
Races - Asian alone (%)
Races - Asian alone (% change since 2000)
Races - Hispanic (%)
Races - Hispanic (% change since 2000)
Races - Native Hawaiian and Other Pacific Islander alone (%)
Races - Native Hawaiian and Other Pacific Islander alone (% change since 2000)
Races - Two or more races (%)
Races - Two or more races (% change since 2000)
Races - Other race alone (%)
Races - Other race alone (% change since 2000)
Racial diversity
Unemployment (%)
Unemployment (% change since 2000)
Unemployment (%) - White
Unemployment (%) - Black or African American
Unemployment (%) - Asian
Unemployment (%) - Hispanic or Latino
Unemployment (%) - American Indian and Alaska Native
Unemployment (%) - Multirace
Unemployment (%) - Other Race
Population density (people per square mile)
Population - Males (%)
Population - Females (%)
Population - Males (%) - White
Population - Males (%) - Black or African American
Population - Males (%) - Asian
Population - Males (%) - Hispanic or Latino
Population - Males (%) - American Indian and Alaska Native
Population - Males (%) - Multirace
Population - Males (%) - Other Race
Population - Females (%) - White
Population - Females (%) - Black or African American
Population - Females (%) - Asian
Population - Females (%) - Hispanic or Latino
Population - Females (%) - American Indian and Alaska Native
Population - Females (%) - Multirace
Population - Females (%) - Other Race
Coronavirus confirmed cases (Apr 26, 2024)
Deaths caused by coronavirus (Apr 26, 2024)
Coronavirus confirmed cases (per 100k population) (Apr 26, 2024)
Deaths caused by coronavirus (per 100k population) (Apr 26, 2024)
Daily increase in number of cases (Apr 26, 2024)
Weekly increase in number of cases (Apr 26, 2024)
Cases doubled (in days) (Apr 26, 2024)
Hospitalized patients (Apr 18, 2022)
Negative test results (Apr 18, 2022)
Total test results (Apr 18, 2022)
COVID Vaccine doses distributed (per 100k population) (Sep 19, 2023)
COVID Vaccine doses administered (per 100k population) (Sep 19, 2023)
COVID Vaccine doses distributed (Sep 19, 2023)
COVID Vaccine doses administered (Sep 19, 2023)
Likely homosexual households (%)
Likely homosexual households (% change since 2000)
Likely homosexual households - Lesbian couples (%)
Likely homosexual households - Lesbian couples (% change since 2000)
Likely homosexual households - Gay men (%)
Likely homosexual households - Gay men (% change since 2000)
Cost of living index
Median gross rent ($)
Median contract rent ($)
Median monthly housing costs ($)
Median house or condo value ($)
Median house or condo value ($ change since 2000)
Mean house or condo value by units in structure - 1, detached ($)
Mean house or condo value by units in structure - 1, attached ($)
Mean house or condo value by units in structure - 2 ($)
Mean house or condo value by units in structure by units in structure - 3 or 4 ($)
Mean house or condo value by units in structure - 5 or more ($)
Mean house or condo value by units in structure - Boat, RV, van, etc. ($)
Mean house or condo value by units in structure - Mobile home ($)
Median house or condo value ($) - White
Median house or condo value ($) - Black or African American
Median house or condo value ($) - Asian
Median house or condo value ($) - Hispanic or Latino
Median house or condo value ($) - American Indian and Alaska Native
Median house or condo value ($) - Multirace
Median house or condo value ($) - Other Race
Median resident age
Resident age diversity
Median resident age - Males
Median resident age - Females
Median resident age - White
Median resident age - Black or African American
Median resident age - Asian
Median resident age - Hispanic or Latino
Median resident age - American Indian and Alaska Native
Median resident age - Multirace
Median resident age - Other Race
Median resident age - Males - White
Median resident age - Males - Black or African American
Median resident age - Males - Asian
Median resident age - Males - Hispanic or Latino
Median resident age - Males - American Indian and Alaska Native
Median resident age - Males - Multirace
Median resident age - Males - Other Race
Median resident age - Females - White
Median resident age - Females - Black or African American
Median resident age - Females - Asian
Median resident age - Females - Hispanic or Latino
Median resident age - Females - American Indian and Alaska Native
Median resident age - Females - Multirace
Median resident age - Females - Other Race
Commute - mean travel time to work (minutes)
Travel time to work - Less than 5 minutes (%)
Travel time to work - Less than 5 minutes (% change since 2000)
Travel time to work - 5 to 9 minutes (%)
Travel time to work - 5 to 9 minutes (% change since 2000)
Travel time to work - 10 to 19 minutes (%)
Travel time to work - 10 to 19 minutes (% change since 2000)
Travel time to work - 20 to 29 minutes (%)
Travel time to work - 20 to 29 minutes (% change since 2000)
Travel time to work - 30 to 39 minutes (%)
Travel time to work - 30 to 39 minutes (% change since 2000)
Travel time to work - 40 to 59 minutes (%)
Travel time to work - 40 to 59 minutes (% change since 2000)
Travel time to work - 60 to 89 minutes (%)
Travel time to work - 60 to 89 minutes (% change since 2000)
Travel time to work - 90 or more minutes (%)
Travel time to work - 90 or more minutes (% change since 2000)
Marital status - Never married (%)
Marital status - Now married (%)
Marital status - Separated (%)
Marital status - Widowed (%)
Marital status - Divorced (%)
Median family income ($)
Median family income (% change since 2000)
Median non-family income ($)
Median non-family income (% change since 2000)
Median per capita income ($)
Median per capita income (% change since 2000)
Median family income ($) - White
Median family income ($) - Black or African American
Median family income ($) - Asian
Median family income ($) - Hispanic or Latino
Median family income ($) - American Indian and Alaska Native
Median family income ($) - Multirace
Median family income ($) - Other Race
Median year house/condo built
Median year apartment built
Year house built - Built 2005 or later (%)
Year house built - Built 2000 to 2004 (%)
Year house built - Built 1990 to 1999 (%)
Year house built - Built 1980 to 1989 (%)
Year house built - Built 1970 to 1979 (%)
Year house built - Built 1960 to 1969 (%)
Year house built - Built 1950 to 1959 (%)
Year house built - Built 1940 to 1949 (%)
Year house built - Built 1939 or earlier (%)
Average household size
Household density (households per square mile)
Average household size - White
Average household size - Black or African American
Average household size - Asian
Average household size - Hispanic or Latino
Average household size - American Indian and Alaska Native
Average household size - Multirace
Average household size - Other Race
Occupied housing units (%)
Vacant housing units (%)
Owner occupied housing units (%)
Renter occupied housing units (%)
Vacancy status - For rent (%)
Vacancy status - For sale only (%)
Vacancy status - Rented or sold, not occupied (%)
Vacancy status - For seasonal, recreational, or occasional use (%)
Vacancy status - For migrant workers (%)
Vacancy status - Other vacant (%)
Residents with income below the poverty level (%)
Residents with income below 50% of the poverty level (%)
Children below poverty level (%)
Poor families by family type - Married-couple family (%)
Poor families by family type - Male, no wife present (%)
Poor families by family type - Female, no husband present (%)
Poverty status for native-born residents (%)
Poverty status for foreign-born residents (%)
Poverty among high school graduates not in families (%)
Poverty among people who did not graduate high school not in families (%)
Residents with income below the poverty level (%) - White
Residents with income below the poverty level (%) - Black or African American
Residents with income below the poverty level (%) - Asian
Residents with income below the poverty level (%) - Hispanic or Latino
Residents with income below the poverty level (%) - American Indian and Alaska Native
Residents with income below the poverty level (%) - Multirace
Residents with income below the poverty level (%) - Other Race
Air pollution - Air Quality Index (AQI)
Air pollution - CO
Air pollution - NO2
Air pollution - SO2
Air pollution - Ozone
Air pollution - PM10
Air pollution - PM25
Air pollution - Pb
Crime - Murders per 100,000 population
Crime - Rapes per 100,000 population
Crime - Robberies per 100,000 population
Crime - Assaults per 100,000 population
Crime - Burglaries per 100,000 population
Crime - Thefts per 100,000 population
Crime - Auto thefts per 100,000 population
Crime - Arson per 100,000 population
Crime - City-data.com crime index
Crime - Violent crime index
Crime - Property crime index
Crime - Murders per 100,000 population (5 year average)
Crime - Rapes per 100,000 population (5 year average)
Crime - Robberies per 100,000 population (5 year average)
Crime - Assaults per 100,000 population (5 year average)
Crime - Burglaries per 100,000 population (5 year average)
Crime - Thefts per 100,000 population (5 year average)
Crime - Auto thefts per 100,000 population (5 year average)
Crime - Arson per 100,000 population (5 year average)
Crime - City-data.com crime index (5 year average)
Crime - Violent crime index (5 year average)
Crime - Property crime index (5 year average)
1996 Presidential Elections Results (%) - Democratic Party (Clinton)
1996 Presidential Elections Results (%) - Republican Party (Dole)
1996 Presidential Elections Results (%) - Other
2000 Presidential Elections Results (%) - Democratic Party (Gore)
2000 Presidential Elections Results (%) - Republican Party (Bush)
2000 Presidential Elections Results (%) - Other
2004 Presidential Elections Results (%) - Democratic Party (Kerry)
2004 Presidential Elections Results (%) - Republican Party (Bush)
2004 Presidential Elections Results (%) - Other
2008 Presidential Elections Results (%) - Democratic Party (Obama)
2008 Presidential Elections Results (%) - Republican Party (McCain)
2008 Presidential Elections Results (%) - Other
2012 Presidential Elections Results (%) - Democratic Party (Obama)
2012 Presidential Elections Results (%) - Republican Party (Romney)
2012 Presidential Elections Results (%) - Other
2016 Presidential Elections Results (%) - Democratic Party (Clinton)
2016 Presidential Elections Results (%) - Republican Party (Trump)
2016 Presidential Elections Results (%) - Other
2020 Presidential Elections Results (%) - Democratic Party (Biden)
2020 Presidential Elections Results (%) - Republican Party (Trump)
2020 Presidential Elections Results (%) - Other
Ancestries Reported - Arab (%)
Ancestries Reported - Czech (%)
Ancestries Reported - Danish (%)
Ancestries Reported - Dutch (%)
Ancestries Reported - English (%)
Ancestries Reported - French (%)
Ancestries Reported - French Canadian (%)
Ancestries Reported - German (%)
Ancestries Reported - Greek (%)
Ancestries Reported - Hungarian (%)
Ancestries Reported - Irish (%)
Ancestries Reported - Italian (%)
Ancestries Reported - Lithuanian (%)
Ancestries Reported - Norwegian (%)
Ancestries Reported - Polish (%)
Ancestries Reported - Portuguese (%)
Ancestries Reported - Russian (%)
Ancestries Reported - Scotch-Irish (%)
Ancestries Reported - Scottish (%)
Ancestries Reported - Slovak (%)
Ancestries Reported - Subsaharan African (%)
Ancestries Reported - Swedish (%)
Ancestries Reported - Swiss (%)
Ancestries Reported - Ukrainian (%)
Ancestries Reported - United States (%)
Ancestries Reported - Welsh (%)
Ancestries Reported - West Indian (%)
Ancestries Reported - Other (%)
Educational Attainment - No schooling completed (%)
Educational Attainment - Less than high school (%)
Educational Attainment - High school or equivalent (%)
Educational Attainment - Less than 1 year of college (%)
Educational Attainment - 1 or more years of college (%)
Educational Attainment - Associate degree (%)
Educational Attainment - Bachelor's degree (%)
Educational Attainment - Master's degree (%)
Educational Attainment - Professional school degree (%)
Educational Attainment - Doctorate degree (%)
School Enrollment - Nursery, preschool (%)
School Enrollment - Kindergarten (%)
School Enrollment - Grade 1 to 4 (%)
School Enrollment - Grade 5 to 8 (%)
School Enrollment - Grade 9 to 12 (%)
School Enrollment - College undergrad (%)
School Enrollment - Graduate or professional (%)
School Enrollment - Not enrolled in school (%)
School enrollment - Public schools (%)
School enrollment - Private schools (%)
School enrollment - Not enrolled (%)
Median number of rooms in houses and condos
Median number of rooms in apartments
Housing units lacking complete plumbing facilities (%)
Housing units lacking complete kitchen facilities (%)
Density of houses
Urban houses (%)
Rural houses (%)
Households with people 60 years and over (%)
Households with people 65 years and over (%)
Households with people 75 years and over (%)
Households with one or more nonrelatives (%)
Households with no nonrelatives (%)
Population in households (%)
Family households (%)
Nonfamily households (%)
Population in families (%)
Family households with own children (%)
Median number of bedrooms in owner occupied houses
Mean number of bedrooms in owner occupied houses
Median number of bedrooms in renter occupied houses
Mean number of bedrooms in renter occupied houses
Median number of vehichles in owner occupied houses
Mean number of vehichles in owner occupied houses
Median number of vehichles in renter occupied houses
Mean number of vehichles in renter occupied houses
Mortgage status - with mortgage (%)
Mortgage status - with second mortgage (%)
Mortgage status - with home equity loan (%)
Mortgage status - with both second mortgage and home equity loan (%)
Mortgage status - without a mortgage (%)
Average family size
Average family size - White
Average family size - Black or African American
Average family size - Asian
Average family size - Hispanic or Latino
Average family size - American Indian and Alaska Native
Average family size - Multirace
Average family size - Other Race
Geographical mobility - Same house 1 year ago (%)
Geographical mobility - Moved within same county (%)
Geographical mobility - Moved from different county within same state (%)
Geographical mobility - Moved from different state (%)
Geographical mobility - Moved from abroad (%)
Place of birth - Born in state of residence (%)
Place of birth - Born in other state (%)
Place of birth - Native, outside of US (%)
Place of birth - Foreign born (%)
Housing units in structures - 1, detached (%)
Housing units in structures - 1, attached (%)
Housing units in structures - 2 (%)
Housing units in structures - 3 or 4 (%)
Housing units in structures - 5 to 9 (%)
Housing units in structures - 10 to 19 (%)
Housing units in structures - 20 to 49 (%)
Housing units in structures - 50 or more (%)
Housing units in structures - Mobile home (%)
Housing units in structures - Boat, RV, van, etc. (%)
House/condo owner moved in on average (years ago)
Renter moved in on average (years ago)
Year householder moved into unit - Moved in 1999 to March 2000 (%)
Year householder moved into unit - Moved in 1995 to 1998 (%)
Year householder moved into unit - Moved in 1990 to 1994 (%)
Year householder moved into unit - Moved in 1980 to 1989 (%)
Year householder moved into unit - Moved in 1970 to 1979 (%)
Year householder moved into unit - Moved in 1969 or earlier (%)
Means of transportation to work - Drove car alone (%)
Means of transportation to work - Carpooled (%)
Means of transportation to work - Public transportation (%)
Means of transportation to work - Bus or trolley bus (%)
Means of transportation to work - Streetcar or trolley car (%)
Means of transportation to work - Subway or elevated (%)
Means of transportation to work - Railroad (%)
Means of transportation to work - Ferryboat (%)
Means of transportation to work - Taxicab (%)
Means of transportation to work - Motorcycle (%)
Means of transportation to work - Bicycle (%)
Means of transportation to work - Walked (%)
Means of transportation to work - Other means (%)
Working at home (%)
Industry diversity
Most Common Industries - Agriculture, forestry, fishing and hunting, and mining (%)
Most Common Industries - Agriculture, forestry, fishing and hunting (%)
Most Common Industries - Mining, quarrying, and oil and gas extraction (%)
Most Common Industries - Construction (%)
Most Common Industries - Manufacturing (%)
Most Common Industries - Wholesale trade (%)
Most Common Industries - Retail trade (%)
Most Common Industries - Transportation and warehousing, and utilities (%)
Most Common Industries - Transportation and warehousing (%)
Most Common Industries - Utilities (%)
Most Common Industries - Information (%)
Most Common Industries - Finance and insurance, and real estate and rental and leasing (%)
Most Common Industries - Finance and insurance (%)
Most Common Industries - Real estate and rental and leasing (%)
Most Common Industries - Professional, scientific, and management, and administrative and waste management services (%)
Most Common Industries - Professional, scientific, and technical services (%)
Most Common Industries - Management of companies and enterprises (%)
Most Common Industries - Administrative and support and waste management services (%)
Most Common Industries - Educational services, and health care and social assistance (%)
Most Common Industries - Educational services (%)
Most Common Industries - Health care and social assistance (%)
Most Common Industries - Arts, entertainment, and recreation, and accommodation and food services (%)
Most Common Industries - Arts, entertainment, and recreation (%)
Most Common Industries - Accommodation and food services (%)
Most Common Industries - Other services, except public administration (%)
Most Common Industries - Public administration (%)
Occupation diversity
Most Common Occupations - Management, business, science, and arts occupations (%)
Most Common Occupations - Management, business, and financial occupations (%)
Most Common Occupations - Management occupations (%)
Most Common Occupations - Business and financial operations occupations (%)
Most Common Occupations - Computer, engineering, and science occupations (%)
Most Common Occupations - Computer and mathematical occupations (%)
Most Common Occupations - Architecture and engineering occupations (%)
Most Common Occupations - Life, physical, and social science occupations (%)
Most Common Occupations - Education, legal, community service, arts, and media occupations (%)
Most Common Occupations - Community and social service occupations (%)
Most Common Occupations - Legal occupations (%)
Most Common Occupations - Education, training, and library occupations (%)
Most Common Occupations - Arts, design, entertainment, sports, and media occupations (%)
Most Common Occupations - Healthcare practitioners and technical occupations (%)
Most Common Occupations - Health diagnosing and treating practitioners and other technical occupations (%)
Most Common Occupations - Health technologists and technicians (%)
Most Common Occupations - Service occupations (%)
Most Common Occupations - Healthcare support occupations (%)
Most Common Occupations - Protective service occupations (%)
Most Common Occupations - Fire fighting and prevention, and other protective service workers including supervisors (%)
Most Common Occupations - Law enforcement workers including supervisors (%)
Most Common Occupations - Food preparation and serving related occupations (%)
Most Common Occupations - Building and grounds cleaning and maintenance occupations (%)
Most Common Occupations - Personal care and service occupations (%)
Most Common Occupations - Sales and office occupations (%)
Most Common Occupations - Sales and related occupations (%)
Most Common Occupations - Office and administrative support occupations (%)
Most Common Occupations - Natural resources, construction, and maintenance occupations (%)
Most Common Occupations - Farming, fishing, and forestry occupations (%)
Most Common Occupations - Construction and extraction occupations (%)
Most Common Occupations - Installation, maintenance, and repair occupations (%)
Most Common Occupations - Production, transportation, and material moving occupations (%)
Most Common Occupations - Production occupations (%)
Most Common Occupations - Transportation occupations (%)
Most Common Occupations - Material moving occupations (%)
People in Group quarters - Institutionalized population (%)
People in Group quarters - Correctional institutions (%)
People in Group quarters - Federal prisons and detention centers (%)
People in Group quarters - Halfway houses (%)
People in Group quarters - Local jails and other confinement facilities (including police lockups) (%)
People in Group quarters - Military disciplinary barracks (%)
People in Group quarters - State prisons (%)
People in Group quarters - Other types of correctional institutions (%)
People in Group quarters - Nursing homes (%)
People in Group quarters - Hospitals/wards, hospices, and schools for the handicapped (%)
People in Group quarters - Hospitals/wards and hospices for chronically ill (%)
People in Group quarters - Hospices or homes for chronically ill (%)
People in Group quarters - Military hospitals or wards for chronically ill (%)
People in Group quarters - Other hospitals or wards for chronically ill (%)
People in Group quarters - Hospitals or wards for drug/alcohol abuse (%)
People in Group quarters - Mental (Psychiatric) hospitals or wards (%)
People in Group quarters - Schools, hospitals, or wards for the mentally retarded (%)
People in Group quarters - Schools, hospitals, or wards for the physically handicapped (%)
People in Group quarters - Institutions for the deaf (%)
People in Group quarters - Institutions for the blind (%)
People in Group quarters - Orthopedic wards and institutions for the physically handicapped (%)
People in Group quarters - Wards in general hospitals for patients who have no usual home elsewhere (%)
People in Group quarters - Wards in military hospitals for patients who have no usual home elsewhere (%)
People in Group quarters - Juvenile institutions (%)
People in Group quarters - Long-term care (%)
People in Group quarters - Homes for abused, dependent, and neglected children (%)
People in Group quarters - Residential treatment centers for emotionally disturbed children (%)
People in Group quarters - Training schools for juvenile delinquents (%)
People in Group quarters - Short-term care, detention or diagnostic centers for delinquent children (%)
People in Group quarters - Type of juvenile institution unknown (%)
People in Group quarters - Noninstitutionalized population (%)
People in Group quarters - College dormitories (includes college quarters off campus) (%)
People in Group quarters - Military quarters (%)
People in Group quarters - On base (%)
People in Group quarters - Barracks, unaccompanied personnel housing (UPH), (Enlisted/Officer), ;and similar group living quarters for military personnel (%)
People in Group quarters - Transient quarters for temporary residents (%)
People in Group quarters - Military ships (%)
People in Group quarters - Group homes (%)
People in Group quarters - Homes or halfway houses for drug/alcohol abuse (%)
People in Group quarters - Homes for the mentally ill (%)
People in Group quarters - Homes for the mentally retarded (%)
People in Group quarters - Homes for the physically handicapped (%)
People in Group quarters - Other group homes (%)
People in Group quarters - Religious group quarters (%)
People in Group quarters - Dormitories (%)
People in Group quarters - Agriculture workers' dormitories on farms (%)
People in Group quarters - Job Corps and vocational training facilities (%)
People in Group quarters - Other workers' dormitories (%)
People in Group quarters - Crews of maritime vessels (%)
People in Group quarters - Other nonhousehold living situations (%)
People in Group quarters - Other noninstitutional group quarters (%)
Residents speaking English at home (%)
Residents speaking English at home - Born in the United States (%)
Residents speaking English at home - Native, born elsewhere (%)
Residents speaking English at home - Foreign born (%)
Residents speaking Spanish at home (%)
Residents speaking Spanish at home - Born in the United States (%)
Residents speaking Spanish at home - Native, born elsewhere (%)
Residents speaking Spanish at home - Foreign born (%)
Residents speaking other language at home (%)
Residents speaking other language at home - Born in the United States (%)
Residents speaking other language at home - Native, born elsewhere (%)
Residents speaking other language at home - Foreign born (%)
Class of Workers - Employee of private company (%)
Class of Workers - Self-employed in own incorporated business (%)
Class of Workers - Private not-for-profit wage and salary workers (%)
Class of Workers - Local government workers (%)
Class of Workers - State government workers (%)
Class of Workers - Federal government workers (%)
Class of Workers - Self-employed workers in own not incorporated business and Unpaid family workers (%)
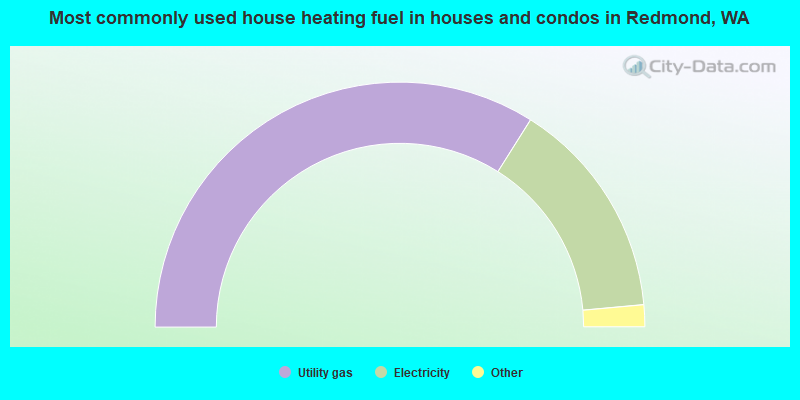
House heating fuel used in houses and condos - Utility gas (%)
House heating fuel used in houses and condos - Bottled, tank, or LP gas (%)
House heating fuel used in houses and condos - Electricity (%)
House heating fuel used in houses and condos - Fuel oil, kerosene, etc. (%)
House heating fuel used in houses and condos - Coal or coke (%)
House heating fuel used in houses and condos - Wood (%)
House heating fuel used in houses and condos - Solar energy (%)
House heating fuel used in houses and condos - Other fuel (%)
House heating fuel used in houses and condos - No fuel used (%)
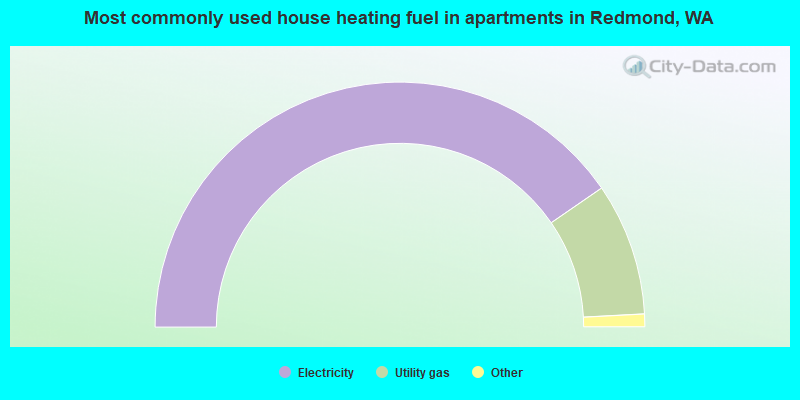
House heating fuel used in apartments - Utility gas (%)
House heating fuel used in apartments - Bottled, tank, or LP gas (%)
House heating fuel used in apartments - Electricity (%)
House heating fuel used in apartments - Fuel oil, kerosene, etc. (%)
House heating fuel used in apartments - Coal or coke (%)
House heating fuel used in apartments - Wood (%)
House heating fuel used in apartments - Solar energy (%)
House heating fuel used in apartments - Other fuel (%)
House heating fuel used in apartments - No fuel used (%)
Armed forces status - In Armed Forces (%)
Armed forces status - Civilian (%)
Armed forces status - Civilian - Veteran (%)
Armed forces status - Civilian - Nonveteran (%)
Fatal accidents locations in years 2005-2021
Fatal accidents locations in 2005
Fatal accidents locations in 2006
Fatal accidents locations in 2007
Fatal accidents locations in 2008
Fatal accidents locations in 2009
Fatal accidents locations in 2010
Fatal accidents locations in 2011
Fatal accidents locations in 2012
Fatal accidents locations in 2013
Fatal accidents locations in 2014
Fatal accidents locations in 2015
Fatal accidents locations in 2016
Fatal accidents locations in 2017
Fatal accidents locations in 2018
Fatal accidents locations in 2019
Fatal accidents locations in 2020
Fatal accidents locations in 2021
Alcohol use - People drinking some alcohol every month (%)
Alcohol use - People not drinking at all (%)
Alcohol use - Average days/month drinking alcohol
Alcohol use - Average drinks/week
Alcohol use - Average days/year people drink much
Audiometry - Average condition of hearing (%)
Audiometry - People that can hear a whisper from across a quiet room (%)
Audiometry - People that can hear normal voice from across a quiet room (%)
Audiometry - Ears ringing, roaring, buzzing (%)
Audiometry - Had a job exposure to loud noise (%)
Audiometry - Had off-work exposure to loud noise (%)
Blood Pressure & Cholesterol - Has high blood pressure (%)
Blood Pressure & Cholesterol - Checking blood pressure at home (%)
Blood Pressure & Cholesterol - Frequently checking blood cholesterol (%)
Blood Pressure & Cholesterol - Has high cholesterol level (%)
Consumer Behavior - Money monthly spent on food at supermarket/grocery store
Consumer Behavior - Money monthly spent on food at other stores
Consumer Behavior - Money monthly spent on eating out
Consumer Behavior - Money monthly spent on carryout/delivered foods
Consumer Behavior - Income spent on food at supermarket/grocery store (%)
Consumer Behavior - Income spent on food at other stores (%)
Consumer Behavior - Income spent on eating out (%)
Consumer Behavior - Income spent on carryout/delivered foods (%)
Current Health Status - General health condition (%)
Current Health Status - Blood donors (%)
Current Health Status - Has blood ever tested for HIV virus (%)
Current Health Status - Left-handed people (%)
Dermatology - People using sunscreen (%)
Diabetes - Diabetics (%)
Diabetes - Had a blood test for high blood sugar (%)
Diabetes - People taking insulin (%)
Diet Behavior & Nutrition - Diet health (%)
Diet Behavior & Nutrition - Milk product consumption (# of products/month)
Diet Behavior & Nutrition - Meals not home prepared (#/week)
Diet Behavior & Nutrition - Meals from fast food or pizza place (#/week)
Diet Behavior & Nutrition - Ready-to-eat foods (#/month)
Diet Behavior & Nutrition - Frozen meals/pizza (#/month)
Drug Use - People that ever used marijuana or hashish (%)
Drug Use - Ever used hard drugs (%)
Drug Use - Ever used any form of cocaine (%)
Drug Use - Ever used heroin (%)
Drug Use - Ever used methamphetamine (%)
Health Insurance - People covered by health insurance (%)
Kidney Conditions-Urology - Avg. # of times urinating at night
Medical Conditions - People with asthma (%)
Medical Conditions - People with anemia (%)
Medical Conditions - People with psoriasis (%)
Medical Conditions - People with overweight (%)
Medical Conditions - Elderly people having difficulties in thinking or remembering (%)
Medical Conditions - People who ever received blood transfusion (%)
Medical Conditions - People having trouble seeing even with glass/contacts (%)
Medical Conditions - People with arthritis (%)
Medical Conditions - People with gout (%)
Medical Conditions - People with congestive heart failure (%)
Medical Conditions - People with coronary heart disease (%)
Medical Conditions - People with angina pectoris (%)
Medical Conditions - People who ever had heart attack (%)
Medical Conditions - People who ever had stroke (%)
Medical Conditions - People with emphysema (%)
Medical Conditions - People with thyroid problem (%)
Medical Conditions - People with chronic bronchitis (%)
Medical Conditions - People with any liver condition (%)
Medical Conditions - People who ever had cancer or malignancy (%)
Mental Health - People who have little interest in doing things (%)
Mental Health - People feeling down, depressed, or hopeless (%)
Mental Health - People who have trouble sleeping or sleeping too much (%)
Mental Health - People feeling tired or having little energy (%)
Mental Health - People with poor appetite or overeating (%)
Mental Health - People feeling bad about themself (%)
Mental Health - People who have trouble concentrating on things (%)
Mental Health - People moving or speaking slowly or too fast (%)
Mental Health - People having thoughts they would be better off dead (%)
Oral Health - Average years since last visit a dentist
Oral Health - People embarrassed because of mouth (%)
Oral Health - People with gum disease (%)
Oral Health - General health of teeth and gums (%)
Oral Health - Average days a week using dental floss/device
Oral Health - Average days a week using mouthwash for dental problem
Oral Health - Average number of teeth
Pesticide Use - Households using pesticides to control insects (%)
Pesticide Use - Households using pesticides to kill weeds (%)
Physical Activity - People doing vigorous-intensity work activities (%)
Physical Activity - People doing moderate-intensity work activities (%)
Physical Activity - People walking or bicycling (%)
Physical Activity - People doing vigorous-intensity recreational activities (%)
Physical Activity - People doing moderate-intensity recreational activities (%)
Physical Activity - Average hours a day doing sedentary activities
Physical Activity - Average hours a day watching TV or videos
Physical Activity - Average hours a day using computer
Physical Functioning - People having limitations keeping them from working (%)
Physical Functioning - People limited in amount of work they can do (%)
Physical Functioning - People that need special equipment to walk (%)
Physical Functioning - People experiencing confusion/memory problems (%)
Physical Functioning - People requiring special healthcare equipment (%)
Prescription Medications - Average number of prescription medicines taking
Preventive Aspirin Use - Adults 40+ taking low-dose aspirin (%)
Reproductive Health - Vaginal deliveries (%)
Reproductive Health - Cesarean deliveries (%)
Reproductive Health - Deliveries resulted in a live birth (%)
Reproductive Health - Pregnancies resulted in a delivery (%)
Reproductive Health - Women breastfeeding newborns (%)
Reproductive Health - Women that had a hysterectomy (%)
Reproductive Health - Women that had both ovaries removed (%)
Reproductive Health - Women that have ever taken birth control pills (%)
Reproductive Health - Women taking birth control pills (%)
Reproductive Health - Women that have ever used Depo-Provera or injectables (%)
Reproductive Health - Women that have ever used female hormones (%)
Sexual Behavior - People 18+ that ever had sex (vaginal, anal, or oral) (%)
Sexual Behavior - Males 18+ that ever had vaginal sex with a woman (%)
Sexual Behavior - Males 18+ that ever performed oral sex on a woman (%)
Sexual Behavior - Males 18+ that ever had anal sex with a woman (%)
Sexual Behavior - Males 18+ that ever had any sex with a man (%)
Sexual Behavior - Females 18+ that ever had vaginal sex with a man (%)
Sexual Behavior - Females 18+ that ever performed oral sex on a man (%)
Sexual Behavior - Females 18+ that ever had anal sex with a man (%)
Sexual Behavior - Females 18+ that ever had any kind of sex with a woman (%)
Sexual Behavior - Average age people first had sex
Sexual Behavior - Average number of female sex partners in lifetime (males 18+)
Sexual Behavior - Average number of female vaginal sex partners in lifetime (males 18+)
Sexual Behavior - Average age people first performed oral sex on a woman (18+)
Sexual Behavior - Average number of woman performed oral sex on in lifetime (18+)
Sexual Behavior - Average number of male sex partners in lifetime (males 18+)
Sexual Behavior - Average number of male anal sex partners in lifetime (males 18+)
Sexual Behavior - Average age people first performed oral sex on a man (18+)
Sexual Behavior - Average number of male oral sex partners in lifetime (18+)
Sexual Behavior - People using protection when performing oral sex (%)
Sexual Behavior - Average number of times people have vaginal or anal sex a year
Sexual Behavior - People having sex without condom (%)
Sexual Behavior - Average number of male sex partners in lifetime (females 18+)
Sexual Behavior - Average number of male vaginal sex partners in lifetime (females 18+)
Sexual Behavior - Average number of female sex partners in lifetime (females 18+)
Sexual Behavior - Circumcised males 18+ (%)
Sleep Disorders - Average hours sleeping at night
Sleep Disorders - People that has trouble sleeping (%)
Smoking-Cigarette Use - People smoking cigarettes (%)
Taste & Smell - People 40+ having problems with smell (%)
Taste & Smell - People 40+ having problems with taste (%)
Taste & Smell - People 40+ that ever had wisdom teeth removed (%)
Taste & Smell - People 40+ that ever had tonsils teeth removed (%)
Taste & Smell - People 40+ that ever had a loss of consciousness because of a head injury (%)
Taste & Smell - People 40+ that ever had a broken nose or other serious injury to face or skull (%)
Taste & Smell - People 40+ that ever had two or more sinus infections (%)
Weight - Average height (inches)
Weight - Average weight (pounds)
Weight - Average BMI
Weight - People that are obese (%)
Weight - People that ever were obese (%)
Weight - People trying to lose weight (%)
According to our research of Washington and other state lists, there were 11 registered sex offenders living in Redmond, Washington as of April 26, 2024 . The ratio of all residents to sex offenders in Redmond is 5,570 to 1.The ratio of registered sex offenders to all residents in this city is much lower than the state average.
The City-Data.com crime index weighs serious crimes and violent crimes more heavily. Higher means more crime, U.S. average is 246.1. It adjusts for the number of visitors and daily workers commuting into cities.
- means the value is smaller than the state average.
- means the value is about the same as the state average.
- means the value is bigger than the state average.
- means the value is much bigger than the state average.
Crime rate in Redmond detailed stats: murders, rapes, robberies, assaults, burglaries, thefts, arson Officers per 1,000 residents here:
1.05Washington average:
1.35
Latest news from Redmond, WA collected exclusively by city-data.com from local newspapers, TV, and radio stations
Ancestries: English (4.5%), European (3.4%), German (2.8%), American (2.8%), Russian (2.3%), Ukrainian (1.4%).
Current Local Time:
Land area: 15.9 square miles.
Population density: 4,830 people per square mile (average).
33,140 residents are foreign born (31.6% Asia , 5.8% Europe ).
This city:
44.7%Washington:
14.9%
Median real estate property taxes paid for housing units with mortgages in 2022: $7,449 (0.6%)Median real estate property taxes paid for housing units with no mortgage in 2022: $7,929 (0.6%)
Nearest city with pop. 50,000+: East Seattle, WA (4.2 miles
Nearest city with pop. 1,000,000+: Los Angeles, CA
Nearest cities:
Latitude: 47.67 N, Longitude: 122.12 W
Nickname or alias (official or unofficial): Bicycle Capital of the Northwest
Daytime population change due to commuting: +41,255 (+53.8%)Workers who live and work in this city: 28,216 (64.6%)
Area code commonly used in this area: 425
Property values in Redmond, WA
Single-family new house construction building permits:
2022: 74 buildings , average cost: $348,0002021: 54 buildings , average cost: $427,5002020: 82 buildings , average cost: $409,7002019: 118 buildings , average cost: $416,6002018: 166 buildings , average cost: $419,3002017: 93 buildings , average cost: $429,6002016: 186 buildings , average cost: $406,9002015: 200 buildings , average cost: $339,1002014: 216 buildings , average cost: $399,4002013: 164 buildings , average cost: $319,1002012: 124 buildings , average cost: $313,4002011: 89 buildings , average cost: $312,9002010: 98 buildings , average cost: $315,5002009: 94 buildings , average cost: $303,7002008: 140 buildings , average cost: $302,7002007: 237 buildings , average cost: $311,2002006: 206 buildings , average cost: $309,8002005: 323 buildings , average cost: $315,9002004: 203 buildings , average cost: $315,0002003: 268 buildings , average cost: $262,2002002: 177 buildings , average cost: $207,6002001: 146 buildings , average cost: $243,3002000: 118 buildings , average cost: $256,9001999: 109 buildings , average cost: $223,4001998: 65 buildings , average cost: $210,3001997: 300 buildings , average cost: $159,300Unemployment in December 2023:
Population change in the 1990s: +7,974 (+21.4%).
Most common industries in Redmond, WA (%)
Both Males Females
Professional, scientific, technical services (14.2%)
Publishing, motion picture & sound recording industries (10.0%)
Health care (5.9%)
Educational services (5.9%)
Finance & insurance (4.5%)
Construction (4.5%)
Transportation equipment (4.1%)
Professional, scientific, technical services (16.1%)
Publishing, motion picture & sound recording industries (13.5%)
Construction (6.8%)
Transportation equipment (5.4%)
Computer & electronic products (4.6%)
Radio, TV, computer stores (4.3%)
Finance & insurance (3.5%)
Professional, scientific, technical services (11.8%)
Health care (10.3%)
Educational services (10.0%)
Finance & insurance (5.7%)
Publishing, motion picture & sound recording industries (5.6%)
Accommodation & food services (5.4%)
Administrative & support & waste management services (3.9%)
Most common occupations in Redmond, WA (%)
Both Males Females
Computer specialists (17.6%)
Other management occupations, except farmers and farm managers (6.4%)
Other sales and related occupations, including supervisors (4.0%)
Engineers (3.3%)
Retail sales workers, except cashiers (3.2%)
Sales representatives, services, wholesale and manufacturing (3.2%)
Other office and administrative support workers, including supervisors (2.7%)
Computer specialists (24.2%)
Other management occupations, except farmers and farm managers (6.8%)
Engineers (5.2%)
Other sales and related occupations, including supervisors (4.3%)
Sales representatives, services, wholesale and manufacturing (3.6%)
Operations specialties managers, except financial managers (3.5%)
Top executives (3.5%)
Computer specialists (9.2%)
Other management occupations, except farmers and farm managers (5.9%)
Secretaries and administrative assistants (5.2%)
Other office and administrative support workers, including supervisors (4.6%)
Retail sales workers, except cashiers (3.8%)
Other sales and related occupations, including supervisors (3.6%)
Registered nurses (3.5%)
Earthquake activity:
Redmond-area historical earthquake activity is significantly above Washington state average. It is 1291% greater than the overall U.S. average. On 4/13/1949 at 19:55:42, a magnitude 7.0 (7.0 UK, Class: Major, Intensity: VIII - XII) earthquake occurred 33.9 miles away from the city center, causing $80,000,000 total damage On 2/28/2001 at 18:54:32, a magnitude 6.8 (6.5 MB, 6.6 MS, 6.8 MW, Class: Strong, Intensity: VII - IX) earthquake occurred 45.4 miles away from Redmond center, causing $2,000,000,000 total damage and $305,000,000 insured lossesOn 2/28/2001 at 18:54:32, a magnitude 6.8 (6.8 MD, Depth: 32.2 mi) earthquake occurred 45.7 miles away from Redmond center On 4/29/1965 at 15:28:43, a magnitude 6.6 (6.6 UK) earthquake occurred 26.3 miles away from the city center, causing $28,000,000 total damage On 7/3/1999 at 01:43:54, a magnitude 5.8 (5.4 MB, 5.5 MS, 5.8 MW, 5.3 ME, Depth: 25.2 mi, Class: Moderate, Intensity: VI - VII) earthquake occurred 66.9 miles away from the city center On 5/3/1996 at 04:04:22, a magnitude 5.5 (5.2 MB, 5.3 MD, 5.5 ML, Depth: 2.5 mi) earthquake occurred 21.0 miles away from Redmond center Magnitude types: body-wave magnitude (MB), duration magnitude (MD), energy magnitude (ME), local magnitude (ML), surface-wave magnitude (MS), moment magnitude (MW) Natural disasters: The number of natural disasters in King County (30) is a lot greater than the US average (15).Major Disasters (Presidential) Declared: 27Emergencies Declared: 1Floods: 21, Storms: 16, Mudslides: 11, Landslides: 9, Winter Storms: 7, Earthquakes: 2, Heavy Rains: 2, Winds: 2, Hurricane: 1, Snow: 1, Volcanic Eruption: 1, Other: 1 (Note: some incidents may be assigned to more than one category). Main business address for: CONCUR TECHNOLOGIES INC SERVICES-PREPACKAGED SOFTWARE ), PROCYTE CORP /WA/ PHARMACEUTICAL PREPARATIONS ), MICROSOFT CORP SERVICES-PREPACKAGED SOFTWARE ), AT&T WIRELESS SERVICES INC RADIO TELEPHONE COMMUNICATIONS ), ADVANCED DIGITAL INFORMATION CORP COMPUTER STORAGE DEVICES ), DATA I/O CORP INSTRUMENTS FOR MEAS & TESTING OF ELECTRICITY & ELEC SIGNALS ), ALCIDE CORP AGRICULTURE CHEMICALS ).
Hospitals and medical centers in Redmond: CASCADE VISTA CONVALESCENT CEN (7900 WILLOWS ROAD NORTHEAST)
CASCADE VISTA CONVALESCENT CENTER (7900 REDMOND-KIRKLAND HIGHWAY)
CORWIN CENTER AT EMERALD HEIGHTS (10901 - 176TH CIRCLE NORTHEAST)
PINEVILLA GUEST HOME (8705 166TH AVE NE)
Amtrak stations near Redmond: 11 miles: SEATTLE (303 S. JACKSON ST.) Services: ticket office, fully wheelchair accessible, enclosed waiting area, public restrooms, public payphones, vending machines, paid short-term parking, paid long-term parking, call for car rental service, taxi stand, intercity bus service, public transit connection.
15 miles: MONROE (RED BARN UNOCAL) - Bus Station 16 miles: EDMONDS (211 RAILROAD AVE.) Services: ticket office, fully wheelchair accessible, enclosed waiting area, public restrooms, public payphones, vending machines, paid short-term parking, paid long-term parking, call for taxi service, public transit connection.
College/University in Redmond: DigiPen Institute of Technology Full-time enrollment: 1,169; Location: 9931 Willows Rd NE; Private, for-profit; Website: www.digipen.edu; Offers Master's degree )
Colleges/universities with over 2000 students nearest to Redmond:
Lake Washington Institute of Technology (about 4 miles; Kirkland, WA ; Full-time enrollment: 2,947)
Bellevue College (about 6 miles; Bellevue, WA ; FT enrollment: 10,940)
Cascadia Community College (about 8 miles; Bothell, WA ; FT enrollment: 2,238)
University of Washington-Bothell Campus (about 8 miles; Bothell, WA ; FT enrollment: 3,902)
University of Washington-Seattle Campus (about 9 miles; Seattle, WA ; FT enrollment: 39,445)
Seattle Central College (about 10 miles; Seattle, WA ; FT enrollment: 5,825)
Seattle University (about 11 miles; Seattle, WA ; FT enrollment: 5,808)
Public high schools in Redmond:
Private high schools in Redmond: THE BEAR CREEK SCHOOL Students: 762, Location: 8905 208TH AVE NE, Grades: PK-12)
THE OVERLAKE SCHOOL Students: 535, Location: 20301 NE 108TH ST, Grades: 5-12)
DARTMOOR SCHOOL Students: 56, Location: 7735 178TH PL NE STE A, Grades: 4-12)
Biggest public elementary/middle schools in Redmond: AUDUBON ELEMENTARY Location: 3045 180TH NE, Grades: KG-6)RUSH ELEMENTARY Location: 6101 152ND AVE NE, Grades: KG-6)DICKINSON ELEMENTARY Location: 7040 - 208TH NE, Grades: KG-6)
MANN ELEMENTARY Location: 17001 NE 104TH, Grades: KG-6)REDMOND ELEMENTARY Location: 16800 NE 80TH, Grades: KG-6)ROCKWELL ELEMENTARY Location: 11125 - 162ND AVE NE, Grades: KG-6)ALCOTT ELEMENTARY Location: 4213 - 228TH AVE NE, Grades: KG-6)
EXPLORER COMMUNITY SCHOOL Location: 7040 208TH NE, Grades: 1-6)EINSTEIN ELEMENTARY Location: 18025 NE 116TH, Grades: KG-6)STELLA SCHOLA Location: 13505 NE 75TH STREET, Grades: 6-8)Private elementary/middle schools in Redmond: THE SAMMAMISH MONTESSORI SCHOOL Students: 334, Location: 7655 178TH PL NE, Grades: PK-4)
MEDINA ACADEMY Students: 172, Location: 16600 NE 80TH ST, Grades: PK-6)
FAITH LUTHERAN SCHOOL Students: 137, Location: 9041 166TH AVE NE, Grades: PK-4)
MONTESSORI CHILDREN'S HOUSE Students: 123, Location: 5003 218TH AVE NE, Grades: PK-5)
CASCADIA MONTESSORI SCHOOL Students: 71, Location: 4239 162ND AVE NE, Grades: KG-4)
SPECTRUM ACADEMY Students: 51, Location: 2576 152ND AVE NE APT B112, Grades: PK-1)
See full list of schools located in Redmond User-submitted facts and corrections:
Sammamish Montessori School PK - 3
KING-TV is now owned by Belo Corp., as well as it's daughter station, KONG-TV. KIRO-TV is now under the ownership of Cox Broadcasting Group. added by Jeff
Notable locations in Redmond: (A) , Lake Hills Sewage Disposal Treatment Plant (B) , Overlake Transit Center (C) , Redmond Town Center (D) , Redmond Park and Ride (E) , Overlake Industrial Park (F) , Brae Burn Golf Course (G) , Willows Run Golf Club (H) , Redmond Shopping Square (I) , Redmond Center (J) , Overlake Fashion Plaza (K) , Cleveland Street Square (L) , Bear Creek Village (M) , Sammamish Landing at 520 (N) , Kenilworth (O) , Willows Run Golf Course (P) , Pro Transport 1 (Q) , The Marymoor Retirement and Assisted Living Facility (R) , Regency at Peters Creek (S) , Overlake Terrace Assisted Living Facility (T) . Display/hide their locations on the map
Shopping Centers: (1) , Overlake Shopping Center (2) . Display/hide their locations on the map
Main business address in Redmond include: (A) , PROCYTE CORP /WA/ (B) , MICROSOFT CORP (C) , AT&T WIRELESS SERVICES INC (D) , ADVANCED DIGITAL INFORMATION CORP (E) , DATA I/O CORP (F) , ALCIDE CORP (G) . Display/hide their locations on the map
Churches in Redmond include: (A) , The Church of Jesus Christ of Latter Day Saints (B) , Overlake Christian Church (C) , First Church of Christ Scientist (D) , Evangelical Chinese Church (E) , Faith Lutheran Church (F) , First Baptist Church of Redmond (G) , First Baptist Church of Rose Hill (H) , Redwood Family Church (I) . Display/hide their locations on the map
Cemetery: (1) . Display/hide its location on the map
Reservoir: (A) . Display/hide its location on the map
Creeks: (A) , Evans Creek (B) , Perrigo Creek (C) , Peters Creek (D) , Willows Creek (E) . Display/hide their locations on the map
Parks in Redmond include: (1) , Arthur Johnson Park (2) , Willows Creek Neighborhood Park (3) , Jonathan Hartman Park (4) , Farrel McWhirter Park (5) , Westside Park (6) , Idylwood Park (7) , Sportsman Park (8) . Display/hide their locations on the map
Tourist attractions: (1) , Big League Connection (Amusement & Theme Parks; 15015 Northeast 90th Street) (2) , Datascore (Arcades & Amusements; 16541 Redmond Way Pmb 445-C) (3) , Game Cabinets Inc. - Classic Arcade Game Machines (Arcades & Amusements; 18080 NE 68th ST. Suite E100) (4) , Hill Barrett Travel (Recreational Trips & Guides; 16071 Northeast 85th Street) (5) . Display/hide their approximate locations on the map
Hotel: (1) . Display/hide its approximate location on the map
Birthplace of: Blake Lewis - Idol participant, Karan Brar - Actor, Nick Downing - Soccer player, Andrew James Allen - Actor, Aubrey Rinehart - Female model, Earl Johnson (baseball) - Baseball player, John Fishbaugher - Soccer player, Amy Tryon - Olympic medalist in equestrian, Brian Morrison - College basketball player (UCLA Bruins), Chad Orvella - Baseball player.
King County has a predicted average indoor radon screening level less than 2 pCi/L (pico curies per liter) - Low Potential Drinking water stations with addresses in Redmond and their reported violations in the past:
M & M S QUICKSTOP GROCERY & DELI (Population served: 30, Groundwater):
Past monitoring violations:
2 routine major monitoring violations
Average household size: This city:
2.4 peopleWashington:
2.5 people
Percentage of family households: This city:
61.6%Whole state:
64.4%
Percentage of households with unmarried partners: This city:
5.7%Whole state:
7.7%
Likely homosexual households (counted as self-reported same-sex unmarried-partner households)
Lesbian couples: 0.3% of all households Gay men: 0.3% of all households
People in group quarters in Redmond in 2010:
171 people in nursing facilities/skilled-nursing facilities
43 people in group homes intended for adults
31 people in emergency and transitional shelters (with sleeping facilities) for people experiencing homelessness
22 people in workers' group living quarters and job corps centers
4 people in other noninstitutional facilities
3 people in residential treatment centers for adults
People in group quarters in Redmond in 2000:
290 people in other noninstitutional group quarters
251 people in nursing homes
188 people in other group homes
96 people in wards in general hospitals for patients who have no usual home elsewhere
8 people in homes for the mentally retarded
Banks with most branches in Redmond (2011 data):
Bank of America, National Association: Redmond Branch, North Redmond Branch, Overlake Park Branch, Redmond Ridge Branch. Info updated 2009/11/18: Bank assets: $1,451,969.3 mil, Deposits: $1,077,176.8 mil, headquarters in Charlotte, NC, positive income , 5782 total offices , Holding Company: Bank Of America Corporation
JPMorgan Chase Bank, National Association: Avondale Branch, Redmond Branch, Sammamish Highlands. Info updated 2011/11/10: Bank assets: $1,811,678.0 mil, Deposits: $1,190,738.0 mil, headquarters in Columbus, OH, positive income , International Specialization, 5577 total offices , Holding Company: Jpmorgan Chase & Co.
Wells Fargo Bank, National Association: Redmond Branch at 8502 160th Avenue, Northeast, branch established on 1994/05/26; Redmond Ridge Branch at 23467 Ne Novelty Hill Rd, branch established on 2006/11/28. Info updated 2011/04/05: Bank assets: $1,161,490.0 mil, Deposits: $905,653.0 mil, headquarters in Sioux Falls, SD, positive income , 6395 total offices , Holding Company: Wells Fargo & Company
First-Citizens Bank & Trust Company: Messenger Service Branch at 15801 Ne 85th Street, branch established on 1998/06/22; Redmond National Bank/Branch at 15801 N.E. 85th Street, branch established on 1988/10/25. Info updated 2011/10/11: Bank assets: $20,566.4 mil, Deposits: $17,596.8 mil, headquarters in Raleigh, NC, positive income , Commercial Lending Specialization, 433 total offices , Holding Company: First Citizens Bancshares, Inc.
U.S. Bank National Association: Overlake Safeway Branch at 15000 Northeast 24th Street, branch established on 1994/06/03; Bear Creek Branch at 17020 Redmond Way, branch established on 1977/05/02. Info updated 2012/01/30: Bank assets: $330,470.8 mil, Deposits: $236,091.5 mil, headquarters in Cincinnati, OH, positive income , 3121 total offices , Holding Company: U.S. Bancorp
KeyBank National Association: Overlake Park Branch at 15110 N.E. Twenty-Fourth, branch established on 1979/03/05; Redmond Branch at 16401 Redmond Way, branch established on 1980/08/25. Info updated 2008/03/03: Bank assets: $86,198.8 mil, Deposits: $64,214.8 mil, headquarters in Cleveland, OH, positive income , Commercial Lending Specialization, 1067 total offices , Holding Company: Keycorp
Union Bank, National Association: Redmond Branch at 17000 Avondale Way, branch established on 1997/04/14. Info updated 2011/09/01: Bank assets: $88,967.5 mil, Deposits: $65,286.4 mil, headquarters in San Francisco, CA, positive income , Commercial Lending Specialization, 403 total offices , Holding Company: Mitsubishi Ufj Financial Group, Inc.
Columbia State Bank: Redmond Branch at 8201 - 164 Avenue N.E., Suite 105, branch established on 2002/02/07. Info updated 2011/08/09: Bank assets: $4,785.2 mil, Deposits: $3,892.8 mil, headquarters in Tacoma, WA, positive income , Commercial Lending Specialization, 104 total offices , Holding Company: Columbia Banking System, Inc.
Banner Bank: Redmond Branch at 7950 164th Avenue Ne, branch established on 1996/04/01. Info updated 2011/05/03: Bank assets: $4,048.2 mil, Deposits: $3,348.4 mil, headquarters in Walla Walla, WA, positive income , Commercial Lending Specialization, 87 total offices , Holding Company: Banner Corporation
6 other banks with 6 local branches
For population 15 years and over in Redmond:
Never married: 38.9%Now married: 51.2%Separated: 0.0%Widowed: 3.9%Divorced: 6.0% For population 25 years and over in Redmond:
High school or higher: 98.2%Bachelor's degree or higher: 71.3%Graduate or professional degree: 37.2%Unemployed: 3.9%Mean travel time to work (commute): 12.9 minutes
Education Gini index (Inequality in education) Here:
8.1Washington average:
11.6
Religion statistics for Redmond, WA (based on King County data)
Religion Adherents Congregations Catholic 278,340 71 Evangelical Protestant 204,523 711 Other 119,713 329 Mainline Protestant 104,806 304 Orthodox 12,257 20 Black Protestant 7,030 24 None 1,204,580 -
Source: Clifford Grammich, Kirk Hadaway, Richard Houseal, Dale E.Jones, Alexei Krindatch, Richie Stanley and Richard H.Taylor. 2012. 2010 U.S.Religion Census: Religious Congregations & Membership Study. Association of Statisticians of American Religious Bodies. Jones, Dale E., et al. 2002. Congregations and Membership in the United States 2000. Nashville, TN: Glenmary Research Center. Graphs represent county-level data
Food Environment Statistics: Number of grocery stores : 439King County :
2.37 / 10,000 pop.Washington :
2.06 / 10,000 pop.
Number of supercenters and club stores : 29King County :
0.16 / 10,000 pop.State :
0.19 / 10,000 pop.
Number of convenience stores (no gas) : 220This county :
1.19 / 10,000 pop.Washington :
1.18 / 10,000 pop.
Number of convenience stores (with gas) : 399Here :
2.16 / 10,000 pop.Washington :
2.67 / 10,000 pop.
Number of full-service restaurants : 2,027King County :
10.95 / 10,000 pop.Washington :
8.26 / 10,000 pop.
Adult diabetes rate : King County :
6.7%Washington :
7.7%
Adult obesity rate : King County :
20.5%Washington :
25.7%
Low-income preschool obesity rate : Here :
14.6%Washington :
13.9%
Health and Nutrition: Healthy diet rate : Redmond:
55.1%Washington:
49.9%
Average overall health of teeth and gums : Redmond:
55.3%Washington:
47.2%
Average BMI : This city:
27.4Washington:
28.4
People feeling badly about themselves : Here:
17.8%Washington:
20.9%
People not drinking alcohol at all : This city:
9.6%Washington:
10.5%
Average hours sleeping at night : This city:
6.9Washington:
6.8
Overweight people : Here:
30.0%Washington:
32.8%
General health condition : Average condition of hearing : Redmond:
83.0%Washington:
79.4%
More about Health and Nutrition of Redmond, WA Residents
Local government employment and payroll (March 2022)
Function
Full-time employees
Monthly full-time payroll
Average yearly full-time wage
Part-time employees
Monthly part-time payroll
Firefighters
152 $2,025,974 $159,945 0 $0 Other Government Administration
111 $924,426 $99,938 12 $35,000 Police Protection - Officers
84 $878,597 $125,514 0 $0 Parks and Recreation
68 $540,722 $95,422 37 $31,758 Financial Administration
65 $645,520 $119,173 1 $718 Streets and Highways
53 $583,380 $132,086 3 $11,036 Sewerage
39 $318,564 $98,020 0 $0 Police - Other
28 $224,592 $96,254 2 $7,280 Other and Unallocable
17 $141,976 $100,218 2 $1,723 Solid Waste Management
14 $104,806 $89,834 0 $0 Fire - Other
9 $69,922 $93,229 0 $0 Transit
8 $83,544 $125,316 0 $0 Judicial and Legal
1 $9,806 $117,672 2 $9,316
Totals for Government
649 $6,551,829 $121,143 59 $96,831
Redmond government finances - Expenditure in 2021 (per resident):
Construction - Regular Highways: $8,036,000 ($104.73)
Parks and Recreation: $4,777,000 ($62.26)Local Fire Protection: $1,157,000 ($15.08)Sewerage: $977,000 ($12.73)Police Protection: $624,000 ($8.13)General - Other: $101,000 ($1.32)Financial Administration: $3,000 ($0.04)Current Operations - Sewerage: $28,198,000 ($367.49)
Local Fire Protection: $26,639,000 ($347.17)Regular Highways: $21,618,000 ($281.73)Police Protection: $17,560,000 ($228.85)General - Other: $16,854,000 ($219.65)Water Utilities: $16,544,000 ($215.61)Health - Other: $9,184,000 ($119.69)Parks and Recreation: $8,553,000 ($111.47)Housing and Community Development: $8,228,000 ($107.23)Financial Administration: $5,855,000 ($76.30)Central Staff Services: $5,697,000 ($74.25)Protective Inspection and Regulation - Other: $3,865,000 ($50.37)Natural Resources - Other: $2,282,000 ($29.74)Judicial and Legal Services: $1,173,000 ($15.29)Solid Waste Management: $338,000 ($4.40)General Public Buildings: $282,000 ($3.68)General - Interest on Debt: $2,727,000 ($35.54)
Intergovernmental to Local - Other - General - Other: $2,548,000 ($33.21)
Other - Correctional Institutions: $681,000 ($8.88)Other Capital Outlay - Sewerage: $7,202,000 ($93.86)
Water Utilities: $2,964,000 ($38.63)Local Fire Protection: $336,000 ($4.38)Parks and Recreation: $226,000 ($2.95)Police Protection: $163,000 ($2.12)General - Other: $61,000 ($0.79)Regular Highways: $44,000 ($0.57)Total Salaries and Wages: $73,924,000 ($963.41)
Redmond government finances - Revenue in 2021 (per resident):
Charges - Sewerage: $37,168,000 ($484.39)
Other: $23,045,000 ($300.33)Regular Highways: $618,000 ($8.05)Parks and Recreation: $366,000 ($4.77)Federal Intergovernmental - Other: $11,000 ($0.14)
Local Intergovernmental - Other: $636,000 ($8.29)
Miscellaneous - Interest Earnings: $5,037,000 ($65.64)
Donations From Private Sources: $4,239,000 ($55.24)Rents: $4,135,000 ($53.89)Special Assessments: $2,155,000 ($28.08)Sale of Property: $1,973,000 ($25.71)General Revenue - Other: $1,219,000 ($15.89)Fines and Forfeits: $415,000 ($5.41)Revenue - Water Utilities: $20,048,000 ($261.27)
State Intergovernmental - Highways: $10,588,000 ($137.99)
Other: $4,028,000 ($52.49)Health and Hospitals: $3,168,000 ($41.29)General Local Government Support: $1,048,000 ($13.66)Housing and Community Development: $75,000 ($0.98)Tax - General Sales and Gross Receipts: $42,739,000 ($556.99)
Property: $28,225,000 ($367.84)Other License: $21,934,000 ($285.85)Public Utilities Sales: $10,271,000 ($133.86)Occupation and Business License - Other: $9,968,000 ($129.91)Documentary and Stock Transfer: $6,691,000 ($87.20)Amusements Sales: $310,000 ($4.04)
Redmond government finances - Debt in 2021 (per resident):
Long Term Debt - Beginning Outstanding - Unspecified Public Purpose: $110,093,000 ($1434.77)
Outstanding Unspecified Public Purpose: $108,349,000 ($1412.04)Retired Unspecified Public Purpose: $11,036,000 ($143.83)Issue, Unspecified Public Purpose: $9,292,000 ($121.10)
6.69% of this county's 2021 resident taxpayers lived in other counties in 2020 ($106,002 average adjusted gross income )
Here:
6.69%Washington average:
7.53%
0.02% of residents moved from foreign countries ($181 average AGI )King County:
0.02%Washington average:
0.05%
Top counties from which taxpayers relocated into this county between 2020 and 2021:
7.71% of this county's 2020 resident taxpayers moved to other counties in 2021 ($123,052 average adjusted gross income )
Here:
7.71%Washington average:
7.40%
0.01% of residents moved to foreign countries ($183 average AGI )King County:
0.01%Washington average:
0.04%
Top counties to which taxpayers relocated from this county between 2020 and 2021:
Businesses in Redmond, WA
Name Count Name Count
7-Eleven 3 Marriott 2 AT&T 5 Marshalls 1 Aeropostale 1 McDonald's 2 Albertsons 1 Men's Wearhouse 1 American Eagle Outfitters 1 Motherhood Maternity 1 Ann Taylor 1 New Balance 1 Arby's 1 Nike 8 Avenue 1 Office Depot 1 Baja Fresh Mexican Grill 1 Pac Sun 1 Baskin-Robbins 1 Panda Express 1 Bath & Body Works 1 Panera Bread 1 Bed Bath & Beyond 1 Papa John's Pizza 1 Blockbuster 2 Payless 2 Chico's 1 Penske 1 Chipotle 1 Pier 1 Imports 1 Cold Stone Creamery 1 Pizza Hut 2 Curves 1 Qdoba Mexican Grill 2 DHL 4 Quiznos 3 Dairy Queen 1 RadioShack 1 Domino's Pizza 1 Red Robin 2 Eddie Bauer 1 Rite Aid 2 Ethan Allen 1 Safeway 2 FedEx 10 Sears 2 Firestone Complete Auto Care 1 Soma Intimates 1 GameStop 2 Sprint Nextel 2 Gap 1 Staples 1 Gymboree 1 Starbucks 16 H&R Block 3 Subway 8 Home Depot 1 T-Mobile 4 Hyatt 1 Taco Bell 1 Jack In The Box 1 Target 1 Jamba Juice 1 Trader Joe's 1 Jimmy John's 1 U-Haul 3 Jones New York 2 UPS 15 KFC 1 Vans 2 Kohl's 1 Verizon Wireless 1 Kroger 5 Victoria's Secret 1 Lane Bryant 1 Vons 2 Lane Furniture 1 Wendy's 2 LensCrafters 2 Whole Foods Market 1 Macy's 2 Z Gallerie 1
Strongest AM radio stations in Redmond:
KIXI (880 AM; 50 kW; MERCER ISLAND/SEATTL, WA; Owner: BELLEVUE RADIO, INC.)
KARR (1460 AM; 5 kW; KIRKLAND, WA; Owner: FAMILY STATIONS, INC.)
KKNW (1150 AM; 10 kW; SEATTLE, WA; Owner: ORCA RADIO, INC.)
KRKO (1380 AM; 50 kW; EVERETT, WA; Owner: S-R BROADCASTING, CO.)
KIRO (710 AM; 50 kW; SEATTLE, WA; Owner: ENTERCOM SEATTLE LICENSE, LLC)
KOMO (1000 AM; 50 kW; SEATTLE, WA; Owner: FISHER BROADCASTING - SEATTLE RADIO, L.L.C.)
KKOL (1300 AM; 50 kW; SEATTLE, WA; Owner: INSPIRATION MEDIA, INC.)
KGNW (820 AM; 50 kW; BURIEN-SEATTLE, WA; Owner: INSPIRATION MEDIA, INC.)
KTTH (770 AM; 50 kW; SEATTLE, WA; Owner: ENTERCOM SEATTLE LICENSE, LLC)
KXPA (1540 AM; 5 kW; BELLEVUE, WA; Owner: MULTICULTURAL RADIO BROADCASTING, INC.)
KYCW (1090 AM; 50 kW; SEATTLE, WA; Owner: INFINITY RADIO SUBSIDIARY OPERATIONS INC.)
KJR (950 AM; 50 kW; SEATTLE, WA)
KCIS (630 AM; 5 kW; EDMONDS, WA; Owner: CRISTA MINISTRIES)
Strongest FM radio stations in Redmond:
KMTT (103.7 FM; TACOMA, WA; Owner: ENTERCOM SEATTLE LICENSE, LLC)
KNDD (107.7 FM; SEATTLE, WA; Owner: ENTERCOM SEATTLE LICENSE, LLC)
KYPT (96.5 FM; SEATTLE, WA; Owner: INFINITY RADIO SUBSIDIARY OPERATIONS INC.)
KISW (99.9 FM; SEATTLE, WA; Owner: ENTERCOM SEATTLE LICENSE, LLC)
KQBZ (100.7 FM; SEATTLE, WA; Owner: ENTERCOM SEATTLE LICENSE, LLC)
KBSG-FM (97.3 FM; TACOMA, WA; Owner: ENTERCOM SEATTLE LICENSE, LLC)
KBKS (106.1 FM; TACOMA, WA; Owner: INFINITY RADIO SUBSIDIARY OPERATIONS INC.)
KING-FM (98.1 FM; SEATTLE, WA; Owner: CLASSIC RADIO, INC.)
KLSY-FM (92.5 FM; BELLEVUE, WA; Owner: BELLEVUE RADIO INC.)
KPLU-FM (88.5 FM; TACOMA, WA; Owner: PACIFIC LUTHERAN UNIVERSITY, INC.)
KWJZ (98.9 FM; SEATTLE, WA; Owner: ORCA RADIO, INC.)
KZOK-FM (102.5 FM; SEATTLE, WA; Owner: INFINITY RADIO SUBSIDIARY OPERATIONS INC.)
KMPS-FM (94.1 FM; SEATTLE, WA; Owner: INFINITY RADIO SUBSIDIARY OPERATIONS INC.)
KJR-FM (95.7 FM; SEATTLE, WA; Owner: ACKERLEY MEDIA GROUP, INC.)
KUBE (93.3 FM; SEATTLE, WA; Owner: ACKERLEY MEDIA GROUP, INC.)
KPLZ-FM (101.5 FM; SEATTLE, WA; Owner: FISHER BROADCASTING - SEATTLE RADIO, L.L.C.)
KNHC (89.5 FM; SEATTLE, WA; Owner: SEATTLE PUBLIC SCHOOLS)
KRWM (106.9 FM; BREMERTON, WA; Owner: SEASCAPE RADIO, INC.)
KCMS (105.3 FM; EDMONDS, WA; Owner: CRISTA MINISTRIES, INC.)
KUOW (94.9 FM; SEATTLE, WA; Owner: THE UNIVERSITY OF WASHINGTON)
TV broadcast stations around Redmond:
KSTW (Channel 11; TACOMA, WA; Owner: UPN TELEVISION STATIONS INC.)
KING-TV (Channel 5; SEATTLE, WA; Owner: KING BROADCASTING COMPANY)
KTWB-TV (Channel 22; SEATTLE, WA; Owner: TRIBUNE TELEVISION HOLDINGS, INC.)
K58DP (Channel 58; SEATTLE, WA; Owner: WORD OF GOD FELLOWSHIP, INC.)
KCTS-TV (Channel 9; SEATTLE, WA; Owner: KCTS TELEVISION)
KOMO-TV (Channel 4; SEATTLE, WA; Owner: FISHER BROADCASTING - SEATTLE TV, L.L.C.)
KIRO-TV (Channel 7; SEATTLE, WA; Owner: KIRO-TV HOLDINGS, INC.)
KHCV (Channel 45; SEATTLE, WA; Owner: NORTH PACIFIC INTERNATIONAL TELEVISION, INC.)
KWPX (Channel 33; BELLEVUE, WA; Owner: PAXSON COMMUNICATIONS LICENSE COMPANY, LLC)
K57HB (Channel 57; EUREKA, CA; Owner: MS COMMUNICATIONS, LLC)
K68DL (Channel 68; SEATTLE, WA; Owner: THREE ANGELS BROADCASTING NETWORK)
KONG-TV (Channel 16; EVERETT, WA; Owner: KONG-TV, INC.)
KWDK (Channel 56; TACOMA, WA; Owner: PUGET SOUND EDUCATIONAL TV, INC.)
KWOG (Channel 51; BELLEVUE, WA; Owner: AFRICAN-AMERICAN BROADCASTING CO.OF BELLEVUE, INC.)
KCPQ (Channel 13; TACOMA, WA; Owner: TRIBUNE TELEVISION NORTHWEST, INC.)
National Bridge Inventory (NBI) Statistics 37 Number of bridges571ft / 174m Total length $154,432,000 Total costs1,129,218 Total average daily traffic46,939 Total average daily truck traffic
New bridges - historical statistics
2 1960-1969 7 1970-1979 8 1980-1989 9 1990-1999 6 2000-2009 3 2010-2019 2 2020-2022
See full National Bridge Inventory statistics for Redmond, WA
Home Mortgage Disclosure Act Aggregated Statistics For Year 2009(Based on 7 full and 6 partial tracts) A) FHA, FSA/RHS & VA B) Conventional C) Refinancings D) Home Improvement Loans E) Loans on Dwellings For 5+ Families F) Non-occupant Loans on G) Loans On Manufactured Number Average Value Number Average Value Number Average Value Number Average Value Number Average Value Number Average Value Number Average Value
LOANS ORIGINATED 146 $332,299 437 $352,700 2,251 $309,252 46 $233,511 7 $7,521,324 92 $262,119 2 $147,370 APPLICATIONS APPROVED, NOT ACCEPTED 3 $213,873 35 $406,795 232 $311,777 8 $67,032 0 $0 15 $204,761 0 $0 APPLICATIONS DENIED 18 $288,373 40 $292,741 423 $339,508 11 $208,346 0 $0 48 $285,557 1 $133,160 APPLICATIONS WITHDRAWN 23 $313,351 40 $319,014 367 $316,301 7 $135,649 0 $0 28 $200,765 0 $0 FILES CLOSED FOR INCOMPLETENESS 1 $422,000 10 $320,456 66 $348,092 2 $99,255 0 $0 4 $277,000 0 $0
Aggregated Statistics For Year 2008(Based on 7 full and 6 partial tracts) A) FHA, FSA/RHS & VA B) Conventional C) Refinancings D) Home Improvement Loans E) Loans on Dwellings For 5+ Families F) Non-occupant Loans on G) Loans On Manufactured Number Average Value Number Average Value Number Average Value Number Average Value Number Average Value Number Average Value Number Average Value
LOANS ORIGINATED 61 $334,191 572 $346,007 952 $307,216 62 $159,008 8 $4,978,912 109 $242,165 2 $45,710 APPLICATIONS APPROVED, NOT ACCEPTED 4 $348,350 99 $374,713 174 $325,709 8 $128,011 0 $0 18 $240,111 5 $58,432 APPLICATIONS DENIED 11 $321,229 88 $326,017 272 $362,575 37 $116,974 1 $9,839,400 28 $245,262 6 $49,900 APPLICATIONS WITHDRAWN 8 $315,270 74 $344,861 193 $349,888 20 $170,315 0 $0 25 $263,679 0 $0 FILES CLOSED FOR INCOMPLETENESS 1 $344,540 11 $381,319 46 $329,206 7 $217,526 0 $0 4 $206,020 0 $0
Aggregated Statistics For Year 2007(Based on 7 full and 6 partial tracts) A) FHA, FSA/RHS & VA B) Conventional C) Refinancings D) Home Improvement Loans E) Loans on Dwellings For 5+ Families F) Non-occupant Loans on G) Loans On Manufactured Number Average Value Number Average Value Number Average Value Number Average Value Number Average Value Number Average Value Number Average Value
LOANS ORIGINATED 4 $198,098 1,264 $311,565 1,024 $302,809 97 $170,273 5 $2,856,600 205 $255,811 2 $143,155 APPLICATIONS APPROVED, NOT ACCEPTED 0 $0 243 $313,565 147 $289,440 18 $169,432 0 $0 36 $248,568 1 $564,000 APPLICATIONS DENIED 4 $228,140 199 $300,983 314 $334,841 45 $145,728 1 $650,000 64 $300,986 11 $51,121 APPLICATIONS WITHDRAWN 1 $216,000 111 $323,460 185 $305,900 24 $168,987 0 $0 30 $245,939 0 $0 FILES CLOSED FOR INCOMPLETENESS 0 $0 31 $357,683 52 $306,894 4 $192,585 0 $0 6 $354,158 0 $0
Aggregated Statistics For Year 2006(Based on 7 full and 6 partial tracts) A) FHA, FSA/RHS & VA B) Conventional C) Refinancings D) Home Improvement Loans E) Loans on Dwellings For 5+ Families F) Non-occupant Loans on G) Loans On Manufactured Number Average Value Number Average Value Number Average Value Number Average Value Number Average Value Number Average Value Number Average Value
LOANS ORIGINATED 5 $246,456 1,415 $287,175 983 $267,417 109 $171,524 3 $5,980,410 216 $223,656 2 $103,015 APPLICATIONS APPROVED, NOT ACCEPTED 0 $0 180 $245,107 153 $254,612 18 $251,958 0 $0 25 $202,206 1 $44,760 APPLICATIONS DENIED 2 $300,500 204 $259,707 304 $285,834 56 $156,343 0 $0 48 $257,116 4 $136,238 APPLICATIONS WITHDRAWN 1 $178,940 141 $248,062 226 $270,100 26 $152,042 0 $0 28 $289,374 1 $330,240 FILES CLOSED FOR INCOMPLETENESS 2 $255,675 32 $261,864 40 $291,432 4 $301,120 0 $0 5 $205,784 0 $0
Aggregated Statistics For Year 2005(Based on 7 full and 6 partial tracts) A) FHA, FSA/RHS & VA B) Conventional C) Refinancings D) Home Improvement Loans E) Loans on Dwellings For 5+ Families F) Non-occupant Loans on G) Loans On Manufactured Number Average Value Number Average Value Number Average Value Number Average Value Number Average Value Number Average Value Number Average Value
LOANS ORIGINATED 6 $184,788 1,379 $261,110 1,193 $250,613 107 $159,032 5 $2,857,960 216 $210,562 1 $118,330 APPLICATIONS APPROVED, NOT ACCEPTED 0 $0 166 $252,229 157 $231,027 16 $159,618 0 $0 26 $180,892 2 $94,980 APPLICATIONS DENIED 1 $219,250 190 $205,674 367 $230,484 40 $123,044 0 $0 44 $157,656 2 $44,965 APPLICATIONS WITHDRAWN 2 $168,385 167 $230,071 251 $249,655 30 $242,887 0 $0 44 $180,821 2 $135,000 FILES CLOSED FOR INCOMPLETENESS 0 $0 30 $233,063 134 $292,949 6 $110,092 0 $0 7 $280,560 0 $0
Aggregated Statistics For Year 2004(Based on 7 full and 6 partial tracts) A) FHA, FSA/RHS & VA B) Conventional C) Refinancings D) Home Improvement Loans E) Loans on Dwellings For 5+ Families F) Non-occupant Loans on G) Loans On Manufactured Number Average Value Number Average Value Number Average Value Number Average Value Number Average Value Number Average Value Number Average Value
LOANS ORIGINATED 26 $181,228 1,248 $239,003 1,361 $234,283 79 $121,651 5 $1,001,702 167 $197,205 6 $80,922 APPLICATIONS APPROVED, NOT ACCEPTED 0 $0 153 $223,769 175 $227,536 12 $129,670 0 $0 23 $166,325 3 $140,397 APPLICATIONS DENIED 8 $164,851 148 $209,269 381 $234,114 49 $120,477 1 $3,157,160 44 $190,533 2 $47,165 APPLICATIONS WITHDRAWN 4 $192,705 120 $225,597 273 $228,504 18 $116,841 0 $0 28 $178,307 0 $0 FILES CLOSED FOR INCOMPLETENESS 0 $0 28 $220,202 140 $243,863 8 $126,852 0 $0 7 $162,804 0 $0
Aggregated Statistics For Year 2003(Based on 7 full and 6 partial tracts) A) FHA, FSA/RHS & VA B) Conventional C) Refinancings D) Home Improvement Loans E) Loans on Dwellings For 5+ Families F) Non-occupant Loans on Number Average Value Number Average Value Number Average Value Number Average Value Number Average Value Number Average Value
LOANS ORIGINATED 47 $174,141 1,316 $210,152 4,001 $204,090 64 $91,160 2 $17,025,125 243 $148,313 APPLICATIONS APPROVED, NOT ACCEPTED 2 $98,150 137 $193,241 382 $206,475 19 $52,482 0 $0 30 $177,485 APPLICATIONS DENIED 7 $177,210 144 $183,734 542 $206,826 30 $68,489 1 $855,000 47 $166,091 APPLICATIONS WITHDRAWN 3 $205,273 112 $201,371 368 $211,749 11 $92,654 0 $0 32 $199,938 FILES CLOSED FOR INCOMPLETENESS 2 $189,745 14 $214,170 87 $209,154 4 $74,785 0 $0 5 $83,000
Aggregated Statistics For Year 2002(Based on 3 full tracts) A) FHA, FSA/RHS & VA B) Conventional C) Refinancings D) Home Improvement Loans E) Loans on Dwellings For 5+ Families F) Non-occupant Loans on Number Average Value Number Average Value Number Average Value Number Average Value Number Average Value Number Average Value
LOANS ORIGINATED 16 $168,854 345 $205,362 706 $198,144 6 $70,978 2 $280,500 40 $159,134 APPLICATIONS APPROVED, NOT ACCEPTED 1 $216,720 32 $204,032 73 $221,825 5 $39,200 0 $0 5 $168,638 APPLICATIONS DENIED 3 $135,000 26 $176,143 102 $206,426 6 $36,000 0 $0 9 $130,111 APPLICATIONS WITHDRAWN 1 $193,000 31 $277,224 84 $214,467 2 $52,500 1 $325,000 9 $198,438 FILES CLOSED FOR INCOMPLETENESS 0 $0 10 $151,900 37 $224,057 0 $0 0 $0 1 $220,000
Aggregated Statistics For Year 2001(Based on 3 full tracts) A) FHA, FSA/RHS & VA B) Conventional C) Refinancings D) Home Improvement Loans E) Loans on Dwellings For 5+ Families F) Non-occupant Loans on Number Average Value Number Average Value Number Average Value Number Average Value Number Average Value Number Average Value
LOANS ORIGINATED 20 $148,676 279 $201,645 458 $187,266 21 $37,672 2 $822,500 20 $144,022 APPLICATIONS APPROVED, NOT ACCEPTED 1 $197,020 24 $212,697 42 $161,224 9 $51,444 0 $0 2 $134,000 APPLICATIONS DENIED 0 $0 27 $103,284 67 $181,663 13 $26,983 0 $0 5 $131,356 APPLICATIONS WITHDRAWN 3 $170,667 26 $186,097 74 $188,137 4 $21,000 0 $0 6 $112,333 FILES CLOSED FOR INCOMPLETENESS 0 $0 6 $142,615 18 $201,344 2 $69,105 0 $0 1 $222,000
Aggregated Statistics For Year 2000(Based on 3 full tracts) A) FHA, FSA/RHS & VA B) Conventional C) Refinancings D) Home Improvement Loans E) Loans on Dwellings For 5+ Families F) Non-occupant Loans on Number Average Value Number Average Value Number Average Value Number Average Value Number Average Value Number Average Value
LOANS ORIGINATED 16 $131,954 204 $190,616 76 $136,146 26 $40,892 2 $3,590,000 13 $138,308 APPLICATIONS APPROVED, NOT ACCEPTED 0 $0 32 $203,865 17 $102,568 6 $25,475 0 $0 3 $225,333 APPLICATIONS DENIED 0 $0 38 $154,307 48 $127,501 11 $20,545 1 $2,600,000 6 $221,167 APPLICATIONS WITHDRAWN 2 $192,490 30 $199,952 19 $149,709 6 $84,155 0 $0 1 $199,000 FILES CLOSED FOR INCOMPLETENESS 0 $0 3 $186,610 10 $201,228 0 $0 0 $0 1 $350,000
Aggregated Statistics For Year 1999(Based on 3 full and 5 partial tracts) A) FHA, FSA/RHS & VA B) Conventional C) Refinancings D) Home Improvement Loans E) Loans on Dwellings For 5+ Families F) Non-occupant Loans on Number Average Value Number Average Value Number Average Value Number Average Value Number Average Value Number Average Value
LOANS ORIGINATED 65 $143,836 1,025 $186,989 981 $162,263 155 $28,899 4 $475,798 128 $139,594 APPLICATIONS APPROVED, NOT ACCEPTED 3 $92,620 94 $173,928 151 $150,190 34 $27,846 1 $1,452,860 16 $122,184 APPLICATIONS DENIED 7 $113,417 151 $135,714 233 $154,760 53 $34,216 0 $0 24 $114,357 APPLICATIONS WITHDRAWN 5 $145,830 77 $167,272 144 $147,439 14 $111,256 1 $5,000 10 $124,367 FILES CLOSED FOR INCOMPLETENESS 0 $0 22 $164,568 61 $153,324 5 $38,670 0 $0 2 $99,020
Detailed mortgage data for all 12 tracts in Redmond, WA
Private Mortgage Insurance Companies Aggregated Statistics For Year 2009(Based on 7 full and 6 partial tracts) A) Conventional B) Refinancings C) Non-occupant Loans on Number Average Value Number Average Value Number Average Value
LOANS ORIGINATED 38 $360,404 25 $347,686 0 $0 APPLICATIONS APPROVED, NOT ACCEPTED 8 $369,805 8 $349,236 1 $329,480 APPLICATIONS DENIED 8 $410,746 10 $424,830 0 $0 APPLICATIONS WITHDRAWN 3 $275,867 4 $297,978 0 $0 FILES CLOSED FOR INCOMPLETENESS 0 $0 0 $0 0 $0
Aggregated Statistics For Year 2008(Based on 7 full and 6 partial tracts) A) Conventional B) Refinancings C) Non-occupant Loans on Number Average Value Number Average Value Number Average Value
LOANS ORIGINATED 114 $319,820 36 $310,839 8 $244,681 APPLICATIONS APPROVED, NOT ACCEPTED 27 $280,059 12 $378,765 0 $0 APPLICATIONS DENIED 6 $356,177 8 $302,271 1 $218,550 APPLICATIONS WITHDRAWN 2 $375,500 3 $298,760 0 $0 FILES CLOSED FOR INCOMPLETENESS 2 $393,355 2 $286,345 2 $286,345
Aggregated Statistics For Year 2007(Based on 7 full and 6 partial tracts) A) Conventional B) Refinancings C) Non-occupant Loans on Number Average Value Number Average Value Number Average Value
LOANS ORIGINATED 102 $301,957 25 $331,099 11 $294,138 APPLICATIONS APPROVED, NOT ACCEPTED 7 $338,521 4 $480,750 0 $0 APPLICATIONS DENIED 0 $0 1 $500,000 0 $0 APPLICATIONS WITHDRAWN 4 $263,530 2 $229,025 1 $240,000 FILES CLOSED FOR INCOMPLETENESS 1 $311,080 1 $532,950 0 $0
Aggregated Statistics For Year 2006(Based on 7 full and 5 partial tracts) A) Conventional B) Refinancings C) Non-occupant Loans on Number Average Value Number Average Value Number Average Value
LOANS ORIGINATED 56 $293,791 11 $307,358 5 $216,452 APPLICATIONS APPROVED, NOT ACCEPTED 11 $291,425 2 $347,015 1 $138,170 APPLICATIONS DENIED 2 $288,550 0 $0 1 $71,740 APPLICATIONS WITHDRAWN 0 $0 0 $0 0 $0 FILES CLOSED FOR INCOMPLETENESS 1 $331,350 0 $0 0 $0
Aggregated Statistics For Year 2005(Based on 7 full and 5 partial tracts) A) Conventional B) Refinancings C) Non-occupant Loans on Number Average Value Number Average Value Number Average Value
LOANS ORIGINATED 70 $224,372 24 $263,577 16 $132,278 APPLICATIONS APPROVED, NOT ACCEPTED 8 $194,766 11 $185,331 1 $222,000 APPLICATIONS DENIED 2 $80,400 0 $0 1 $105,000 APPLICATIONS WITHDRAWN 1 $203,080 2 $218,500 1 $225,000 FILES CLOSED FOR INCOMPLETENESS 1 $105,000 0 $0 1 $105,000
Aggregated Statistics For Year 2004(Based on 7 full and 6 partial tracts) A) Conventional B) Refinancings C) Non-occupant Loans on Number Average Value Number Average Value Number Average Value
LOANS ORIGINATED 71 $248,465 34 $272,771 7 $176,351 APPLICATIONS APPROVED, NOT ACCEPTED 21 $245,861 10 $282,348 2 $311,000 APPLICATIONS DENIED 0 $0 1 $229,000 0 $0 APPLICATIONS WITHDRAWN 5 $177,712 8 $335,885 1 $288,000 FILES CLOSED FOR INCOMPLETENESS 1 $180,000 0 $0 0 $0
Aggregated Statistics For Year 2003(Based on 7 full and 6 partial tracts) A) Conventional B) Refinancings C) Non-occupant Loans on Number Average Value Number Average Value Number Average Value
LOANS ORIGINATED 160 $222,952 125 $210,714 3 $177,880 APPLICATIONS APPROVED, NOT ACCEPTED 26 $206,818 41 $221,666 1 $83,570 APPLICATIONS DENIED 2 $287,500 4 $251,148 0 $0 APPLICATIONS WITHDRAWN 10 $210,908 12 $234,207 2 $235,070 FILES CLOSED FOR INCOMPLETENESS 0 $0 0 $0 0 $0
Aggregated Statistics For Year 2002(Based on 3 full tracts) A) Conventional B) Refinancings Number Average Value Number Average Value
LOANS ORIGINATED 47 $217,011 22 $197,738 APPLICATIONS APPROVED, NOT ACCEPTED 11 $226,545 7 $227,696 APPLICATIONS DENIED 2 $280,500 0 $0 APPLICATIONS WITHDRAWN 2 $186,295 1 $167,000 FILES CLOSED FOR INCOMPLETENESS 0 $0 0 $0
Aggregated Statistics For Year 2001(Based on 3 full tracts) A) Conventional B) Refinancings C) Non-occupant Loans on Number Average Value Number Average Value Number Average Value
LOANS ORIGINATED 62 $227,627 20 $214,933 0 $0 APPLICATIONS APPROVED, NOT ACCEPTED 7 $204,957 3 $214,467 0 $0 APPLICATIONS DENIED 3 $269,007 1 $159,000 1 $159,000 APPLICATIONS WITHDRAWN 2 $230,615 0 $0 1 $212,000 FILES CLOSED FOR INCOMPLETENESS 1 $150,000 0 $0 0 $0
Aggregated Statistics For Year 2000(Based on 3 full tracts) A) Conventional B) Refinancings C) Non-occupant Loans on Number Average Value Number Average Value Number Average Value
LOANS ORIGINATED 48 $192,375 4 $200,750 0 $0 APPLICATIONS APPROVED, NOT ACCEPTED 5 $154,600 0 $0 0 $0 APPLICATIONS DENIED 3 $237,940 0 $0 1 $239,000 APPLICATIONS WITHDRAWN 2 $239,500 1 $204,000 2 $221,500 FILES CLOSED FOR INCOMPLETENESS 0 $0 0 $0 0 $0
Aggregated Statistics For Year 1999(Based on 3 full and 5 partial tracts) A) Conventional B) Refinancings C) Non-occupant Loans on Number Average Value Number Average Value Number Average Value
LOANS ORIGINATED 270 $197,073 41 $187,990 5 $154,984 APPLICATIONS APPROVED, NOT ACCEPTED 21 $199,768 16 $181,480 1 $138,620 APPLICATIONS DENIED 14 $184,586 4 $248,622 2 $153,120 APPLICATIONS WITHDRAWN 12 $199,485 5 $211,522 1 $176,620 FILES CLOSED FOR INCOMPLETENESS 5 $217,216 3 $153,087 1 $152,510
Fire-safe hotels and motels in Redmond, Washington:
Silver Cloud Inn - Redmond, 2122 152nd Ave NE, Redmond, Washington 98052 Phone: (425) 746-8200, Fax: (425) 747-2078
Redmond Marriott Town Center, 7401 164th Avenue NE, Redmond, Washington 98052 Phone: (425) 498-4000, Fax: (425) 498-4009
Hyatt House Seattle/Redmond, 15785 Bear Crk Parkway NE, Redmond, Washington 98052 Phone: (425) 497-2000, Fax: (425) 497-2003
Hampton Inn & Suites Seattle/Redmond, 17770 NE 78th Pl, Redmond, Washington 98052 Phone: (425) 553-1200, Fax: (425) 553-1212
ALOFT SEATTLE REDMOND HOTEL, 15220 NE Shen ,St Ste 150, Redmond, Washington 98052 Phone: (425) 636-9922, Fax: (425) 636-9923
Element Seattle Redmond Hotel, 15220 NE Shen ,Street Ste 100, Redmond, Washington 98052 Phone: (425) 636-9942, Fax: (425) 636-9943
Archer Hotel Redmond, 7200 164th Avenue NE, Redmond, Washington 98052 Phone: (425) 658-3000, Fax: (425) 658-3001
All 7 fire-safe hotels and motels in Redmond, Washington
Most common first names in Redmond, WA among deceased individuals Name Count Lived (average)
William 165 77.7 years John 159 78.6 years Mary 149 81.6 years Robert 129 76.5 years Helen 103 84.9 years James 97 71.4 years Dorothy 94 80.9 years Ruth 87 83.3 years Margaret 73 83.5 years George 72 80.3 years
Most common last names in Redmond, WA among deceased individuals Last name Count Lived (average)
Smith 70 75.7 years Johnson 64 81.6 years Anderson 52 76.3 years Brown 34 81.0 years Miller 30 76.9 years Nelson 30 81.7 years Olson 29 79.0 years Jones 24 71.6 years White 23 75.4 years Williams 21 81.6 years
Redmond compared to Washington state average:
Median household income above state average. Median house value significantly above state average. Unemployed percentage significantly below state average. Foreign-born population percentage significantly above state average. Number of rooms per house below state average. House age below state average. Percentage of population with a bachelor's degree or higher significantly above state average.
#1 on the list of "Top 101 cities with largest percentage of males in occupations: computer and mathematical occupations (population 50,000+)"
#1 on the list of "Top 101 cities with largest percentage of males in industries: professional, scientific, and technical services (population 50,000+)"
#2 on the list of "Top 101 cities that people commute into (largest positive percentage daily daytime population change due to commuting) (population 50,000+)"
#2 on the list of "Top 101 cities with largest percentage of females in occupations: computer and mathematical occupations (population 50,000+)"
#4 on the list of "Top 101 cities with largest percentage of females in industries: professional, scientific, and technical services (population 50,000+)"
#5 on the list of "Top 100 cities with highest median household income and median resident age less than 35 (pop. 50,000+)"
#5 on the list of "Top 101 cities with largest percentage of males in industries: information (population 50,000+)"
#7 on the list of "Top 101 cities with the lowest maximum monthly sunshine amount (population 50,000+)"
#7 on the list of "Top 101 cities with the lowest minimum monthly sunshine amount (population 50,000+)"
#7 on the list of "Top 101 cities with the lowest average sunshine amount (population 50,000+)"
#11 on the list of "Top 101 cities with the lowest average wind speeds (population 50,000+)"
#12 on the list of "Top 101 cities with the largest city-data.com crime index decrease from 2011 to 2012 (population 50,000+)"
#13 on the list of "Top 101 cities with largest percentage of females in industries: information (population 50,000+)"
#14 on the list of "Top 101 cities with the largest city-data.com crime index decrease from 2002 to 2012 (population 50,000+)"
#24 on the list of "Top 101 cities with the most people having Master's or Doctorate degrees (population 50,000+)"
#27 on the list of "Top 101 cities with the highest ratio of rapes to murders between 2002 and 2012 (population 50,000+)"
#29 on the list of "Top 101 cities with the lowest number of assaults per 100,000 residents (population 50,000+)"
#34 on the list of "Top 101 cities with largest percentage of females in occupations: architecture and engineering occupations (population 50,000+)"
#34 on the list of "Top 101 cities with the lowest city-data.com crime index (population 50,000+)"
#37 on the list of "Top 101 cities with the smallest city-data.com crime index per police officer (population 50,000+)"
#58 (98052) on the list of "Top 101 zip codes with the most Internet business establishments in 2005"
#5 on the list of "Top 101 counties with the most Mainline Protestant congregations"
#8 on the list of "Top 101 counties with the lowest Ozone (1-hour) air pollution readings in 2012 (ppm)"
#9 on the list of "Top 101 counties with the most Other congregations"
#11 on the list of "Top 101 counties with the most Mainline Protestant adherents"
#11 on the list of "Top 101 counties with the highest percentage of residents that exercised in the past month"
Top Patent Applicants
Roderick A. Hyde (2198)
Microsoft Corporation (279)
Eyal Ofek (131)
William Gates (106)
Jason Garms (100)
Alex Aben-Athar Kipman (82)
Kenneth P. Hinckley (80)
Stephen L. Malaska (79)
Shawn P. Firminger (75)
Raymond G. Beausoleil (74)
Total of 18293 patent applications in 2008-2024.


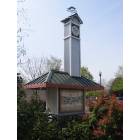
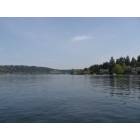
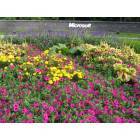


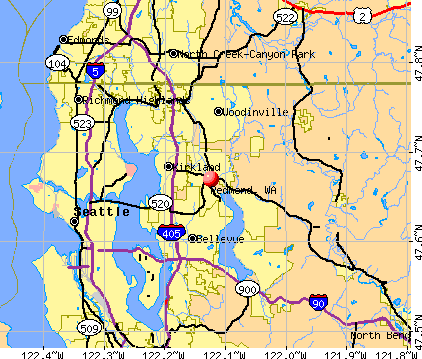


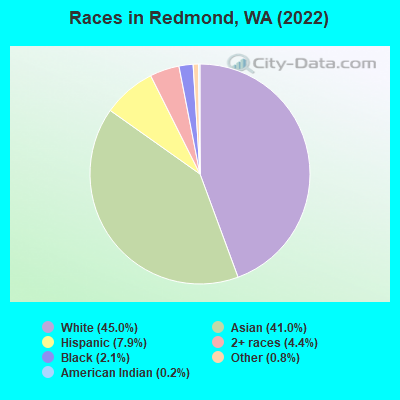
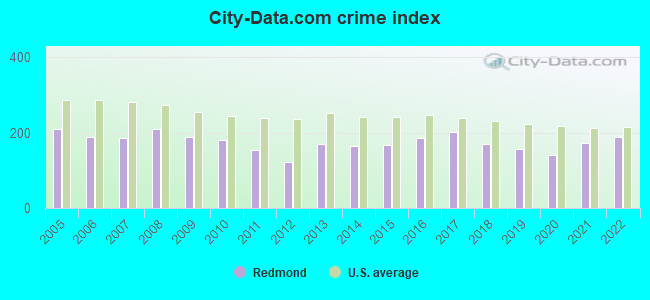
 Recent articles from our blog. Our writers, many of them Ph.D. graduates or candidates, create easy-to-read articles on a wide variety of topics.


 , pop. 480,100).
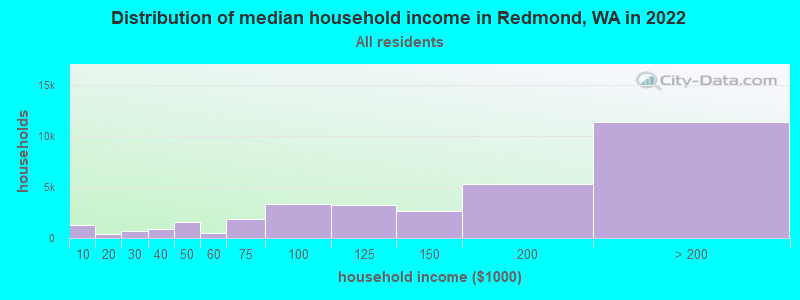
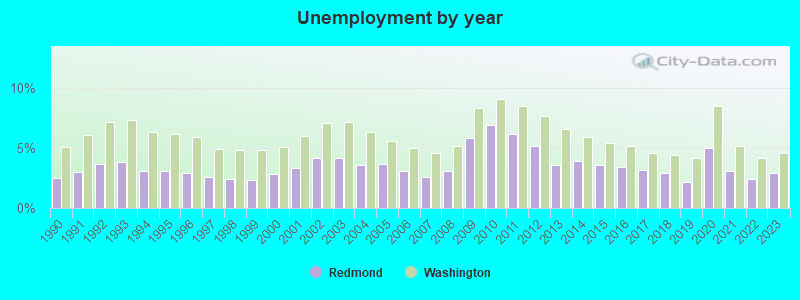
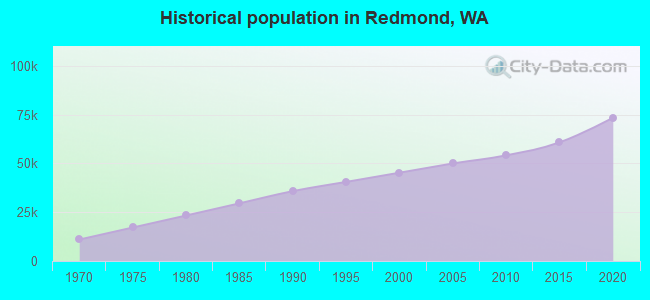
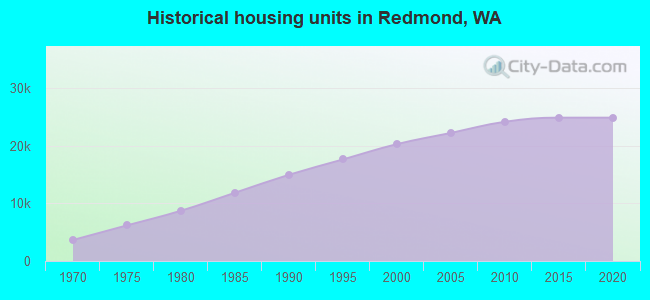
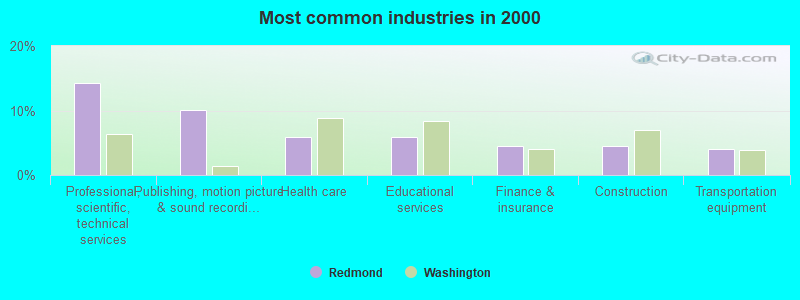
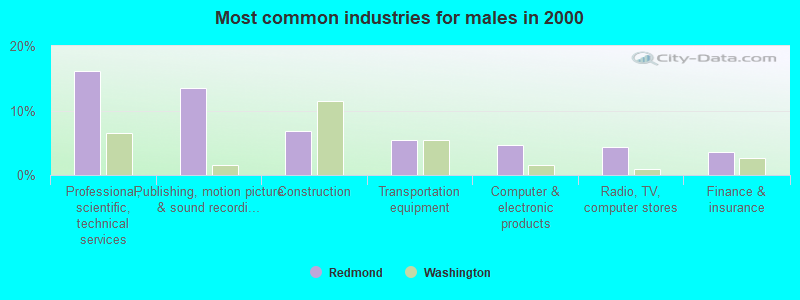
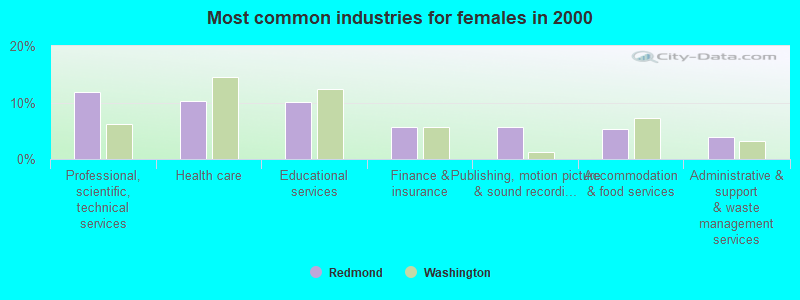
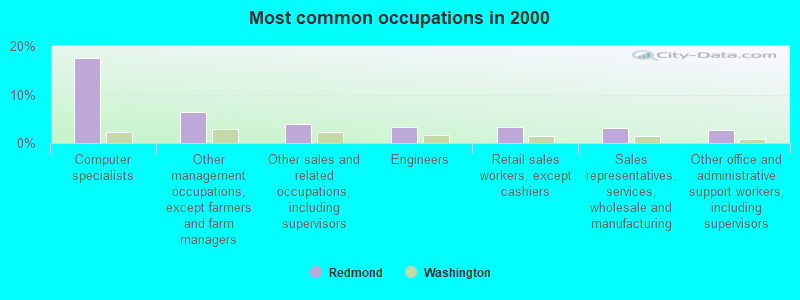
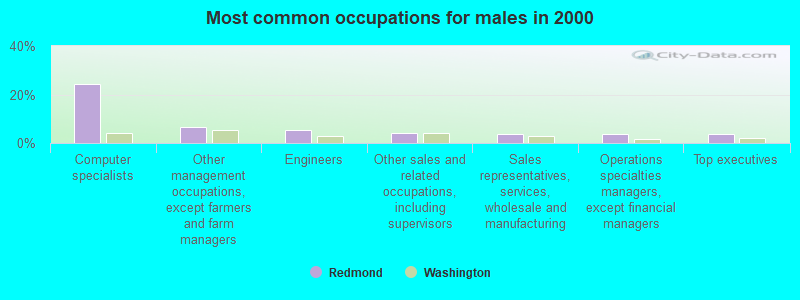
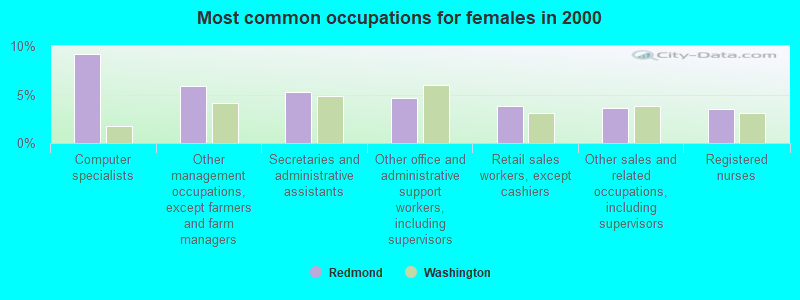
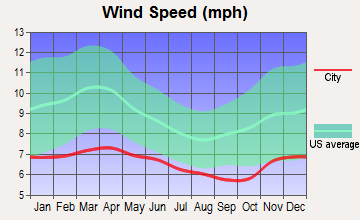
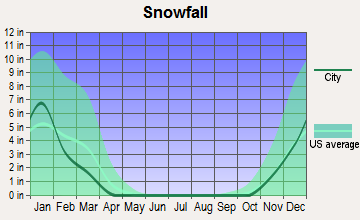
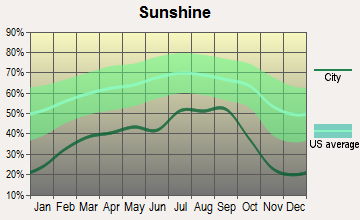
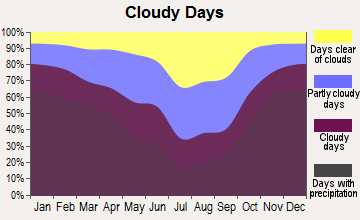


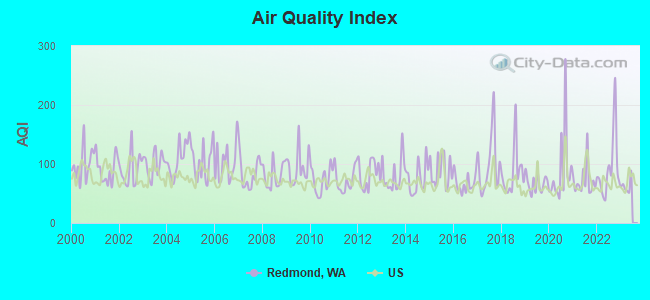
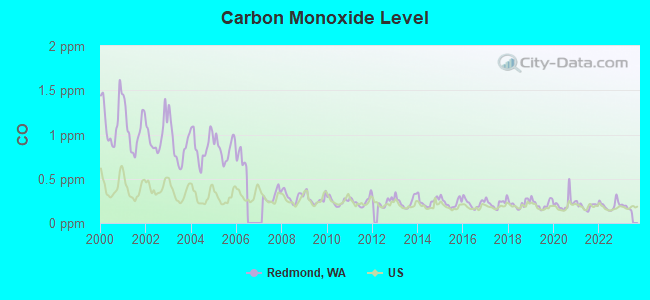
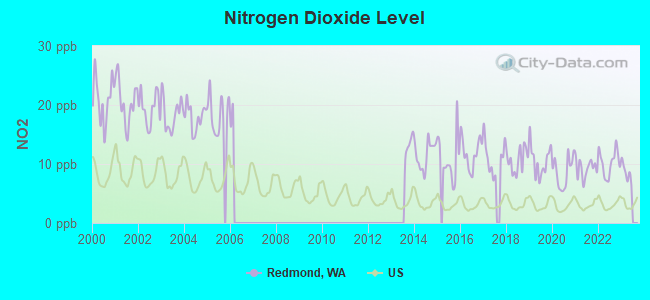
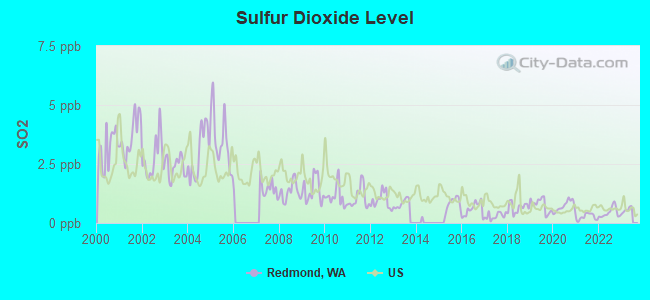
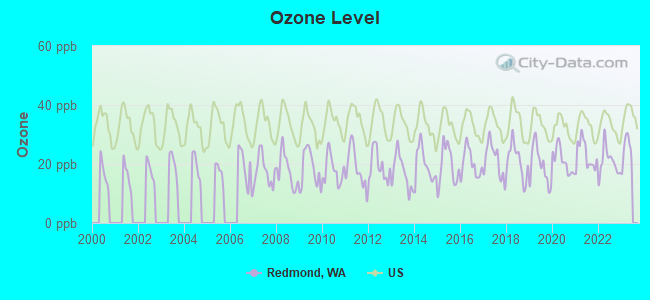
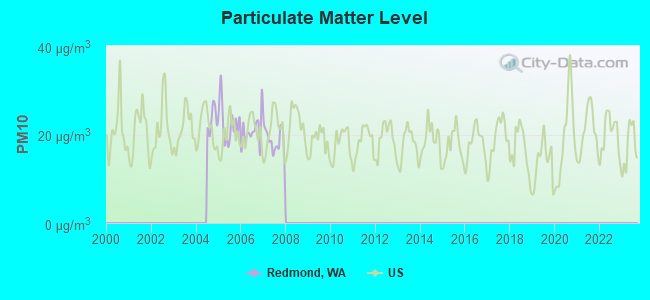
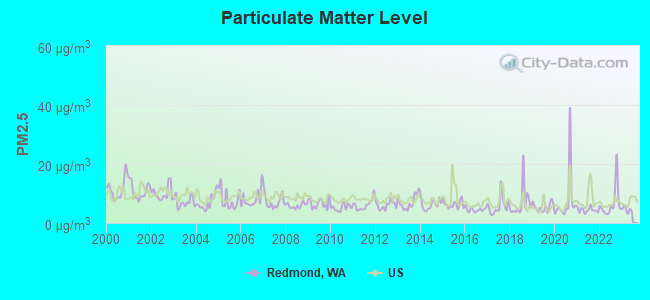
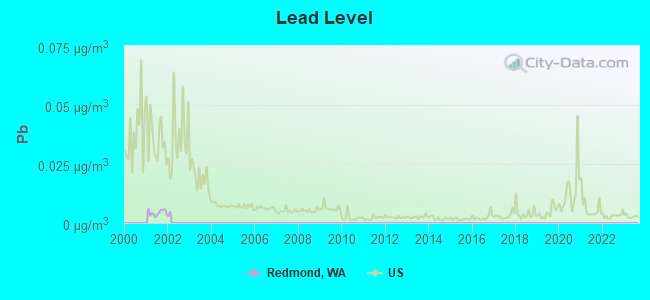
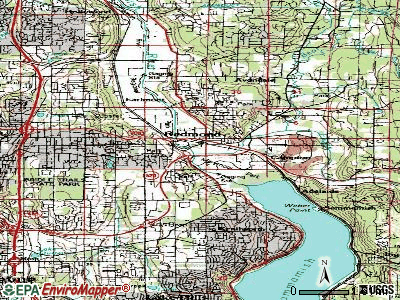
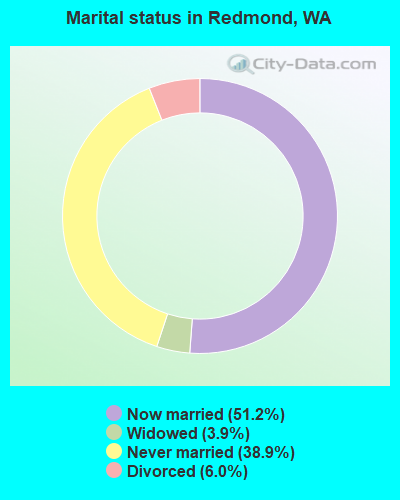
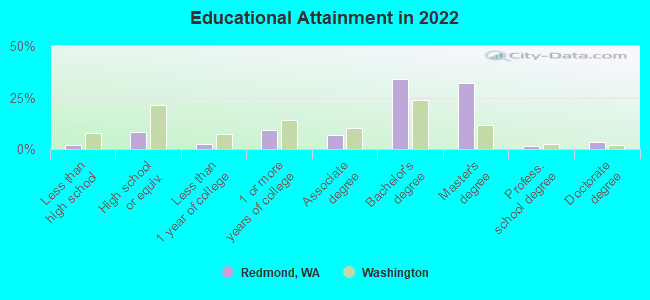
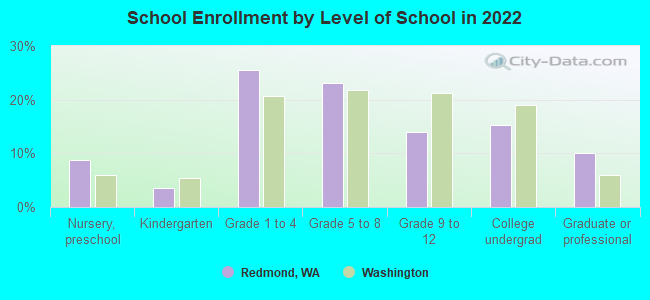
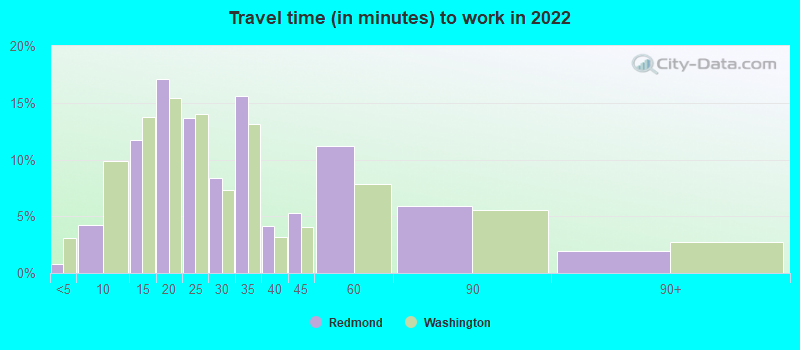
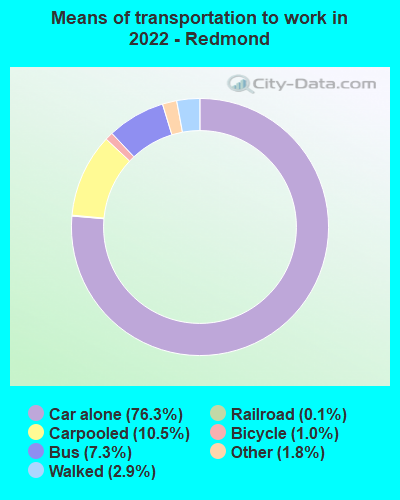
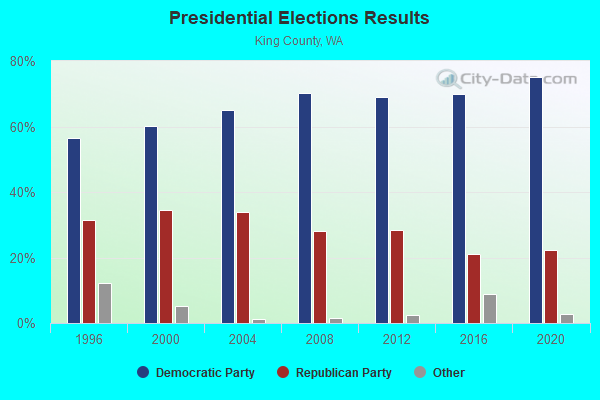
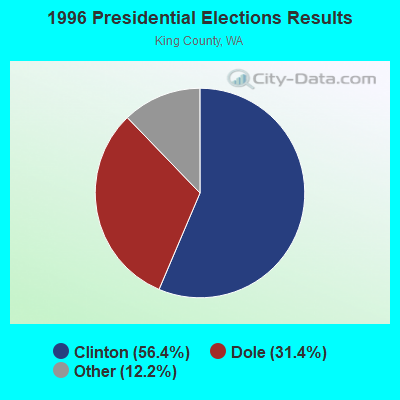
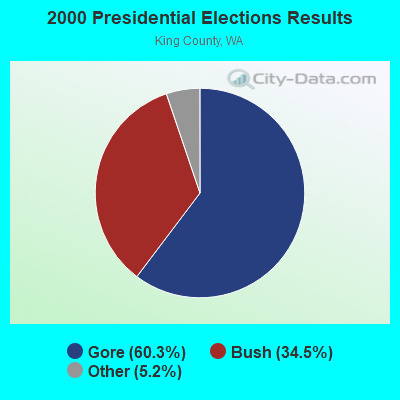
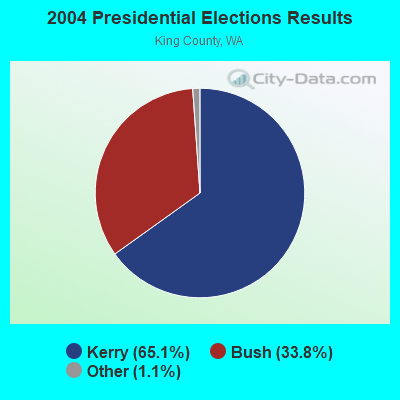
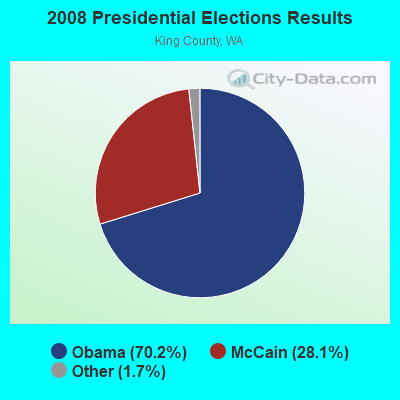
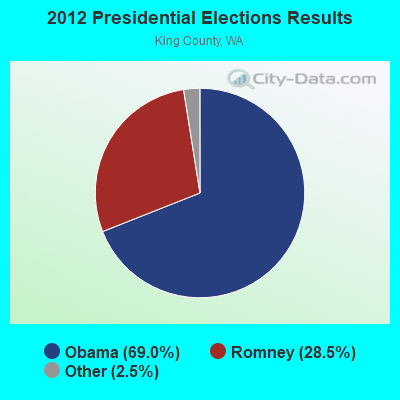
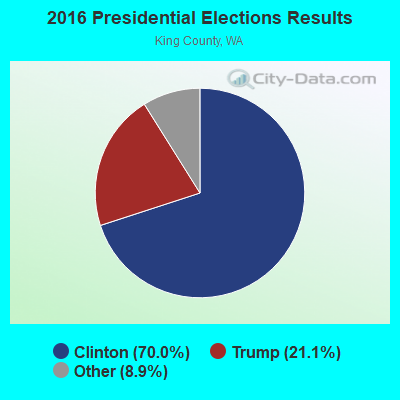
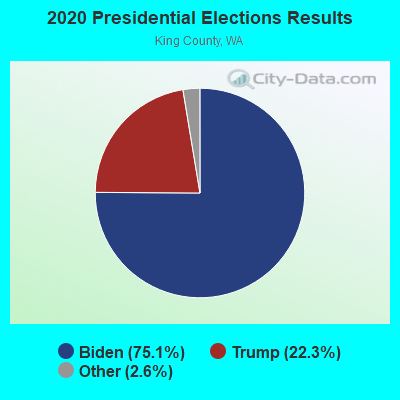
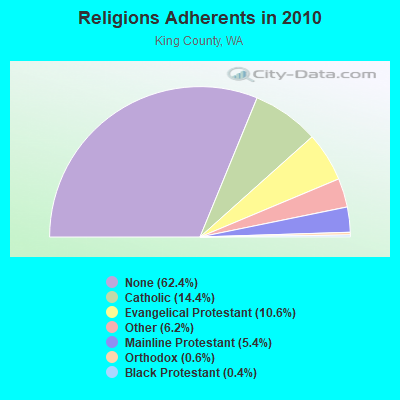
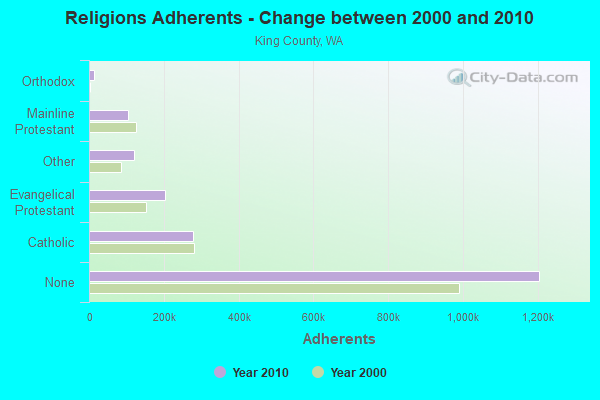
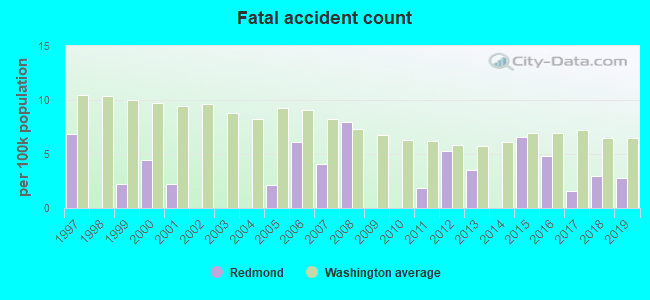
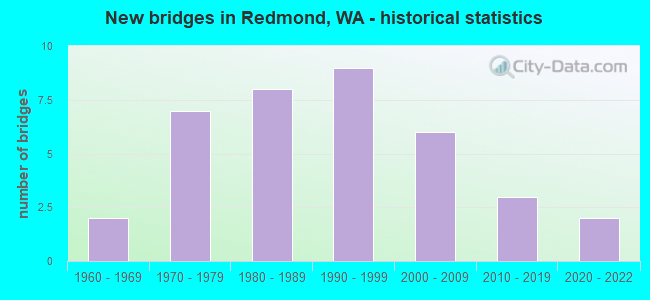
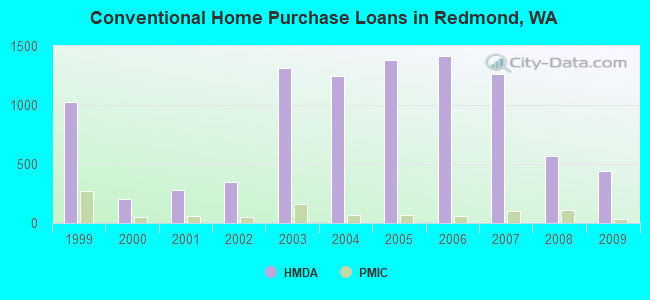
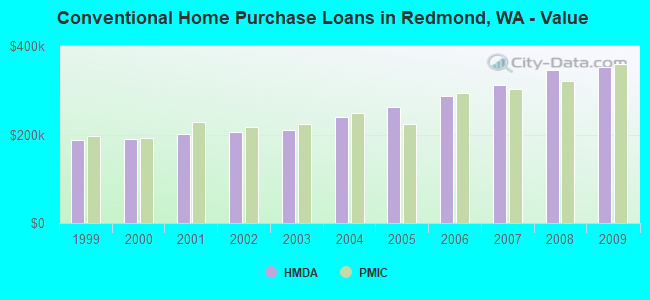
 According to the data from the years 2002 - 2018 the average number of fires per year is 117. The highest number of reported fire incidents - 152 took place in 2008, and the least - 21 in 2002. The data has a rising trend.
 When looking into fire subcategories, the most incidents belonged to: Structure Fires (46.2%), and Outside Fires (34.0%).