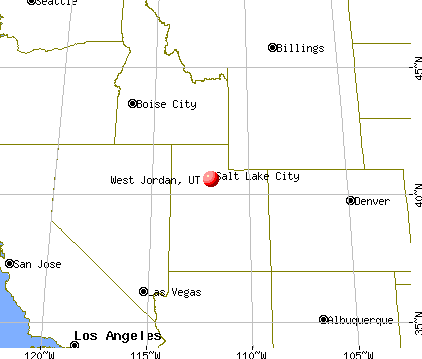
West Jordan, Utah
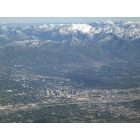
Submit your own pictures of this city and show them to the world
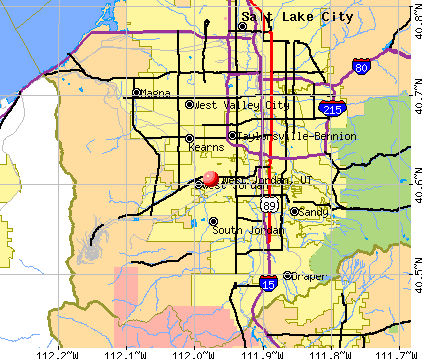
- OSM Map
- General Map
- Google Map
- MSN Map
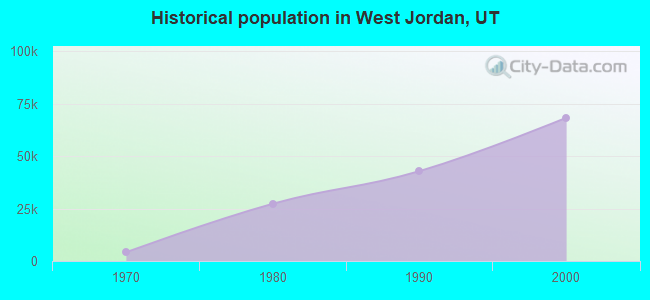
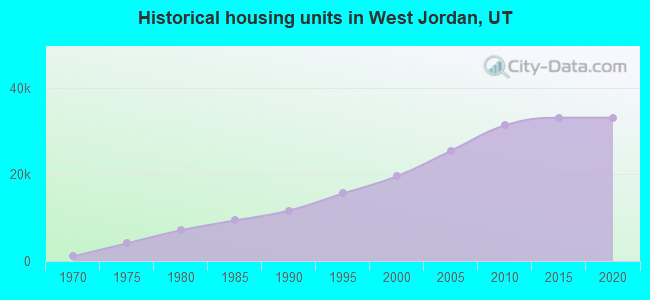
Population change since 2000: +70.7%
| Males: 59,225 | |
| Females: 57,439 |
| Median resident age: | 34.1 years |
| Utah median age: | 32.1 years |
Zip codes: 84081.
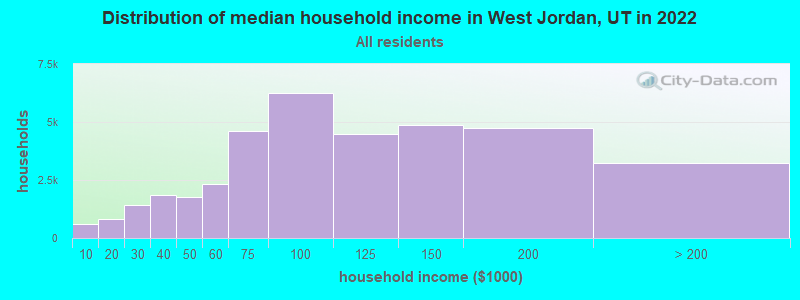
| West Jordan: | $95,434 |
| UT: | $89,168 |
Estimated per capita income in 2022: $34,815 (it was $17,221 in 2000)
West Jordan city income, earnings, and wages data
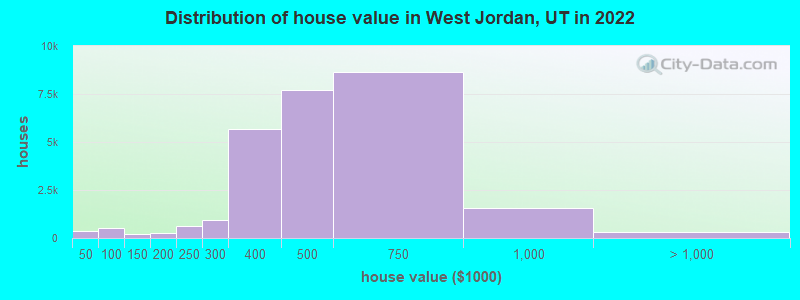
Estimated median house or condo value in 2022: $499,000 (it was $152,600 in 2000)
| West Jordan: | $499,000 |
| UT: | $499,500 |
Mean prices in 2022: all housing units: $517,332; detached houses: $545,203; townhouses or other attached units: $412,092; in 3-to-4-unit structures: $415,576; in 5-or-more-unit structures: $353,659; mobile homes: $140,710
Median gross rent in 2022: $1,613.
(3.5% for White Non-Hispanic residents, 33.7% for Black residents, 11.0% for Hispanic or Latino residents, 19.1% for American Indian residents, 27.4% for Native Hawaiian and other Pacific Islander residents, 13.8% for other race residents, 8.9% for two or more races residents)
Detailed information about poverty and poor residents in West Jordan, UT


Compare current foreclosures in West Jordan, UT:
| Photo | Address | Area | Beds / Baths | Price | Details |
|---|---|---|---|---|---|

|
#1
S Sorrento Way
West Jordan, UT 84081
|
1,332 sq. feet
|
2 baths 4 beds |
show details | |

|
#2
S Slalom Way
West Jordan, UT 84084
|
1,410 sq. feet
|
2 baths 3 beds |
show details | |

|
#3
W Van St
West Jordan, UT 84088
|
1,466 sq. feet
|
2 baths 3 beds |
show details | |

|
#4
S Bromley Rd
West Jordan, UT 84084
|
1,892 sq. feet
|
4 baths 3 beds |
show details | |

|
#5
W Green Acre Dr
West Jordan, UT 84088
|
1,304 sq. feet
|
1 baths 3 beds |
show details | |

|
#6
Westland Dr
West Jordan, UT 84088
|
3,053 sq. feet
|
5 baths 8 beds |
show details | |

|
#7
S 2870 W
West Jordan, UT 84088
|
1,310 sq. feet
|
2 baths 4 beds |
show details | |

|
#8
Saddle Hollow Pl
West Jordan, UT 84081
|
1,830 sq. feet
|
2 baths 3 beds |
show details | |

|
#9
W 7000 S
West Jordan, UT 84081
|
1,044 sq. feet
|
1 baths 3 beds |
show details | |

|
#10
S 1850 W
West Jordan, UT 84088
|
3,296 sq. feet
|
2 baths 3 beds |
show details |
| Photo | Address | Area | Beds / Baths | Price | Details |
|---|---|---|---|---|---|

|
#11
W Kentucky Dr
West Jordan, UT 84084
|
1,427 sq. feet
|
2 baths 4 beds |
show details | |

|
#12
W 8525 S
West Jordan, UT 84088
|
1,338 sq. feet
|
1 baths 3 beds |
show details | |

|
#13
W Valley Maple Dr
West Jordan, UT 84081
|
2,171 sq. feet
|
2 baths 4 beds |
show details | |

|
#14
S 5095 W
West Jordan, UT 84081
|
1,534 sq. feet
|
1 baths 3 beds |
show details | |

|
#15
W Cottage Point Dr
West Jordan, UT 84081
|
1,548 sq. feet
|
2 baths 5 beds |
show details | |

|
#16
S 2700 W # South
West Jordan, UT 84088
|
2,936 sq. feet
|
5 baths 6 beds |
show details | |

|
#17
Running Springs Dr
West Jordan, UT 84084
|
1,634 sq. feet
|
2 baths 4 beds |
show details | |

|
#18
River Ridge Dr
West Jordan, UT 84088
|
1,221 sq. feet
|
1 baths 3 beds |
show details | |

|
#19
S Callie Dr
West Jordan, UT 84084
|
1,560 sq. feet
|
1 baths 3 beds |
show details | |

|
#20
S Wakefield Way
West Jordan, UT 84081
|
2,462 sq. feet
|
2 baths 6 beds |
show details |
| Photo | Address | Area | Beds / Baths | Price | Details |
|---|---|---|---|---|---|

|
#21
W 8620 S
West Jordan, UT 84081
|
2,354 sq. feet
|
2 baths 4 beds |
show details | |

|
#22
W Athleen Dr
West Jordan, UT 84084
|
1,350 sq. feet
|
1 baths 4 beds |
show details | |

|
#23
S 3335 W
West Jordan, UT 84084
|
1,415 sq. feet
|
2 baths 3 beds |
show details | |

|
#24
S 2400 W
West Jordan, UT 84084
|
1,894 sq. feet
|
2 baths 4 beds |
show details | |

|
#25
S Clematis Way
West Jordan, UT 84081
|
1,660 sq. feet
|
1 baths 4 beds |
show details | |

|
#26
Copper Pot Ln
West Jordan, UT 84088
|
1,676 sq. feet
|
2 baths 3 beds |
show details | |

|
#27
Green Acre Dr
West Jordan, UT 84088
|
1,797 sq. feet
|
1 baths 4 beds |
show details | |

|
#28
S Brittany Town Dr
West Jordan, UT 84084
|
656 sq. feet
|
2 baths 3 beds |
show details | |

|
#29
W Black Elk Way
West Jordan, UT 84088
|
2,652 sq. feet
|
2 baths 5 beds |
show details | |

|
#30
S 2345 W
West Jordan, UT 84084
|
1,600 sq. feet
|
2 baths 3 beds |
show details |
| Photo | Address | Area | Beds / Baths | Price | Details |
|---|---|---|---|---|---|

|
#31
S Poison Oak Dr
West Jordan, UT 84081
|
2,213 sq. feet
|
2 baths 3 beds |
show details | |

|
#32
W 7600 S Apt 416
West Jordan, UT 84084
|
643 sq. feet
|
2 baths 3 beds |
show details | |

|
#33
Autumn Dr
West Jordan, UT 84084
|
2,125 sq. feet
|
4 baths 4 beds |
show details | |

|
#34
W Garonne Ave
West Jordan, UT 84084
|
1,116 sq. feet
|
2 baths 2 beds |
show details | |

|
#35
W Lower Huntly Way
West Jordan, UT 84088
|
1,510 sq. feet
|
2 baths 3 beds |
show details | |

|
#36
W 8600 S
West Jordan, UT 84088
|
2,172 sq. feet
|
4 baths 5 beds |
show details | |

|
#37
Moreland Cir
West Jordan, UT 84084
|
1,677 sq. feet
|
2 baths 4 beds |
show details | |

|
#38
S Traveler Ln
West Jordan, UT 84081
|
665 sq. feet
|
2 baths 3 beds |
show details | |

|
#39
W 7550 S
West Jordan, UT 84084
|
1,816 sq. feet
|
2 baths 4 beds |
show details | |

|
#40
W 7095 S
West Jordan, UT 84084
|
2,000 sq. feet
|
3 baths 3 beds |
show details |
| Photo | Address | Area | Beds / Baths | Price | Details |
|---|---|---|---|---|---|

|
#41
Madison Nan Dr
West Jordan, UT 84081
|
1,350 sq. feet
|
2 baths 3 beds |
show details | |

|
#42
W Saguaro Dr
West Jordan, UT 84081
|
1,360 sq. feet
|
1 baths 4 beds |
show details | |

|
#43
W Yellow Poppy Dr
West Jordan, UT 84081
|
644 sq. feet
|
2 baths 3 beds |
show details | |

|
#44
W 7990 S
West Jordan, UT 84088
|
898 sq. feet
|
2 baths 4 beds |
show details | |

|
#45
S Mcginnis Ln
West Jordan, UT 84081
|
2,264 sq. feet
|
3 baths 4 beds |
show details | |

|
#46
W 8250 S
West Jordan, UT 84088
|
1,519 sq. feet
|
1 baths 3 beds |
show details | |

|
#47
S Robert Cir
West Jordan, UT 84084
|
1,753 sq. feet
|
2 baths 5 beds |
show details | |

|
#48
S 3420 W
West Jordan, UT 84084
|
1,000 sq. feet
|
1 baths 3 beds |
show details | |

|
#49
W Vistawest Dr
West Jordan, UT 84088
|
1,803 sq. feet
|
2 baths 3 beds |
show details | |

|
Check over 1 million property listings on Foreclosure.com!
|
browse all offers | |||


- 82,23770.5%White alone
- 23,80320.4%Hispanic
- 5,1684.4%Asian alone
- 2,6802.3%Two or more races
- 1,4971.3%Black alone
- 5650.5%Other race alone
- 4110.4%Native Hawaiian and Other
Pacific Islander alone - 3010.3%American Indian alone
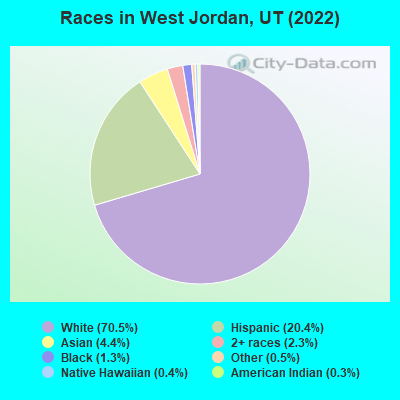
Races in West Jordan detailed stats: ancestries, foreign born residents, place of birth
According to our research of Utah and other state lists, there were 168 registered sex offenders living in West Jordan, Utah as of April 26, 2024.
The ratio of all residents to sex offenders in West Jordan is 677 to 1.
The ratio of registered sex offenders to all residents in this city is lower than the state average.
The City-Data.com crime index weighs serious crimes and violent crimes more heavily. Higher means more crime, U.S. average is 246.1. It adjusts for the number of visitors and daily workers commuting into cities.
- means the value is smaller than the state average.- means the value is about the same as the state average.
- means the value is bigger than the state average.
- means the value is much bigger than the state average.
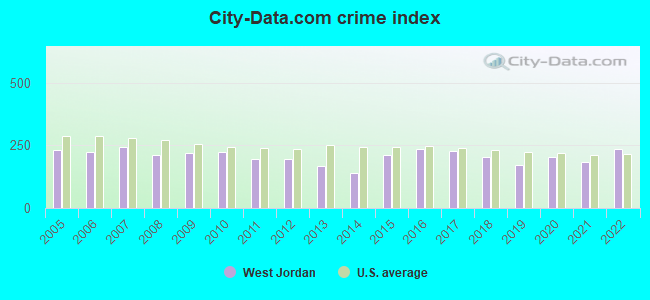
Crime rate in West Jordan detailed stats: murders, rapes, robberies, assaults, burglaries, thefts, arson
Full-time law enforcement employees in 2021, including police officers: 138 (115 officers - 100 male; 15 female).
| Officers per 1,000 residents here: | 0.98 |
| Utah average: | 1.67 |
 Recent articles from our blog. Our writers, many of them Ph.D. graduates or candidates, create easy-to-read articles on a wide variety of topics.


 | Bluffdale vs West Jordan for living (4 replies) |
| Apartment recommendations near West Jordan with/near dog park (15 replies) |
| West Jordan (26 replies) |
| Relocation to salt lake city in November need some friendly advice (13 replies) |
| Biracial Californians looking for Our Spot in Utah (17 replies) |
| Neighborhood Suggestions near SLC (10 replies) |
Latest news from West Jordan, UT collected exclusively by city-data.com from local newspapers, TV, and radio stations
Ancestries: English (19.1%), American (8.4%), European (4.8%), German (4.1%), Irish (2.9%), British (2.2%).
Current Local Time: MST time zone
Incorporated on 01/10/1941
Elevation: 4370 feet
Land area: 30.9 square miles.
Population density: 3,775 people per square mile (average).
14,461 residents are foreign born (8.5% Latin America, 2.0% Asia).
| This city: | 12.4% |
| Utah: | 8.4% |
Median real estate property taxes paid for housing units with mortgages in 2022: $2,515 (0.5%)
Median real estate property taxes paid for housing units with no mortgage in 2022: $2,252 (0.5%)
Nearest city with pop. 200,000+: Las Vegas, NV  (352.2 miles , pop. 478,434).
Nearest city with pop. 1,000,000+: Phoenix, AZ (489.6 miles , pop. 1,321,045).
Nearest cities:
), ), ), ), Latitude: 40.61 N, Longitude: 111.98 W
Daytime population change due to commuting: -23,140 (-19.8%)
Workers who live and work in this city: 24,182 (37.6%)
Area code commonly used in this area: 801
West Jordan, Utah accommodation & food services, waste management - Economy and Business Data
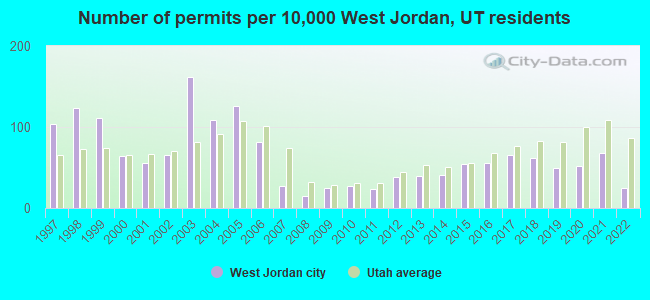
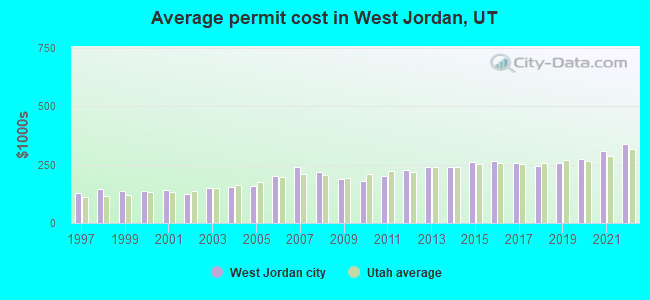
Single-family new house construction building permits:
- 2022: 170 buildings, average cost: $337,600
- 2021: 463 buildings, average cost: $307,900
- 2020: 353 buildings, average cost: $273,000
- 2019: 335 buildings, average cost: $259,200
- 2018: 424 buildings, average cost: $245,800
- 2017: 452 buildings, average cost: $255,400
- 2016: 385 buildings, average cost: $265,100
- 2015: 370 buildings, average cost: $260,500
- 2014: 281 buildings, average cost: $240,600
- 2013: 273 buildings, average cost: $237,600
- 2012: 263 buildings, average cost: $228,300
- 2011: 158 buildings, average cost: $199,900
- 2010: 185 buildings, average cost: $177,600
- 2009: 173 buildings, average cost: $189,800
- 2008: 102 buildings, average cost: $217,700
- 2007: 184 buildings, average cost: $239,200
- 2006: 560 buildings, average cost: $200,000
- 2005: 858 buildings, average cost: $159,900
- 2004: 742 buildings, average cost: $152,800
- 2003: 1107 buildings, average cost: $148,700
- 2002: 441 buildings, average cost: $122,700
- 2001: 373 buildings, average cost: $140,500
- 2000: 434 buildings, average cost: $135,400
- 1999: 758 buildings, average cost: $134,700
- 1998: 844 buildings, average cost: $144,700
- 1997: 713 buildings, average cost: $126,600
| Here: | 2.3% |
| Utah: | 2.5% |
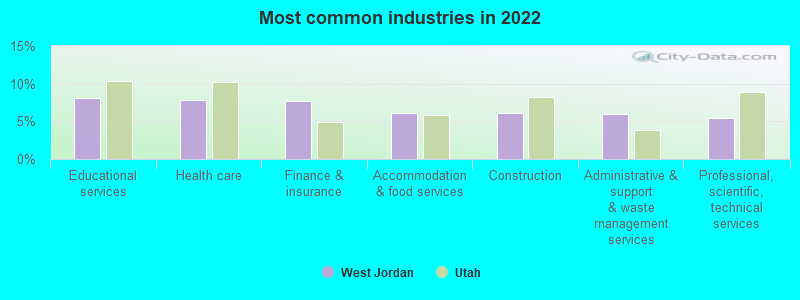
- Educational services (8.1%)
- Health care (7.8%)
- Finance & insurance (7.7%)
- Accommodation & food services (6.1%)
- Construction (6.1%)
- Administrative & support & waste management services (5.9%)
- Professional, scientific, technical services (5.5%)
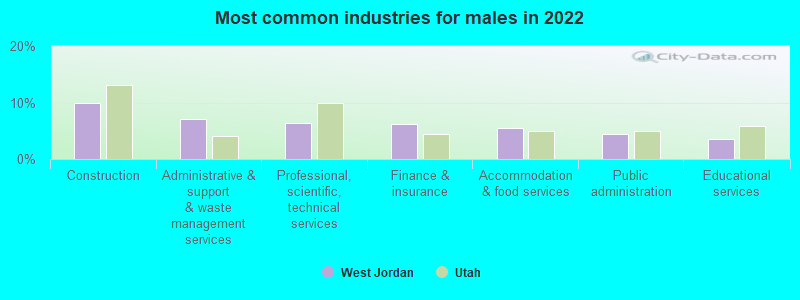
- Construction (9.8%)
- Administrative & support & waste management services (7.1%)
- Professional, scientific, technical services (6.4%)
- Finance & insurance (6.2%)
- Accommodation & food services (5.4%)
- Public administration (4.4%)
- Educational services (3.6%)
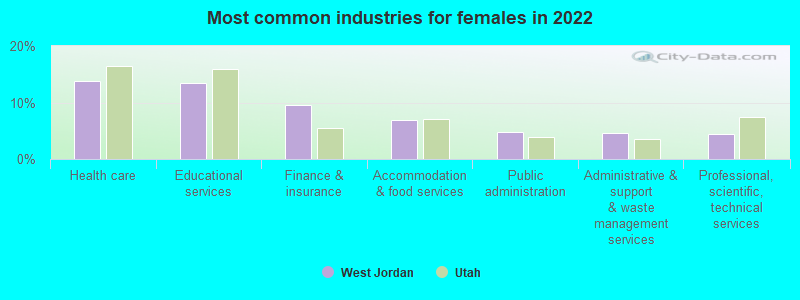
- Health care (13.7%)
- Educational services (13.4%)
- Finance & insurance (9.5%)
- Accommodation & food services (7.0%)
- Public administration (4.8%)
- Administrative & support & waste management services (4.6%)
- Professional, scientific, technical services (4.4%)
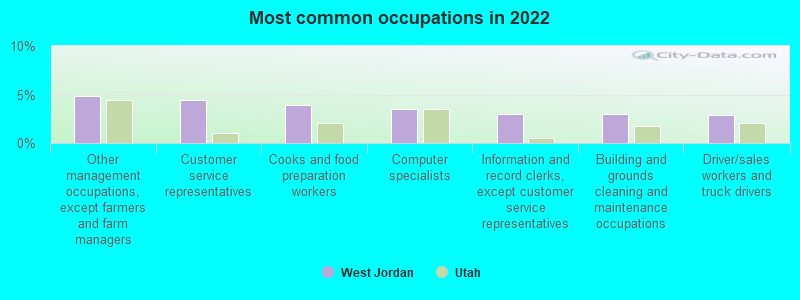
- Other management occupations, except farmers and farm managers (4.9%)
- Customer service representatives (4.4%)
- Cooks and food preparation workers (4.0%)
- Computer specialists (3.5%)
- Information and record clerks, except customer service representatives (3.0%)
- Building and grounds cleaning and maintenance occupations (3.0%)
- Driver/sales workers and truck drivers (2.9%)
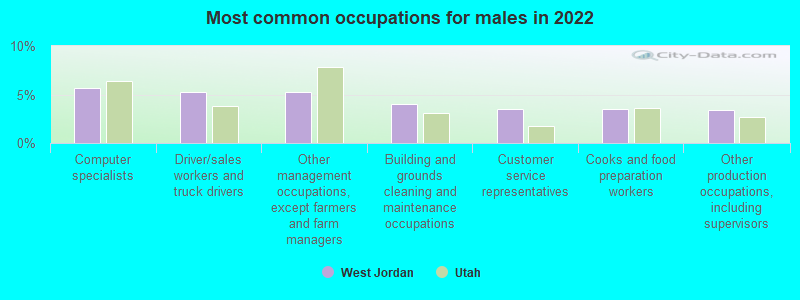
- Computer specialists (5.6%)
- Driver/sales workers and truck drivers (5.2%)
- Other management occupations, except farmers and farm managers (5.2%)
- Building and grounds cleaning and maintenance occupations (4.0%)
- Customer service representatives (3.5%)
- Cooks and food preparation workers (3.5%)
- Other production occupations, including supervisors (3.4%)
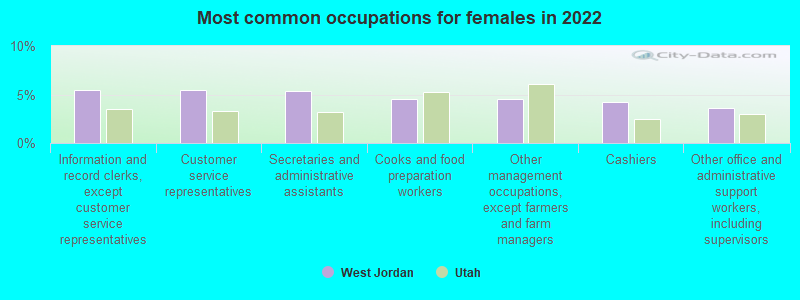
- Information and record clerks, except customer service representatives (5.5%)
- Customer service representatives (5.4%)
- Secretaries and administrative assistants (5.4%)
- Cooks and food preparation workers (4.5%)
- Other management occupations, except farmers and farm managers (4.5%)
- Cashiers (4.2%)
- Other office and administrative support workers, including supervisors (3.7%)
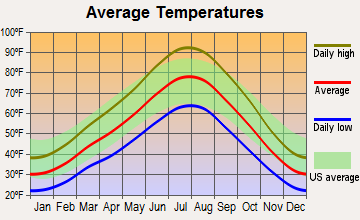
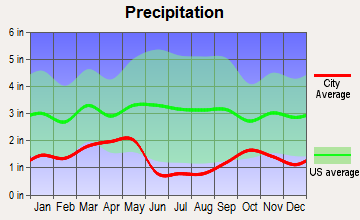
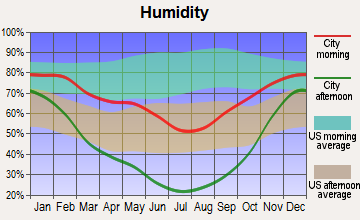
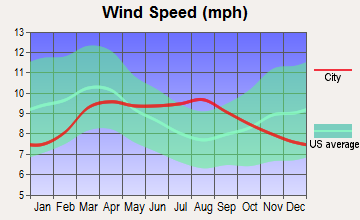
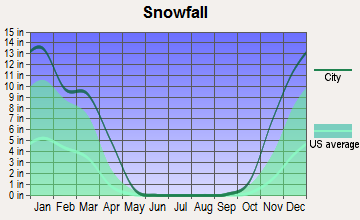
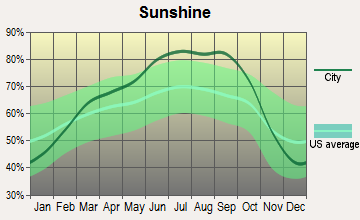
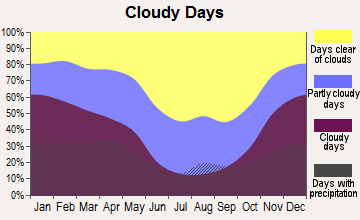
Average climate in West Jordan, Utah
Based on data reported by over 4,000 weather stations
|
|

(lower is better)
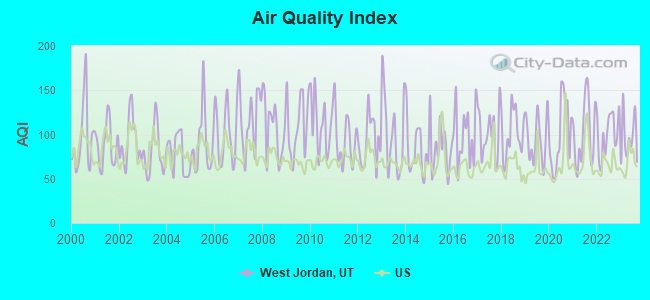
Air Quality Index (AQI) level in 2023 was 95.8. This is worse than average.
| City: | 95.8 |
| U.S.: | 72.6 |
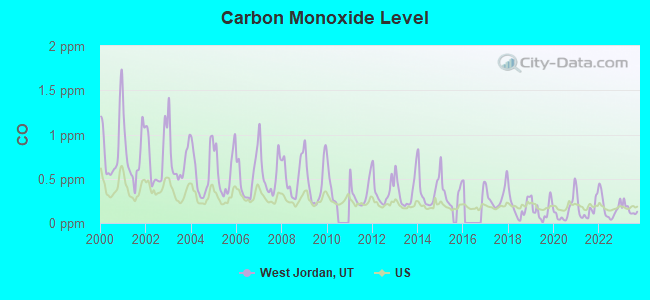
Carbon Monoxide (CO) [ppm] level in 2023 was 0.155. This is significantly better than average. Closest monitor was 4.3 miles away from the city center.
| City: | 0.155 |
| U.S.: | 0.251 |
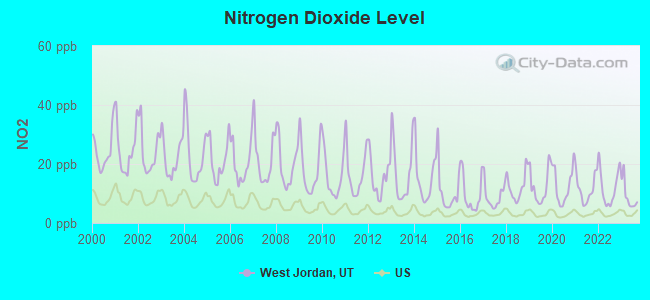
Nitrogen Dioxide (NO2) [ppb] level in 2023 was 9.09. This is significantly worse than average. Closest monitor was 3.8 miles away from the city center.
| City: | 9.09 |
| U.S.: | 5.11 |
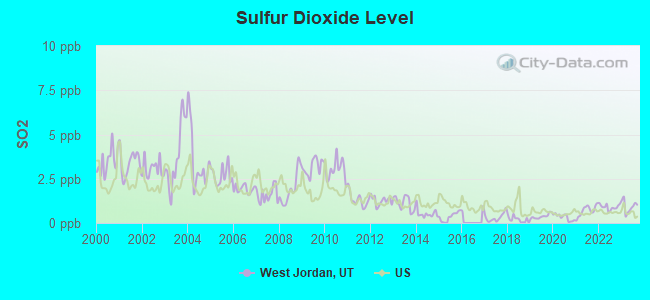
Sulfur Dioxide (SO2) [ppb] level in 2023 was 0.932. This is significantly better than average. Closest monitor was 3.8 miles away from the city center.
| City: | 0.932 |
| U.S.: | 1.515 |
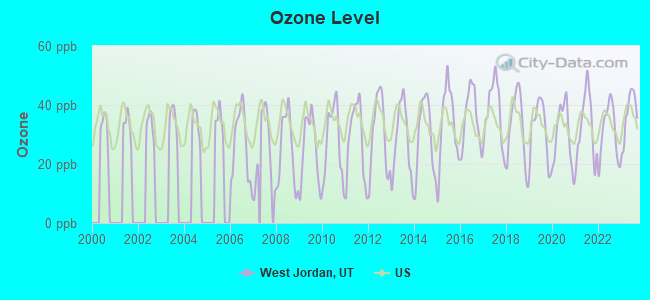
Ozone [ppb] level in 2023 was 36.9. This is about average. Closest monitor was 3.8 miles away from the city center.
| City: | 36.9 |
| U.S.: | 33.3 |
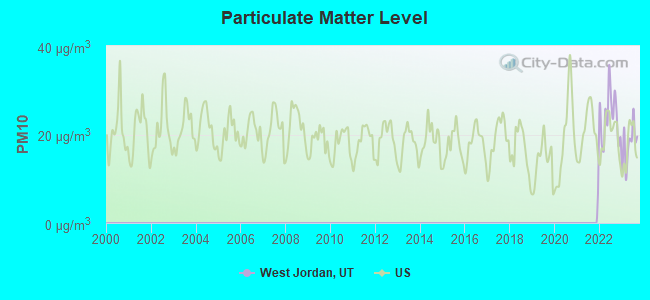
Particulate Matter (PM10) [µg/m3] level in 2023 was 17.8. This is about average. Closest monitor was 7.2 miles away from the city center.
| City: | 17.8 |
| U.S.: | 19.2 |
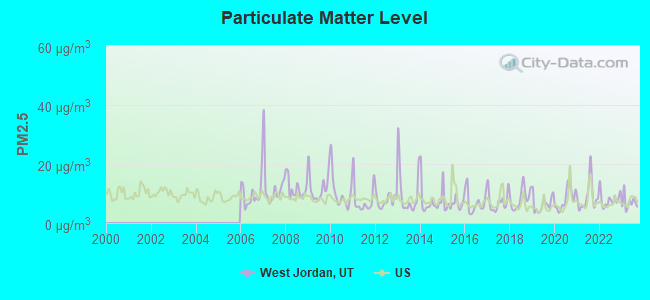
Particulate Matter (PM2.5) [µg/m3] level in 2023 was 6.91. This is about average. Closest monitor was 4.3 miles away from the city center.
| City: | 6.91 |
| U.S.: | 8.11 |
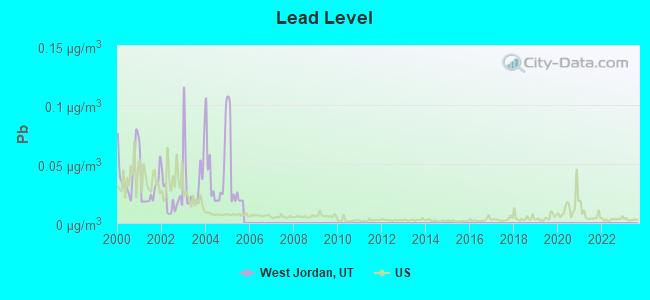
Lead (Pb) [µg/m3] level in 2005 was 0.0394. This is significantly worse than average. Closest monitor was 6.8 miles away from the city center.
| City: | 0.0394 |
| U.S.: | 0.0093 |
Earthquake activity:
West Jordan-area historical earthquake activity is significantly above Utah state average. It is 2220% greater than the overall U.S. average.On 8/18/1959 at 06:37:13, a magnitude 7.7 (7.7 UK, Class: Major, Intensity: VIII - XII) earthquake occurred 282.0 miles away from the city center, causing $26,000,000 total damage
On 10/3/1915 at 06:52:48, a magnitude 7.6 (7.6 UK) earthquake occurred 290.3 miles away from the city center
On 10/28/1983 at 14:06:06, a magnitude 7.3 (6.2 MB, 7.3 MS, 7.0 MW) earthquake occurred 257.5 miles away from the city center, causing 2 deaths (2 shaking deaths) and 3 injuries, causing $15,000,000 total damage
On 3/28/1975 at 02:31:05, a magnitude 6.2 (6.1 MB, 6.0 MS, 6.2 ML, Class: Strong, Intensity: VII - IX) earthquake occurred 100.6 miles away from West Jordan center
On 3/18/2020 at 13:09:31, a magnitude 5.7 (5.7 MW, Depth: 7.4 mi, Class: Moderate, Intensity: VI - VII) earthquake occurred 11.3 miles away from West Jordan center
On 12/21/1932 at 06:10:09, a magnitude 7.2 (7.2 UK) earthquake occurred 356.4 miles away from the city center
Magnitude types: body-wave magnitude (MB), local magnitude (ML), surface-wave magnitude (MS), moment magnitude (MW)
Natural disasters:
The number of natural disasters in Salt Lake County (9) is smaller than the US average (15).Major Disasters (Presidential) Declared: 4
Emergencies Declared: 1
Causes of natural disasters: Floods: 3, Storms: 3, Fires: 2, Landslides: 2, Earthquake: 1, Hurricane: 1, Mudslide: 1, Tornado: 1, Other: 1 (Note: some incidents may be assigned to more than one category).
Hospitals and medical centers in West Jordan:
- JORDAN VALLEY MEDICAL CENTER (Voluntary non-profit - Other, provides emergency services, 3580 WEST 9000 SOUTH)
- RIVENDELL OF UTAH (5899 WEST RIVENDELL DRIVE)
- WEST JORDAN CARE CENTER (3350 WEST 7800 SOUTH)
- COPPER RIDGE HEALTH CARE (3706 WEST 9000 SOUTH)
- LIBERTY DIALYSIS WEST JORDAN (3823 W 9000 S STE D)
- ANGEL TOUCH HOME HEALTH CARE, INC (4705 ODIN LANE)
- COMMUNITY NURSING SERVICES (6271 SOUTH DIXIE DRIVE)
- HEARTWOOD HOME HEALTH (6671 SOUTH REDWOOD ROAD)
Heliports located in West Jordan:
Amtrak station near West Jordan:
Colleges/Universities in West Jordan:
- Broadview University-West Jordan (Full-time enrollment: 240; Location: 1902 W 7800 S; Private, for-profit; Website: www.broadviewuniversity.edu; Offers Master's degree)
- Taylor Andrews Academy of Hair Design-West Jordan (Full-time enrollment: 77; Location: 9052 South 1510 West; Private, for-profit; Website: www.taylorandrew.com/)
Colleges/universities with over 2000 students nearest to West Jordan:
- Salt Lake Community College (about 5 miles; Salt Lake City, UT; Full-time enrollment: 20,797)
- Stevens-Henager College-Murray (about 6 miles; Murray, UT; FT enrollment: 6,395)
- Western Governors University (about 8 miles; Salt Lake City, UT; FT enrollment: 31,481)
- Westminster College (about 11 miles; Salt Lake City, UT; FT enrollment: 2,870)
- Latter-day Saints Business College (about 13 miles; Salt Lake City, UT; FT enrollment: 2,059)
- University of Utah (about 13 miles; Salt Lake City, UT; FT enrollment: 28,454)
- Utah Valley University (about 27 miles; Orem, UT; FT enrollment: 24,403)
Biggest public high schools in West Jordan:
- COPPER HILLS HIGH (Students: 2,360, Location: 5445 W 7800 S, Grades: 10-12)
- WEST JORDAN HIGH (Students: 1,827, Location: 8136 S 2700 W, Grades: 10-12)
- SUNSET RIDGE MIDDLE (Students: 1,279, Location: 6881 W 8200 S, Grades: 7-9)
- WEST HILLS MIDDLE (Students: 1,157, Location: 8270 SO 5290 W, Grades: 7-9)
- WEST JORDAN MIDDLE (Students: 975, Location: 7550 S 1700 W, Grades: 7-9)
- JOEL P JENSEN MIDDLE (Students: 819, Location: 8105 S 3200 W, Grades: 7-9)
- SOUTH VALLEY SCHOOL (Students: 117, Location: 8400 S 1700 W, Grades: 9-12)
- ITINERIS EARLY COLLEGE HIGH (Location: 8714 ROY DEL CIRCLE, Grades: 10-12, Charter school)
- HAWTHORN ACADEMY (Location: 9062 S 2200 W, Grades: KG-9, Charter school)
- MOUNTAIN HEIGHTS ACADEMY (Location: 9067 S 1300 W SUITE 204, Grades: 7-12, Charter school)
Private high schools in West Jordan:
Biggest public elementary/middle schools in West Jordan:
- RIVERSIDE SCHOOL (Students: 1,978, Location: 8737 S 1220 W, Grades: KG-6)
- OAKCREST SCHOOL (Students: 1,292, Location: 8462 S HILLTOP OAK DR, Grades: KG-6)
- HAYDEN PEAK SCHOOL (Students: 1,194, Location: 5120 W HAYDEN PEAK DR, Grades: KG-6)
- MOUNTAIN SHADOWS SCHOOL (Students: 1,081, Location: 5255 W 7000 S, Grades: KG-6)
- JORDAN HILLS SCHOOL (Students: 1,025, Location: 8892 S 4800 W, Grades: KG-6)
- FALCON RIDGE SCHOOL (Students: 884, Location: 6111 W 7000 S, Grades: KG-6)
- COPPER CANYON SCHOOL (Students: 823, Location: 8917 S COPPERWOOD DR, Grades: KG-6)
- OQUIRRH SCHOOL (Students: 791, Location: 7165 S 3285 W, Grades: KG-6)
- MAJESTIC SCHOOL (Students: 755, Location: 7430 S 1700 W, Grades: KG-6)
- COLUMBIA SCHOOL (Students: 748, Location: 3505 W 7800 S, Grades: KG-6)
Private elementary/middle school in West Jordan:
Points of interest:
Notable locations in West Jordan: Mountain View Business Park (A), Jordan Industrial Center (B), Gardner Mountain View Golf Course (C), Bingham Canyon Industrial Park (D), Redwood Village (E), E J Garn Aviation Complex (F), West Jordan City Fire Department Station 53 (G), West Jordan City Fire Department Station 54 (H), West Jordan City Fire Department Station 55 (I), West Jordan City Fire Department Station 52 (J). Display/hide their locations on the map
Shopping Centers: West Jordan Mall Shopping Center (1), River Pointe Plaza Shopping Center (2), Redwood Village Shopping Center (3), Jordan Square Shopping Center (4), Jordan Landing Shopping Center (5), Gardner Historic Village Shopping Center (6), Briarwood Center Shopping Center (7). Display/hide their locations on the map
Churches in West Jordan include: Jordan Valley Baptist Church (A), Saint Joseph the Worker Catholic Church (B), Sonrise Baptist Church (C), Trinity Baptist Church (D), The Church of Jesus Christ of Latter Day Saints (E). Display/hide their locations on the map
Cemeteries: Wights Fort Cemetery (1), Redwood Memorial Estates (2), West Jordan City Cemetery (3). Display/hide their locations on the map
Streams, rivers, and creeks: Bingham Creek (A), Barneys Wash (B), Barneys Creek (C). Display/hide their locations on the map
Park in West Jordan: West Jordan Park (1). Display/hide its location on the map
Tourist attractions: Gasoline Alley (Amusement & Theme Parks; 3763 Center Park Drive) (1), Manhattan Pizza (Amusement & Theme Parks; 8021 South Redwood Road) (2), All-Star Lanes (Arcades & Amusements; 1776 W 7800 S) (3). Display/hide their approximate locations on the map
Hotels: Four Seasons Inc (9480 Bagley Park Road) (1), River Oaks Apartments & Suites (9035 South 1075 West) (2), All Seasons (7729.Ebrier Laurie In) (3). Display/hide their approximate locations on the map
Court: Utah State Government - Courts- Third District Courts- West Jordan Courthouse- Court Clerks Of (8080 Redwood Road) (1). Display/hide its approximate location on the map
Birthplace of: Gene Fullmer - Boxer, DaMarques Johnson - Martial artist, Jordan Halliday - Vegan, Martin Casaus - Professional wrestler, Rad Martinez - Martial artist, Jack Roberts - College football player (Southern Utah Thunderbirds), Sealver Siliga - Football player.
Drinking water stations with addresses in West Jordan and their reported violations in the past:
S AND W TRAILER PARK (Population served: 300, Groundwater):Past monitoring violations:
- Follow-up Or Routine LCR Tap M/R - In JAN-01-2002, Contaminant: Lead and Copper Rule. Follow-up actions: St Compliance achieved (JUL-15-2010)
- One regular monitoring violation
Drinking water stations with addresses in West Jordan that have no violations reported:
- JORDAN VALLEY WCD (Population served: 82,500, Primary Water Source Type: Surface water)
| This city: | 3.5 people |
| Utah: | 3.1 people |
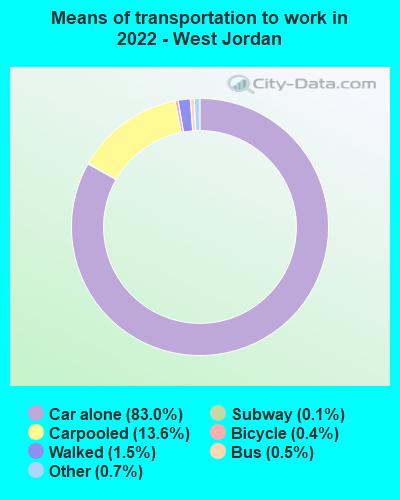
| This city: | 83.0% |
| Whole state: | 75.2% |
| This city: | 5.2% |
| Whole state: | 4.6% |
Likely homosexual households (counted as self-reported same-sex unmarried-partner households)
- Lesbian couples: 0.4% of all households
- Gay men: 0.3% of all households
People in group quarters in West Jordan in 2010:
- 211 people in residential treatment centers for juveniles (non-correctional)
- 162 people in nursing facilities/skilled-nursing facilities
- 40 people in other noninstitutional facilities
- 34 people in group homes intended for adults
- 21 people in workers' group living quarters and job corps centers
- 19 people in correctional facilities intended for juveniles
- 13 people in residential treatment centers for adults
- 2 people in local jails and other municipal confinement facilities
People in group quarters in West Jordan in 2000:
- 129 people in nursing homes
- 97 people in training schools for juvenile delinquents
- 90 people in homes for the mentally retarded
- 51 people in homes or halfway houses for drug/alcohol abuse
- 14 people in homes for the physically handicapped
- 10 people in residential treatment centers for emotionally disturbed children
- 4 people in religious group quarters
Banks with branches in West Jordan (2011 data):
- JPMorgan Chase Bank, National Association: West Jordan Branch, Jordan Landing Banking Center Branch, West Jordon City Hall Branch. Info updated 2011/11/10: Bank assets: $1,811,678.0 mil, Deposits: $1,190,738.0 mil, headquarters in Columbus, OH, positive income, International Specialization, 5577 total offices, Holding Company: Jpmorgan Chase & Co.
- Wells Fargo Bank, National Association: West Jordan Branch, Jordan Landing Branch, 90th South Branch. Info updated 2011/04/05: Bank assets: $1,161,490.0 mil, Deposits: $905,653.0 mil, headquarters in Sioux Falls, SD, positive income, 6395 total offices, Holding Company: Wells Fargo & Company
- U.S. Bank National Association: 90th South Smith's Branch, West Jordan Smith's Branch, West Jordan Branch. Info updated 2012/01/30: Bank assets: $330,470.8 mil, Deposits: $236,091.5 mil, headquarters in Cincinnati, OH, positive income, 3121 total offices, Holding Company: U.S. Bancorp
- Zions First National Bank: West Jordan/Copper Hills Office at 3913 West 9000 South, branch established on 1997/11/12; West Jordan Branch at 1835 West 7800 South, branch established on 1976/12/03. Info updated 2006/11/03: Bank assets: $17,531.3 mil, Deposits: $14,905.3 mil, headquarters in Salt Lake City, UT, positive income, Commercial Lending Specialization, 151 total offices, Holding Company: Zions Bancorporation
- KeyBank National Association: West Jordan Branch at 1435 W 9000 S, branch established on 1993/10/04; 70th South Keycenter Branch at 1607 7000 South, branch established on 2001/10/22. Info updated 2008/03/03: Bank assets: $86,198.8 mil, Deposits: $64,214.8 mil, headquarters in Cleveland, OH, positive income, Commercial Lending Specialization, 1067 total offices, Holding Company: Keycorp
For population 15 years and over in West Jordan:
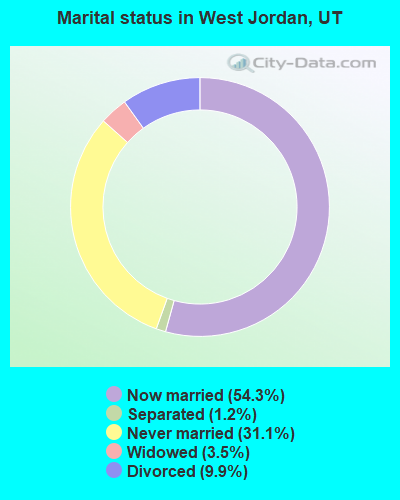
- Never married: 31.1%
- Now married: 54.3%
- Separated: 1.2%
- Widowed: 3.5%
- Divorced: 9.9%
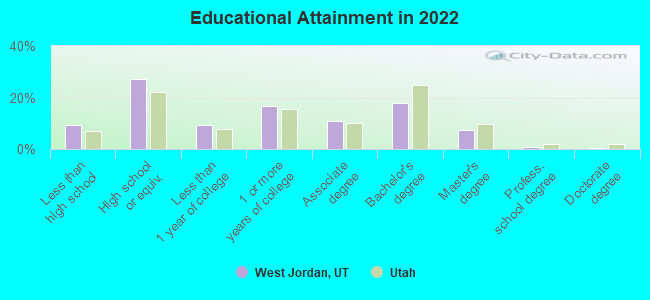
For population 25 years and over in West Jordan:
- High school or higher: 90.6%
- Bachelor's degree or higher: 26.7%
- Graduate or professional degree: 8.6%
- Unemployed: 4.2%
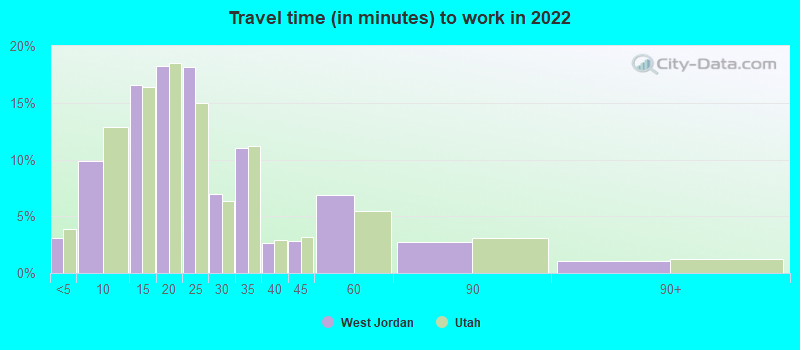
- Mean travel time to work (commute): 18.5 minutes
| Here: | 10.2 |
| Utah average: | 10.9 |
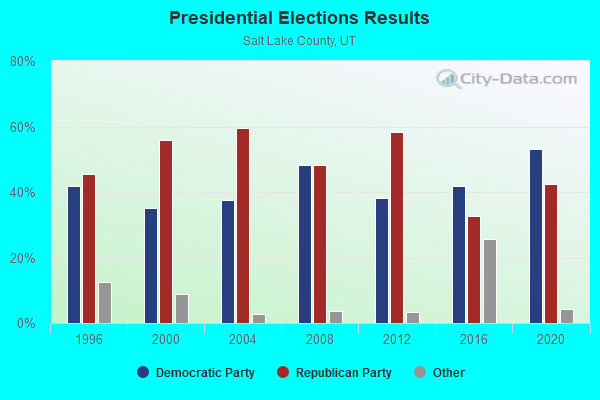
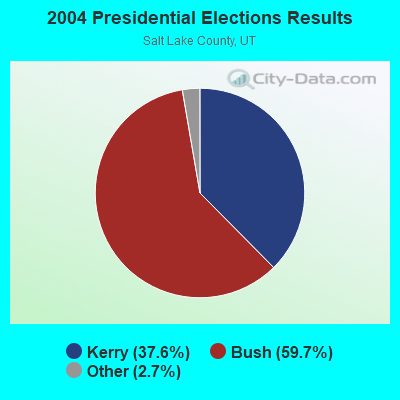
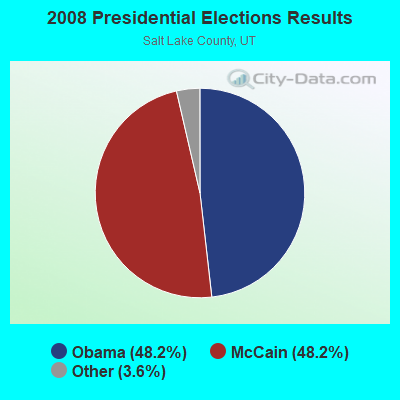

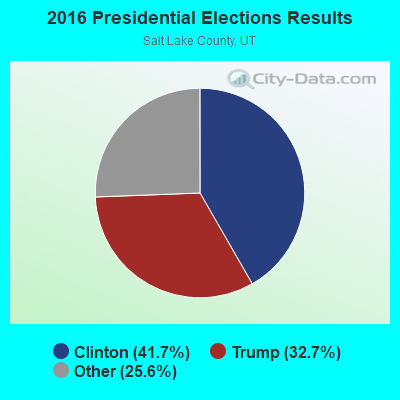
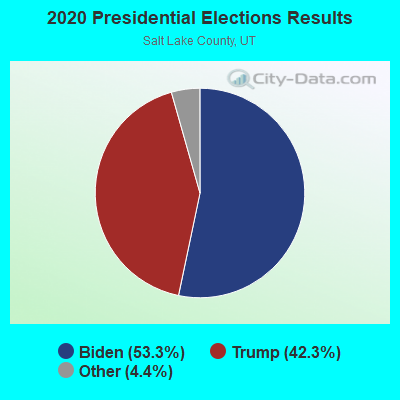
Graphs represent county-level data. Detailed 2008 Election Results
Religion statistics for West Jordan, UT (based on Salt Lake County data)
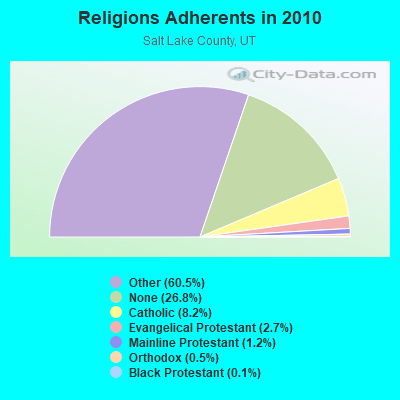
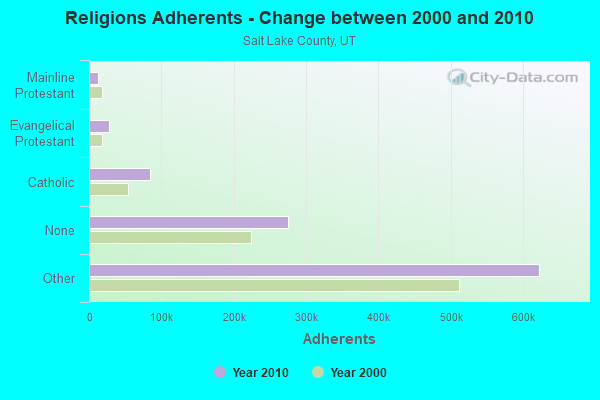
| Religion | Adherents | Congregations |
|---|---|---|
| Other | 622,807 | 1,452 |
| Catholic | 84,342 | 24 |
| Evangelical Protestant | 27,497 | 144 |
| Mainline Protestant | 12,789 | 38 |
| Orthodox | 5,352 | 7 |
| Black Protestant | 1,302 | 6 |
| None | 275,566 | - |
Food Environment Statistics:
| This county: | 1.45 / 10,000 pop. |
| Utah: | 1.37 / 10,000 pop. |
| Salt Lake County: | 0.16 / 10,000 pop. |
| State: | 0.18 / 10,000 pop. |
| Here: | 0.47 / 10,000 pop. |
| State: | 0.41 / 10,000 pop. |
| Salt Lake County: | 2.45 / 10,000 pop. |
| Utah: | 2.82 / 10,000 pop. |
| Salt Lake County: | 5.55 / 10,000 pop. |
| Utah: | 5.09 / 10,000 pop. |
| Salt Lake County: | 6.5% |
| Utah: | 6.3% |
| This county: | 22.7% |
| Utah: | 23.6% |
Health and Nutrition:
| West Jordan: | 47.9% |
| Utah: | 48.9% |
| West Jordan: | 46.4% |
| Utah: | 47.0% |
| West Jordan: | 28.6 |
| Utah: | 28.4 |
| Here: | 21.9% |
| State: | 21.0% |
| West Jordan: | 10.1% |
| Utah: | 10.3% |
| This city: | 6.8 |
| Utah: | 6.8 |
| West Jordan: | 31.8% |
| State: | 31.9% |
| This city: | 57.6% |
| State: | 57.4% |
| West Jordan: | 81.7% |
| Utah: | 80.1% |
More about Health and Nutrition of West Jordan, UT Residents
| Local government employment and payroll (March 2022) | |||||
| Function | Full-time employees | Monthly full-time payroll | Average yearly full-time wage | Part-time employees | Monthly part-time payroll |
|---|---|---|---|---|---|
| Police Protection - Officers | 123 | $812,492 | $79,268 | 0 | $0 |
| Firefighters | 90 | $603,256 | $80,434 | 0 | $0 |
| Other and Unallocable | 62 | $424,948 | $82,248 | 1 | $715 |
| Other Government Administration | 36 | $190,163 | $63,388 | 11 | $6,992 |
| Sewerage | 29 | $137,932 | $57,075 | 0 | $0 |
| Streets and Highways | 28 | $134,438 | $57,616 | 0 | $0 |
| Police - Other | 26 | $107,893 | $49,797 | 86 | $86,875 |
| Judicial and Legal | 25 | $171,592 | $82,364 | 1 | $3,547 |
| Water Supply | 22 | $99,550 | $54,300 | 0 | $0 |
| Parks and Recreation | 16 | $80,159 | $60,119 | 2 | $3,426 |
| Financial Administration | 12 | $80,403 | $80,403 | 1 | $128 |
| Totals for Government | 469 | $2,842,826 | $72,738 | 102 | $101,683 |
West Jordan government finances - Expenditure in 2021 (per resident):
- Construction - Parks and Recreation: $5,878,000 ($50.38)
Water Utilities: $5,482,000 ($46.99)
Housing and Community Development: $3,044,000 ($26.09)
General - Other: $2,779,000 ($23.82)
Regular Highways: $2,543,000 ($21.80)
Financial Administration: $1,857,000 ($15.92)
Sewerage: $1,572,000 ($13.47)
Central Staff Services: $201,000 ($1.72)
General Public Buildings: $18,000 ($0.15)
Solid Waste Management: $4,000 ($0.03)
Transit Utilities: $2,000 ($0.02)
- Current Operations - Police Protection: $16,595,000 ($142.25)
Water Utilities: $14,607,000 ($125.21)
Local Fire Protection: $10,280,000 ($88.12)
Sewerage: $9,947,000 ($85.26)
General - Other: $9,115,000 ($78.13)
Central Staff Services: $8,382,000 ($71.85)
Parks and Recreation: $7,191,000 ($61.64)
Solid Waste Management: $5,443,000 ($46.66)
Regular Highways: $3,518,000 ($30.15)
Judicial and Legal Services: $2,527,000 ($21.66)
Financial Administration: $2,384,000 ($20.43)
Transit Utilities: $2,133,000 ($18.28)
Housing and Community Development: $1,264,000 ($10.83)
Protective Inspection and Regulation - Other: $583,000 ($5.00)
- General - Interest on Debt: $2,885,000 ($24.73)
- Other Capital Outlay - General - Other: $302,000 ($2.59)
Police Protection: $105,000 ($0.90)
Parks and Recreation: $22,000 ($0.19)
Financial Administration: $15,000 ($0.13)
- Total Salaries and Wages: $61,474,000 ($526.93)
West Jordan government finances - Revenue in 2021 (per resident):
- Charges - Other: $63,009,000 ($540.09)
Sewerage: $1,161,000 ($9.95)
Miscellaneous Commercial Activities: $243,000 ($2.08)
- Federal Intergovernmental - General Local Government Support: $3,436,000 ($29.45)
Other: $1,864,000 ($15.98)
- Local Intergovernmental - General Local Government Support: $450,000 ($3.86)
- Miscellaneous - General Revenue - Other: $1,336,000 ($11.45)
Fines and Forfeits: $1,126,000 ($9.65)
Rents: $566,000 ($4.85)
Donations From Private Sources: $231,000 ($1.98)
Interest Earnings: $132,000 ($1.13)
Special Assessments: $97,000 ($0.83)
Sale of Property: $23,000 ($0.20)
- Revenue - Water Utilities: $1,639,000 ($14.05)
- State Intergovernmental - Highways: $3,365,000 ($28.84)
General Local Government Support: $12,000 ($0.10)
- Tax - General Sales and Gross Receipts: $23,487,000 ($201.32)
Property: $9,473,000 ($81.20)
Public Utilities Sales: $6,775,000 ($58.07)
Other License: $3,095,000 ($26.53)
Occupation and Business License - Other: $699,000 ($5.99)
Other Selective Sales: $45,000 ($0.39)
West Jordan government finances - Debt in 2021 (per resident):
- Long Term Debt - Beginning Outstanding - Unspecified Public Purpose: $72,126,000 ($618.24)
Outstanding Unspecified Public Purpose: $62,896,000 ($539.12)
Retired Unspecified Public Purpose: $16,510,000 ($141.52)
Issue, Unspecified Public Purpose: $7,280,000 ($62.40)
West Jordan government finances - Cash and Securities in 2021 (per resident):
- Bond Funds - Cash and Securities: $35,518,000 ($304.45)
- Other Funds - Cash and Securities: $76,726,000 ($657.67)
- Sinking Funds - Cash and Securities: $2,000 ($0.02)
6.29% of this county's 2021 resident taxpayers lived in other counties in 2020 ($73,956 average adjusted gross income)
| Here: | 6.29% |
| Utah average: | 7.95% |
0.01% of residents moved from foreign countries ($111 average AGI)
Salt Lake County: 0.01% Utah average: 0.02%
Top counties from which taxpayers relocated into this county between 2020 and 2021:
| from Utah County, UT | |
| from Davis County, UT | |
| from Weber County, UT |
6.63% of this county's 2020 resident taxpayers moved to other counties in 2021 ($71,033 average adjusted gross income)
| Here: | 6.63% |
| Utah average: | 7.39% |
0.01% of residents moved to foreign countries ($100 average AGI)
Salt Lake County: 0.01% Utah average: 0.02%
Top counties to which taxpayers relocated from this county between 2020 and 2021:
| to Utah County, UT | |
| to Davis County, UT | |
| to Tooele County, UT |
| Businesses in West Jordan, UT | ||||
| Name | Count | Name | Count | |
|---|---|---|---|---|
| 24 Hour Fitness | 1 | Little Caesars Pizza | 4 | |
| 7-Eleven | 4 | Lowe's | 1 | |
| AT&T | 3 | MasterBrand Cabinets | 7 | |
| Aeropostale | 1 | Maurices | 1 | |
| Applebee's | 1 | McDonald's | 5 | |
| Arby's | 2 | Men's Wearhouse | 1 | |
| AutoZone | 2 | New Balance | 2 | |
| Barnes & Noble | 1 | Nike | 6 | |
| Bath & Body Works | 1 | Office Depot | 1 | |
| Bed Bath & Beyond | 1 | OfficeMax | 1 | |
| Big O Tires | 1 | Old Navy | 1 | |
| Blockbuster | 2 | Panda Express | 2 | |
| Burger King | 2 | Papa John's Pizza | 1 | |
| Carl\s Jr. | 2 | Payless | 3 | |
| Chick-Fil-A | 1 | PetSmart | 1 | |
| Cold Stone Creamery | 1 | Pier 1 Imports | 1 | |
| Cricket Wireless | 2 | Pizza Hut | 1 | |
| Curves | 1 | RadioShack | 2 | |
| Dairy Queen | 1 | Rue21 | 1 | |
| Decora Cabinetry | 2 | SONIC Drive-In | 1 | |
| Discount Tire | 1 | Sam's Club | 1 | |
| Domino's Pizza | 1 | Sears | 3 | |
| DressBarn | 1 | Shoe Carnival | 1 | |
| Dressbarn | 1 | Sprint Nextel | 1 | |
| Famous Footwear | 1 | Starbucks | 2 | |
| FedEx | 7 | Subway | 4 | |
| Firestone Complete Auto Care | 1 | T-Mobile | 2 | |
| GNC | 2 | T.J.Maxx | 1 | |
| GameStop | 2 | Taco Bell | 2 | |
| H&R Block | 3 | Target | 2 | |
| Home Depot | 1 | The Room Place | 1 | |
| IHOP | 1 | U-Haul | 1 | |
| Jamba Juice | 1 | UPS | 5 | |
| Kmart | 1 | Verizon Wireless | 2 | |
| Kohl's | 1 | Village Inn | 1 | |
| Kroger | 4 | Walgreens | 1 | |
| La-Z-Boy | 1 | Walmart | 1 | |
| Lane Bryant | 1 | |||
Strongest AM radio stations in West Jordan:
- KLLB (1510 AM; daytime; 10 kW; WEST JORDAN, UT; Owner: UNITED SECURITY FINANCIAL, INC.)
- KIQN (1010 AM; 50 kW; TOOELE, UT)
- KTKK (630 AM; 10 kW; SANDY, UT; Owner: UNITED BROADCASTING COMPANY)
- KFNZ (1320 AM; 5 kW; SALT LAKE CITY, UT; Owner: CITADEL BROADCASTING COMPANY)
- KSL (1160 AM; 50 kW; SALT LAKE CITY, UT; Owner: BONNEVILLE HOLDING COMPANY)
- KBEE (860 AM; 10 kW; SALT LAKE CITY, UT; Owner: CITADEL BROADCASTING COMPANY)
- KKDS (1060 AM; 10 kW; SOUTH SALT LAKE, UT; Owner: HOLIDAY BROADCASTING COMPANY)
- KALL (700 AM; 50 kW; NORTH SALT LAKE CITY, UT; Owner: CITICASTERS LICENSES, L.P.)
- KWDZ (910 AM; 5 kW; SALT LAKE CITY, UT; Owner: ABC, INC.)
- KBJA (1640 AM; 10 kW; SANDY, UT; Owner: UNITED BROADCASTING COMPANY, INC)
- KMRI (1550 AM; 10 kW; WEST VALLEY CITY, UT; Owner: KMRI RADIO, LLC)
- KSOP (1370 AM; 5 kW; SOUTH SALT LAKE, UT; Owner: KSOP, INC.)
- KNRS (570 AM; 5 kW; SALT LAKE CITY, UT; Owner: CITICASTERS LICENSES, L.P.)
Strongest FM radio stations in West Jordan:
- KUER-FM (90.1 FM; SALT LAKE CITY, UT; Owner: UNIVERSITY OF UTAH)
- KBYU-FM (89.1 FM; PROVO, UT; Owner: BRIGHAM YOUNG UNIVERSITY)
- KODJ (94.1 FM; SALT LAKE CITY, UT; Owner: CITICASTERS LICENSES, L.P.)
- KURR (99.5 FM; BOUNTIFUL, UT; Owner: CITICASTERS LICENSES, L.P.)
- KBEE-FM (98.7 FM; SALT LAKE CITY, UT; Owner: CITADEL BROADCASTING COMPANY)
- KSOP-FM (104.3 FM; SALT LAKE CITY, UT; Owner: KSOP, INC.)
- K248AK (97.5 FM; DRAPER, UT; Owner: CITICASTERS LICENSES, L.P.)
- K272DP (102.3 FM; TOOELE, UT; Owner: FAMILY STATIONS, INC.)
- KRCL (90.9 FM; SALT LAKE CITY, UT; Owner: LISTENERS COMMUNITY RADIO OF UTAH)
- KBZN (97.9 FM; OGDEN, UT; Owner: CAPITOL BROADCASTING, INC.)
- KOSY-FM (106.5 FM; SPANISH FORK, UT; Owner: MERCURY BROADCASTING COMPANY, INC.)
- KRSP-FM (103.5 FM; SALT LAKE CITY, UT; Owner: SIMMONS-SLC, LS, LLC)
- KBER (101.1 FM; OGDEN, UT; Owner: CITADEL BROADCASTING COMPANY)
- KISN-FM (97.1 FM; SALT LAKE CITY, UT; Owner: CLEAR CHANNEL BROADCASTING LICENSES, INC.)
- KKAT (101.9 FM; OGDEN, UT; Owner: CITICASTERS LICENSES, L.P.)
- KSFI (100.3 FM; SALT LAKE CITY, UT; Owner: SIMMONS-SLC, LS, LLC)
- KUBL-FM (93.3 FM; SALT LAKE CITY, UT; Owner: CITADEL BROADCASTING COMPANY)
- KCPX (105.7 FM; CENTERVILLE, UT; Owner: MERCURY BROADCASTING COMPANY, INC.)
- KXRK (96.3 FM; PROVO, UT; Owner: SIMMONS-SLC, LS, LLC)
- KQMB (102.7 FM; MIDVALE, UT; Owner: SIMMONS-SLC, LS, LLC)
TV broadcast stations around West Jordan:
- KUTV (Channel 2; SALT LAKE CITY, UT; Owner: KUTV HOLDINGS, INC.)
- KULC (Channel 9; OGDEN, UT; Owner: UTAH STATE BOARD OF REGENTS)
- KUED (Channel 7; SALT LAKE CITY, UT; Owner: UNIVERSITY OF UTAH)
- KBYU-TV (Channel 11; PROVO, UT; Owner: BRIGHAM YOUNG UNIVERSITY)
- KEJT-LP (Channel 48; SALT LAKE CITY, UT; Owner: TELEMUNDO OF NORTHERN CALIFORNIA LICENSE CORP.)
- K59GS (Channel 59; SALT LAKE CITY, UT; Owner: ALPHA & OMEGA COMMUNICATIONS, LLC)
- KSL-TV (Channel 5; SALT LAKE CITY, UT; Owner: BONNEVILLE HOLDING COMPANY)
- KUWB (Channel 30; OGDEN, UT; Owner: ACME TV LICENSES OF UTAH, LLC)
- KTVX (Channel 4; SALT LAKE CITY, UT; Owner: CLEAR CHANNEL BROADCASTING LICENSES, INC.)
- KJZZ-TV (Channel 14; SALT LAKE CITY, UT; Owner: LARRY H. MILLER COMMUNICATIONS CORP.)
- KSTU (Channel 13; SALT LAKE CITY, UT; Owner: FOX TELEVISION STATIONS INC.)
- KTMW (Channel 20; SALT LAKE CITY, UT; Owner: ALPHA & OMEGA COMMUNICATIONS, LLC)
- KUBX-LP (Channel 58; SALT LAKE CITY, UT; Owner: EQUITY BROADCASTING CORPORATION)
- K66FN (Channel 66; SALT LAKE CITY, UT; Owner: AZTECA BROADCASTING CORPORATION)
- K68FY (Channel 68; SALT LAKE CITY, UT; Owner: PRICE BROADCASTING, INC.)
- KUCL-LP (Channel 26; SALT LAKE CITY, UT; Owner: CHRISTIAN LIFE BROADCASTING)
- K18FJ (Channel 18; SALT LAKE CITY, UT; Owner: NATIONAL MINORITY T.V., INC.)
- National Bridge Inventory (NBI) Statistics
- 40Number of bridges
- 236ft / 71.6mTotal length
- 1,093,258Total average daily traffic
- 198,790Total average daily truck traffic
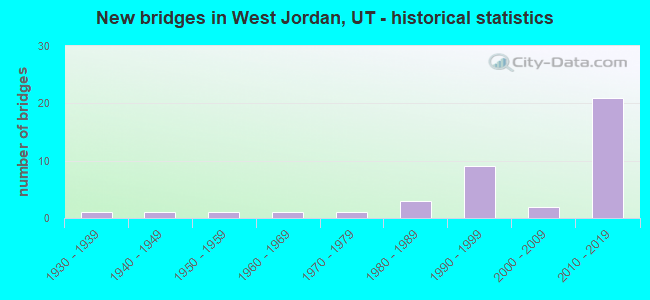
- New bridges - historical statistics
- 11930-1939
- 11940-1949
- 11950-1959
- 11960-1969
- 11970-1979
- 31980-1989
- 91990-1999
- 22000-2009
- 212010-2019
FCC Registered Antenna Towers: 200 (See the full list of FCC Registered Antenna Towers)
FCC Registered Broadcast Land Mobile Towers: 50 (See the full list of FCC Registered Broadcast Land Mobile Towers in West Jordan, UT)
FCC Registered Microwave Towers: 142 (See the full list of FCC Registered Microwave Towers in this town)
FCC Registered Paging Towers: 1 (See the full list of FCC Registered Paging Towers)
FCC Registered Maritime Coast & Aviation Ground Towers: 4 (See the full list of FCC Registered Maritime Coast & Aviation Ground Towers)
FCC Registered Amateur Radio Licenses: 786 (See the full list of FCC Registered Amateur Radio Licenses in West Jordan)
FAA Registered Aircraft Manufacturers and Dealers: 5 (See the full list of FAA Registered Manufacturers and Dealers in West Jordan)
FAA Registered Aircraft: 33 (See the full list of FAA Registered Aircraft)
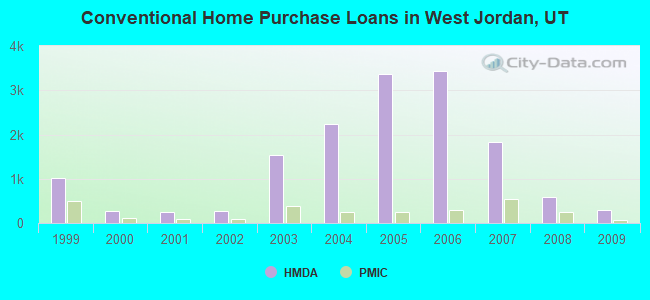
| Home Mortgage Disclosure Act Aggregated Statistics For Year 2009 (Based on 11 full and 7 partial tracts) | ||||||||||||
| A) FHA, FSA/RHS & VA Home Purchase Loans | B) Conventional Home Purchase Loans | C) Refinancings | D) Home Improvement Loans | F) Non-occupant Loans on < 5 Family Dwellings (A B C & D) | G) Loans On Manufactured Home Dwelling (A B C & D) | |||||||
|---|---|---|---|---|---|---|---|---|---|---|---|---|
| Number | Average Value | Number | Average Value | Number | Average Value | Number | Average Value | Number | Average Value | Number | Average Value | |
| LOANS ORIGINATED | 679 | $208,478 | 299 | $183,873 | 3,655 | $192,317 | 76 | $96,298 | 69 | $146,303 | 14 | $76,287 |
| APPLICATIONS APPROVED, NOT ACCEPTED | 48 | $219,482 | 33 | $181,796 | 412 | $204,528 | 19 | $51,934 | 12 | $140,981 | 4 | $55,168 |
| APPLICATIONS DENIED | 92 | $202,767 | 42 | $181,889 | 949 | $209,429 | 51 | $74,536 | 43 | $160,474 | 21 | $65,881 |
| APPLICATIONS WITHDRAWN | 62 | $214,143 | 37 | $188,152 | 600 | $210,400 | 30 | $108,961 | 11 | $164,696 | 2 | $100,860 |
| FILES CLOSED FOR INCOMPLETENESS | 12 | $195,416 | 5 | $198,124 | 121 | $210,639 | 9 | $150,286 | 5 | $272,398 | 0 | $0 |
Detailed mortgage data for all 18 tracts in West Jordan, UT
| Private Mortgage Insurance Companies Aggregated Statistics For Year 2009 (Based on 11 full and 7 partial tracts) | ||||||
| A) Conventional Home Purchase Loans | B) Refinancings | C) Non-occupant Loans on < 5 Family Dwellings (A & B) | ||||
|---|---|---|---|---|---|---|
| Number | Average Value | Number | Average Value | Number | Average Value | |
| LOANS ORIGINATED | 68 | $232,621 | 129 | $231,950 | 0 | $0 |
| APPLICATIONS APPROVED, NOT ACCEPTED | 34 | $237,905 | 68 | $239,604 | 2 | $194,920 |
| APPLICATIONS DENIED | 8 | $221,322 | 31 | $228,119 | 0 | $0 |
| APPLICATIONS WITHDRAWN | 5 | $194,062 | 21 | $220,121 | 0 | $0 |
| FILES CLOSED FOR INCOMPLETENESS | 0 | $0 | 3 | $282,743 | 0 | $0 |

2002 - 2018 National Fire Incident Reporting System (NFIRS) incidents
- Fire incident types reported to NFIRS in West Jordan, UT
- 1,37841.5%Structure Fires
- 1,20036.1%Outside Fires
- 44213.3%Mobile Property/Vehicle Fires
- 3049.1%Other
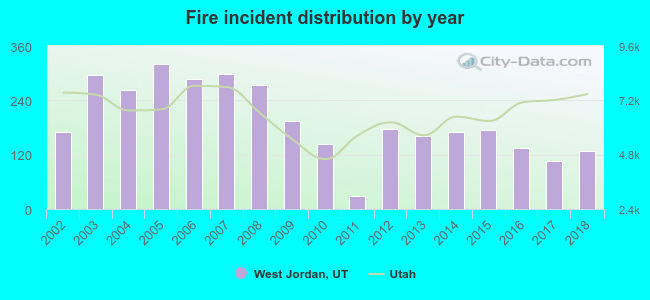 Based on the data from the years 2002 - 2018 the average number of fires per year is 196. The highest number of reported fire incidents - 320 took place in 2005, and the least - 28 in 2011. The data has a decreasing trend.
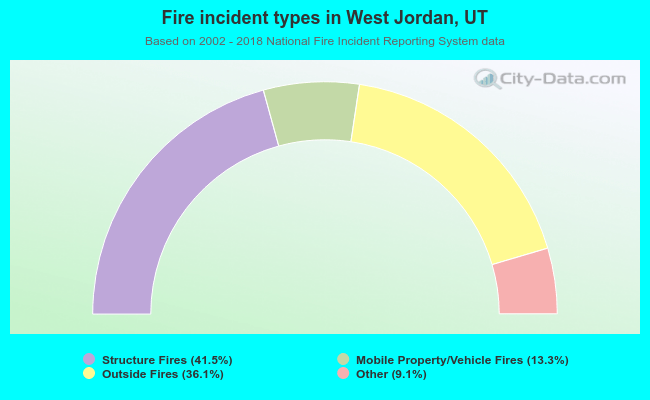 When looking into fire subcategories, the most incidents belonged to: Structure Fires (41.5%), and Outside Fires (36.1%).
Fire-safe hotels and motels in West Jordan, Utah:
- Hampton Inn And Suites West Jordan/Salt Lake City, 3923 W Ctr Park Dr, West Jordan, Utah 84084 , Phone: (801) 280-7300, Fax: (801) 280-1815
- Hotel Barons, JLA, LLC dba West Jordan My Place Hotel, 7424 S Campus View Dr, West jordan, Utah 84084 , Phone: (855) 200-5685, Fax: (801) 285-5207
- Residence Inn, 7558 S Plz Center Dr, West jordan, Utah 84084 , Phone: (801) 282-1800, Fax: (801) 282-1805
| Most common first names in West Jordan, UT among deceased individuals | ||
| Name | Count | Lived (average) |
|---|---|---|
| John | 54 | 69.1 years |
| Mary | 51 | 78.6 years |
| James | 49 | 71.5 years |
| William | 48 | 69.4 years |
| Robert | 45 | 68.1 years |
| George | 32 | 79.4 years |
| Richard | 31 | 59.5 years |
| Dorothy | 29 | 77.1 years |
| Joseph | 28 | 77.0 years |
| Kenneth | 26 | 69.2 years |
| Most common last names in West Jordan, UT among deceased individuals | ||
| Last name | Count | Lived (average) |
|---|---|---|
| Smith | 43 | 68.6 years |
| Johnson | 29 | 77.1 years |
| Peterson | 29 | 72.4 years |
| Anderson | 27 | 79.2 years |
| Jones | 26 | 75.9 years |
| Williams | 24 | 71.1 years |
| Christensen | 20 | 71.2 years |
| Gardner | 20 | 75.4 years |
| Martinez | 19 | 70.4 years |
| Brown | 19 | 69.5 years |
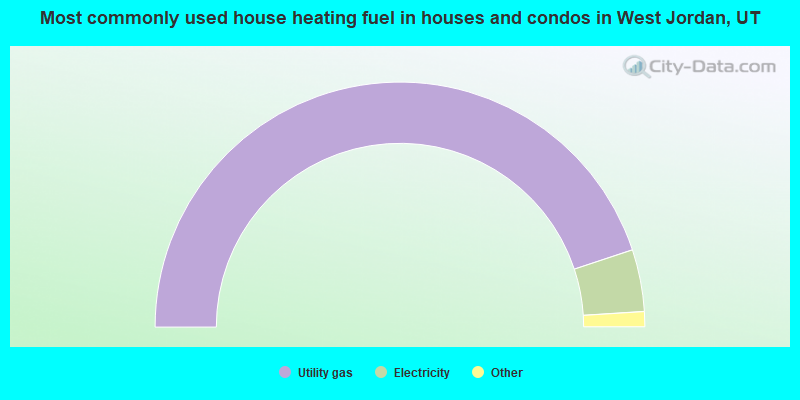
- 89.9%Utility gas
- 8.2%Electricity
- 1.2%Bottled, tank, or LP gas
- 0.5%Solar energy
- 0.1%Wood
- 0.1%No fuel used
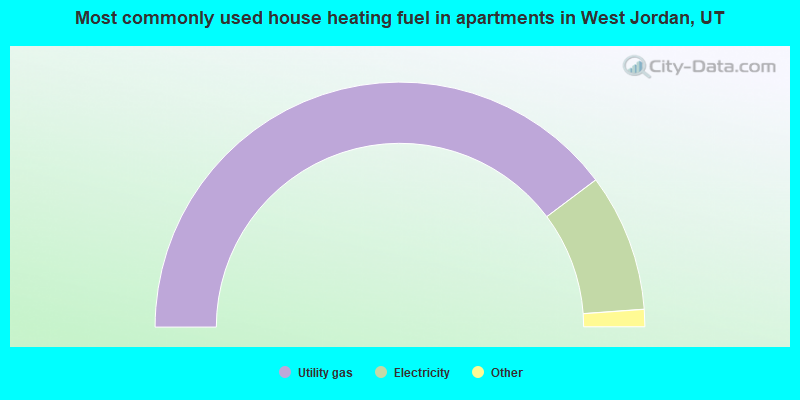
- 79.5%Utility gas
- 18.2%Electricity
- 1.3%Bottled, tank, or LP gas
- 0.6%No fuel used
- 0.2%Wood
- 0.1%Other fuel
West Jordan compared to Utah state average:
- Unemployed percentage significantly below state average.
- Black race population percentage above state average.
- Hispanic race population percentage above state average.
- Foreign-born population percentage significantly above state average.
- House age below state average.
West Jordan on our top lists:
- #9 on the list of "Top 101 cities with the smallest household incomes disparities (population 50,000+)"
- #9 on the list of "Top 101 cities with the smallest percentage of high school students in private schools (3,000+ students)"
- #10 on the list of "Top 101 cities with the most cars per house, population 50,000+"
- #10 on the list of "Top 101 cities with the highest percentage of family households, population 100,000+"
- #13 on the list of "Top 101 cities with the least people having professional degrees (population 50,000+)"
- #14 on the list of "Top 101 cities with the highest ratio of rapes to murders between 2002 and 2012 (population 50,000+)"
- #29 on the list of "Top 101 cities with the least people having Doctorate degrees (population 50,000+)"
- #34 on the list of "Top 101 cities with the lowest number of police officers per 1000 residents (population 50,000+)"
- #37 on the list of "Top 100 cities with biggest houses (pop. 50,000+)"
- #38 on the list of "Top 101 cities with the smallest percentage of elementary and middle school students in private schools (5,000+ students)"
- #39 on the list of "Top 101 cities with the smallest house values disparities (population 50,000+)"
- #39 on the list of "Top 100 highest located cities (pop. 50,000+)"
- #39 on the list of "Top 100 low-educated but high-earning cities (pop. 50,000+)"
- #43 on the list of "Top 101 cities with largest percentage of females in industries: transportation and warehousing (population 50,000+)"
- #44 on the list of "Top 101 cities with largest percentage of females in occupations: production occupations (population 50,000+)"
- #46 on the list of "Top 100 cities with youngest residents (pop. 50,000+)"
- #47 on the list of "Top 101 cities with the lowest minimum monthly morning or afternoon humidity (population 50,000+)"
- #54 on the list of "Top 101 cities with the largest percentage population increase from 2000 (population 50,000+)"
- #59 on the list of "Top 101 cities with the least people below 50% of the poverty level (population 50,000+)"
- #61 on the list of "Top 101 cities with largest percentage of females in occupations: material moving occupations (population 50,000+)"
- #1 on the list of "Top 101 counties with the most Other adherents"
- #1 on the list of "Top 101 counties with the most Other congregations"
- #4 on the list of "Top 101 counties with the lowest percentage of residents that smoked 100+ cigarettes in their lives"
- #11 on the list of "Top 101 counties with the highest Nitrogen Dioxide air pollution readings in 2012 (ppm)"
- #14 on the list of "Top 101 counties with the highest number of births per 1000 residents 2007-2013"

|
|
Total of 784 patent applications in 2008-2024.