When considering a relocation or visit to either Anaheim or Santa Ana in California, it's key to compare several factors that directly implicate the quality of life and experience. The two cities, though neighboring, bear distinct characteristics and offerings in terms of crime and safety, weather, cost of living, education, work and economy, infrastructure, industries and occupations, major employers, real estate, neighborhoods, transportation, taxes, culture, sports, geographical conditions, and health care.
Distance between
Anaheim, CA and
Santa Ana, CA : 6.6 miles
Anaheim's population is larger by 12%. Its population has grown by 17,926 people (5.5%) since 2000. The population of Santa Ana has decreased by 28,536 people (8.4%) during that time.
In terms of crime and safety, it's essential to note that both cities experience different crime rates. Anaheim has a lower crime rate compared to Santa Ana. However, relative to California or national averages, it can be argued that both cities experience high levels of crime. Therefore, safety should remain a priority for those choosing to relocate or visit either of these locations.
City-data.com crime index counts serious crimes and violent crime more heavily. It adjusts for the number of visitors and daily workers commuting into cities. (higher means more crime, U.S. average = 301.1)
City-data.com crime index counts serious crimes and violent crime more heavily. It adjusts for the number of visitors and daily workers commuting into cities. (higher means more crime, U.S. average = 301.1)
Sex Offenders
According to our data, there are 366 registered sex offenders living in Anaheim and 415 registered sex offenders living in . The ratio of residents to sex offenders in Anaheim is 959 to 1; the ratio in Santa Ana is 805 to 1. The number of registered sex offenders compared to the number of residents in Anaheim is near to than in Santa Ana.
Cost of Living
Comparatively, Santa Ana is slightly more affordable than Anaheim. This holds concerning costs of housing, groceries, health care, utilities, and transportation. Many of these factors tie directly to income levels, where Santa Ana's median income is less than Anaheim's.
Income Tax
California maintains a progressive income tax system applicable to both cities. The tax rate ranges from 1% on the lowest earners to 13.30% on income over $1 million.
Property Tax
Property tax rates for Anaheim and Santa Ana are similar, averaging around 0.76% of a property's assessed fair market value, which is less than the national average of 1.070%.
Sales Tax
Anaheim imposes a sales tax of 7.75%, which is lower than the Santa Ana's rate of 9.25%. The basic rate in California is 6.00%, with counties and cities allowed to add their own rates.
Income
Type
Anaheim
Santa Ana
Estimated median household income
$81,747
$80,265
Estimated per capita income
$32,827
$26,691
Cost of living index (U.S. average is 100)
88.5
88.6
If you make $50,000 in Anaheim, you will have to make $50,056 in Santa Ana to maintain the same standard of living.
Geographical Conditions
Anaheim is located in a flat plain region in Orange county, with Santa Ana situated in the Santa Ana Valley. Both cities are relatively flat, with close proximity to the Pacific Ocean and the Santa Ana Mountains.
Educationally, both cities have a diverse set of public and private schools. Anaheim does command an edge in higher education, with access to higher learning institutions like Anaheim University and North Orange County Community College District. Santa Ana, in contrast, has Santa Ana College and a satellite campus for California State University, Fullerton.
Santa Ana is the county seat and holds numerous county, state, and federal jobs in its economy. Conversely, Anaheim's economy is primarily influenced by tourism, with the Disney Resort serving as the city's largest employer. Both cities have a large service sector industry providing numerous job opportunities.
Biggest Employers
Disney takes the top spot as Anaheim's largest employer, followed by the Anaheim Regional Medical Center and Anaheim Union High School District. In Santa Ana, the largest employers are the County of Orange, Ingram Micro, and Rancho Santiago Community College District.
There were 85 building permits issued in Anaheim in 2012 (44 more than in 2011) compared to 231 building permits issued in Santa Ana in 2012 (189 more than in 2011).
Weather
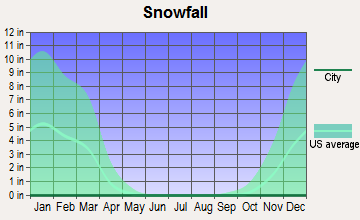
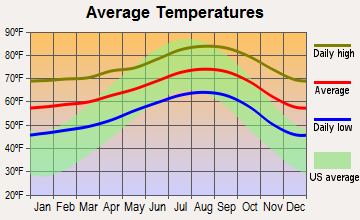
The weather in Anaheim and Santa Ana is almost identical due to their close proximity. Both cities enjoy a Mediterranean climate, characterized by mild, damp winters and dry, hot summers. The average high temperature is around 84°F in summer and around 68°F in winter. Climate is not a substantial differentiator between the two locales.
Weather and climate
Type
Anaheim
Santa Ana
Temperature - Average
64.9°F
65.4°F
Humidity - Average morning or afternoon humidity
69.6%
69.9%
Humidity - Differences between morning and afternoon humidity
25.9%
26.2%
Humidity - Maximum monthly morning or afternoon humidity
77.9%
78.3%
Humidity - Minimum monthly morning or afternoon humidity
52%
52%
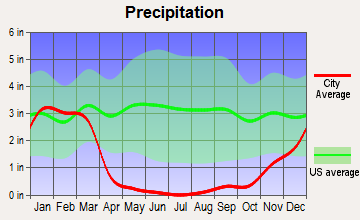
Precipitation - Yearly average
12 in
13.8 in
Snowfall - Yearly average
0 in
0 in
Clouds - Number of days clear of clouds
26.6%
26.5%
Sunshine amount - Average
78.4%
78.4%
Sunshine amount - Differences during a year
22%
21.9%
Sunshine amount - Maximum monthly
84.9%
84.8%
Sunshine amount - Minimum monthly
63%
62.9%
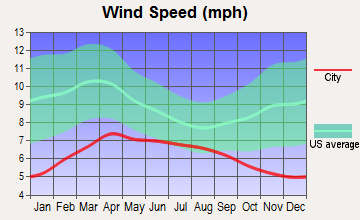
Wind speed - Average
5.7 mph
5.9 mph
Average climate in Anaheim, California
Average climate in Santa Ana, California
Air pollution
Type
AQI
CO
NO2
OZONE
PB
PM10
PM25
SO2
Year
Anaheim
Santa Ana
Anaheim
Santa Ana
Anaheim
Santa Ana
Anaheim
Santa Ana
Anaheim
Santa Ana
Anaheim
Santa Ana
Anaheim
Santa Ana
Anaheim
Santa Ana
2018
139
124
0.36
0.34
13.7
14.2
26.8
27.0
0.007
N/A
27.5
27.5
12.1
12.3
0.7
0.7
2017
145
129
0.50
0.35
14.8
13.9
26.7
29.1
0.007
N/A
26.7
26.7
13.5
13.6
0.6
0.5
2016
132
107
0.57
0.35
14.5
12.6
26.3
29.2
0.007
N/A
24.1
24.1
12.9
12.7
0.3
0.2
2015
142
128
0.45
0.32
14.7
13.4
26.0
29.6
0.007
N/A
25.0
25.0
14.8
14.7
0.3
0.2
2014
138
127
0.40
0.29
15.0
13.2
26.7
28.6
0.008
N/A
26.7
26.7
16.2
15.9
0.5
0.4
2013
138
123
0.47
0.34
14.8
13.9
25.3
27.6
0.005
0.003
28.3
28.8
13.9
14.0
0.5
0.3
2012
142
115
0.46
0.31
14.5
12.9
25.0
26.7
0.005
0.004
27.0
27.5
14.7
14.5
0.2
0.1
2011
138
118
0.42
0.31
15.9
14.8
26.7
27.1
0.007
0.006
27.4
27.5
16.0
15.9
0.8
0.7
2010
130
107
0.44
0.34
16.7
14.4
25.8
26.5
0.009
0.011
23.5
23.5
14.9
14.6
0.6
0.6
2009
151
133
0.41
0.35
18.0
16.0
26.0
27.7
0.010
0.010
24.4
24.4
15.4
14.9
1.1
1.1
2008
156
138
0.38
0.38
20.3
17.1
26.7
28.2
0.010
0.010
30.2
30.1
18.9
21.6
1.1
1.1
2007
135
121
0.38
0.36
19.5
17.0
26.2
27.1
0.012
0.012
N/A
N/A
N/A
N/A
0.8
0.8
2006
128
120
0.43
0.40
19.1
17.7
26.3
26.6
0.008
0.007
N/A
N/A
N/A
N/A
1.3
1.3
2005
128
119
0.45
0.40
20.7
18.2
31.3
28.3
0.013
0.013
N/A
N/A
N/A
N/A
1.3
1.3
2004
134
128
0.53
0.50
19.9
19.4
37.1
31.2
0.015
0.014
N/A
N/A
N/A
N/A
1.6
1.6
2003
143
139
0.69
0.64
23.7
22.3
23.8
28.3
0.025
0.029
N/A
N/A
N/A
N/A
1.1
1.1
2002
134
122
0.77
0.66
24.1
22.3
21.8
25.1
0.019
0.019
N/A
N/A
N/A
N/A
2.1
1.7
2001
143
120
0.94
0.76
28.4
22.6
24.5
25.1
0.035
0.036
N/A
N/A
N/A
N/A
1.7
1.5
2000
152
127
0.80
0.80
29.4
25.7
23.0
23.7
0.030
0.028
N/A
N/A
N/A
N/A
1.9
1.9
Natural disasters
Type
Anaheim
Santa Ana
Tornado activity compared to U.S. average
19.3%
19.1%
Earthquake activity compared to U.S. average
7,039.7%
6,931.4%
Natural disasters compared to U.S. average
32%
32%
Transportation
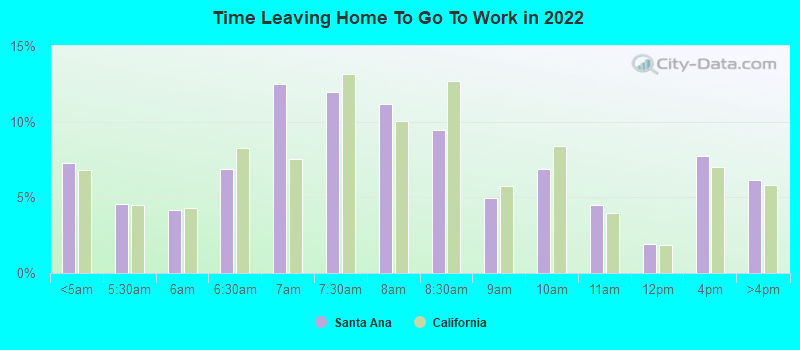
Both cities have comprehensive transportation systems. Anaheim maintains the Anaheim Regional Transportation Intermodal Center providing rail and bus connections. Santa Ana also supports Metrolink service and several bus lines. Traffic congestion is a common challenge in both cities, particularly during peak commuting hours.
Transport
Type
Anaheim
Santa Ana
Amtrak stations
1
1
Amtrak stations nearby
3
3
FAA registered aircraft
136
150
FAA registered aircraft manufacturers and dealers
3
15
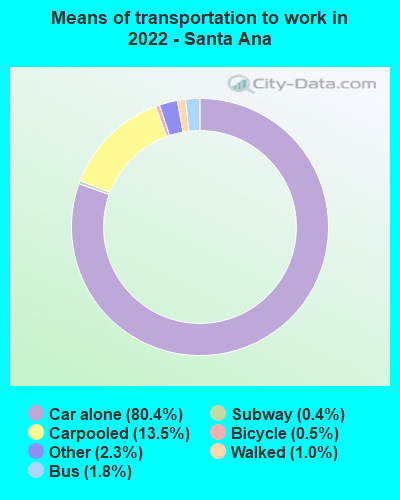
Means of transportation to work
Type
Anaheim
Santa Ana
Bicycle
1%
0.2%
Bus
0.9%
0.9%
Carpooled
10.8%
12%
Car alone
83.4%
83.6%
Motorcycle
0.2%
0.1%
Railroad
0.2%
0.1%
Subway
0.3%
0.1%
Walked
1.6%
1.4%
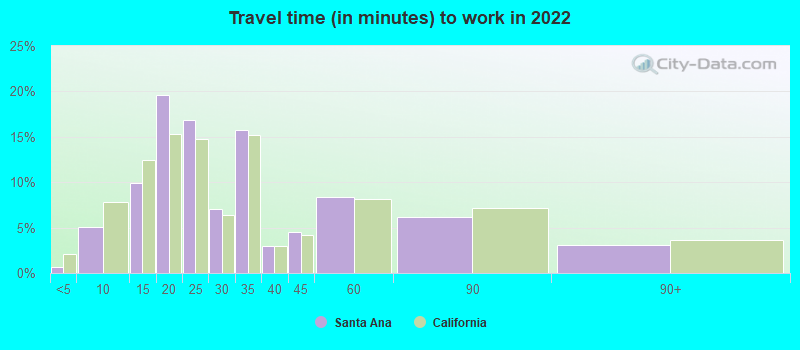
Average travel time to work
Type
Anaheim
Santa Ana
Average
30.8 min
30.4 min
Other means
28.1 min
25.5 min
Public transportation
47.8 min
48.1 min
Private vehicle occupancy
Type
Anaheim
Santa Ana
Average
1.2
1.2
Drove alone
85.3%
84.6%
In 2 person carpool
11.2%
11.7%
In 3 person carpool
1.8%
2.7%
In 4 person carpool
0.8%
0.6%
In 5-6 person carpool
0.9%
0.4%
How many people usually rode to work in the car, truck or van.
Real Estate
Real estate in Anaheim typically comes at a higher price than in Santa Ana, attributed to Anaheim's robust tourism industry and Disneyland. However, both cities offer diverse real estate options including apartments, single-family homes, and luxury properties.
Neighborhoods
Anaheim has more than 50 diverse neighborhoods, each with its own character, including the historic Anaheim Colony, and the resort district. Santa Ana, too, offers a variety of neighborhoods, notable are the historic Downtown, the arts district, and South Coast Metro area.
Houses and residents
Type
Anaheim
Santa Ana
Houses
110,319
80,604
Average household size (people)
3.4
4.4
Median year apartment built
1975
1974
Median year house/condo built
1970
1962
Length of stay in the house since moving in
14.8 years
15.9 years
Houses occupied
105,608 (95.7%)
78,674 (97.6%)
Houses occupied by owners
51,684 (48.9%)
35,317 (44.9%)
Houses occupied by renters
53,924 (51.1%)
43,357 (55.1%)
Median rent asked for vacant for-rent units
$2,111
$1,407
Median monthly housing costs
$1,910
$1,836
Median price asked for vacant for-sale houses and condos
$1,256,069
$976,981
Estimated median house or condo value
$688,400
$623,000
Median numbers of rooms
4.7
4.5
Median number of rooms in apartments
3.6
3.9
Median number of rooms in houses and condos
6.1
5.6
Median house price - detached houses
$859,592
$724,856
Median house price - in 2-unit structures
$742,035
$512,474
Median house price - in 3-to-4-unit structures
$546,946
$351,406
Median house price - in 5 or more unit structures
$553,561
$406,926
Median house price - mobile homes
$114,904
$125,004
Median house price - Townhouses or other attached units
$619,623
$492,339
Median house price - All housing units
$782,600
$648,392
Median house age
48
53
Renting percentage
51.5%
52.5%
Housing density (houses/condos per square mile)
2,254.1
2,969.6
House value disparities
20.2%
21.7%
Household income disparities
43.6%
40.4%
Median household income for houses/condes with a mortgage
$125,169
$120,617
Median household income for apartments without a mortgage
$86,779
$74,449
Housing units without a mortgage
374 (1%)
318 (1.2%)
Housing units with both a second mortgage and home equity loan
2,222 (6%)
1,175 (4.6%)
Housing units with a mortgage
36,875 (99%)
25,378 (98.8%)
Housing units with a home equity loan
0 (0%)
23 (0.1%)
Housing units with a second mortgage
2,794 (7.5%)
1,438 (5.6%)
House/condo owner moved in on average (years ago)
14
14
House/condo renter moved in on average (years ago)
4
5
Housing units lacking complete kitchen facilities
4.5%
3.3%
Housing units in structures
Housing units in structures
Anaheim
Santa Ana
One, detached
42.7%
46.4%
One, attached
8.3%
5.8%
Two
2.3%
3.6%
3 or 4
7.6%
7.3%
5 to 9
6.8%
5.7%
10 to 19
5.5%
8.8%
20 to 49
6.8%
6.3%
50 or more
17.2%
11.0%
Mobile homes
2.6%
4.9%
Boats, RVs, vans, etc.
0.1%
0.0%
Median real estate property taxes paid for housing units
Self-employed workers in own not incorporated business
11,077
13,591
State government workers
5,046
3,716
Unpaid family workers
65
355
Industries and Occupations
Anaheim's primary industry is tourism, driven by Disneyland Resort. Other significant sectors include manufacturing and retail. Santa Ana's economy is more diversified, with sectors like public administration, professional services, health care, and manufacturing playing prominent roles.
Health diagnosing and treating practitioners and other technical occupations
4.2%
3.0%
Building and grounds cleaning and maintenance occupations
4.2%
8.7%
Health technologists and technicians
3.6%
1.6%
Community and social service occupations
2.2%
1.5%
Material moving occupations
2.0%
4.3%
Computer and mathematical occupations
1.4%
2.0%
Arts, design, entertainment, sports, and media occupations
1.3%
1.3%
Life, physical, and social science occupations
1.3%
0.2%
Legal occupations
0.8%
1.5%
Transportation occupations
0.8%
1.6%
Farming, fishing, and forestry occupations
0.1%
1.7%
Health Care
Both cities have robust healthcare systems. Anaheim has several medical facilities, including Anaheim Regional Medical Center. Santa Ana also offers an array of healthcare options, with the Orange County Global Medical Center serving as a major facility.
While both cities have robust infrastructure to support their operations and growth, Anaheim is considered slightly more advanced given its predominant tourism-driven economy. Both cities provide vital facilities including utilities, road networks, parks, schools, hospitals, and more.
Infrastructure
Type
Anaheim
Santa Ana
Hospitals
22
9
TV stations
6
2
Bank branches located here
46
31
Bank institutions located here
19
13
Main business address for public companies
7
15
Drinking water stations with no reported violations in the past
1
0
Drinking water stations with reported violations in the past
HMDA - Conventional home purchase loans - Applications denied
Year
Anaheim
Santa Ana
1999
914
955
2000
679
834
2001
632
725
2002
735
933
2003
1,047
1,222
2004
1,456
1,657
2005
1,965
2,302
2006
1,999
2,615
2007
1,230
1,456
2008
599
694
2009
378
399
Culture and Food
Both cities are rich in culture and food. Anaheim boasts a diverse gastronomic scene thanks to its tourism industry, with international cuisine and famed breweries. Santa Ana, with a large Hispanic population, is known for its vibrant Latin cuisine and lively arts scene.
Sports Teams
Anaheim is home to two professional sports teams, the MLB's Angels, and the NHL's Ducks. Santa Ana doesn't host any professional sports teams, but residents can support having several major teams nearby LA.


 Anaheim, CA
 Santa Ana, CA