Austin, TX, and Santa Clarita, CA are two dynamic cities each boasting unique characters, diverse culture, prosperous economy and quality lifestyle. Santa Clarita, found in California's beautiful SoCal region, offers a mild Mediterranean climate and high living standards, but at a significantly higher cost. On the other hand, Austin, the booming capital of Texas, provides a vibrant city life with an ever-growing tech industry at lower living expenses, but also higher temperatures. Both cities, however, have their own individual charms that allure people to visit, live or work.
Distance between
Austin, TX and
Santa Clarita, CA : 1,242.0 miles
Austin's population is larger by 329%. Its population has grown by 307,615 people (46.9%) since 2000. The population of Santa Clarita has grown by 73,505 people (48.7%) during that time.
Both Austin, TX and Santa Clarita, CA are relatively safe cities for their respective sizes. However, Santa Clarita ranks significantly lower in crime rate compared to Austin. Austin’s crime rate, while higher than the national average, is in line with many other major cities in the US. Santa Clarita, known for its family-friendly environment, enjoys one of the lowest crime rates for cities of its size in California. However, as with any city, safety can significantly depend on neighborhoods, vigilance, and local authorities' efforts.
City-data.com crime index counts serious crimes and violent crime more heavily. It adjusts for the number of visitors and daily workers commuting into cities. (higher means more crime, U.S. average = 301.1)
City-data.com crime index counts serious crimes and violent crime more heavily. It adjusts for the number of visitors and daily workers commuting into cities. (higher means more crime, U.S. average = 301.1)
Sex Offenders
According to our data, there are 1,411 registered sex offenders living in Austin and 15 registered sex offenders living in . The ratio of residents to sex offenders in Austin is 672 to 1; the ratio in Santa Clarita is 12,131 to 1. The number of registered sex offenders compared to the number of residents is much larger in Austin than that in Santa Clarita.
Cost of Living
The cost of living is one of the major differences between these two cities. Santa Clarita is quite expensive compared to Austin. From housing to groceries, residents of Santa Clarita can expect to pay considerably more. Austin, however, while experiencing a recent surge in living costs due to its growing popularity, is still cheaper than many other major US cities, and significantly cheaper than Santa Clarita.
Income Tax
Texas boasts no state income tax, a fact many Austin residents appreciate. This is contrastingly different in Santa Clarita, a part of California, where residents pay one of the highest state income taxes in the US with rates up to 13.3%.
Property Tax
Property taxes in both states are high. Average property tax rate in Austin is about 1.83% of assessed home value, while in Santa Clarita it is around 1.16%. These can vary significantly based on specific neighborhoods and home values.
Sales Tax
Austin residents bear a combined state and local sales tax rate of 8.25%, while Santa Clarita’s combined sales tax rat is 9.5%. Both rates are, however, subject to purchases made and specific local tax rules.
Income
Type
Austin
Santa Clarita
Estimated median household income
$79,542
$109,336
Estimated per capita income
$53,937
$44,697
Cost of living index (U.S. average is 100)
96.4
134.5
If you make $50,000 in Austin, you will have to make $69,761 in Santa Clarita to maintain the same standard of living.
Geographical Conditions
Austin is situated in Hill Country, offering beautiful views, and has numerous waterways like the Colorado River flowing through it. Santa Clarita is set in Santa Clarita Valley with stunning mountain views, proximity to beaches and easy access to the hiking trails in Angeles National Forest.
Both Austin and Santa Clarita value education significantly. Austin is home to several renowned universities such as the University of Texas at Austin, making it a hub of higher education. It also boasts well-rated public and private schools. Similarly, Santa Clarita is served by excellent public and private schools and several colleges. For education seekers, both cities have a lot to offer.
Austin’s booming tech industry, dubbed the “Silicon Hills”, has turned it into a hotspot for job seekers and entrepreneurs. Top companies like Dell and IBM have headquarters or regional offices there. Santa Clarita too has a growing economy that focuses on entertainment, healthcare, and professional services, with Six Flags Magic Mountain being a significant employer.
Biggest Employers
The State of Texas and the University of Texas are the largest employers in Austin, followed by major tech companies such as Dell. In Santa Clarita, the healthcare sector and Six Flags provide the highest number of jobs, followed by retail corporations.
There were 4,180 building permits issued in Austin in 2012 (2467 more than in 2011) compared to 364 building permits issued in Santa Clarita in 2012 (284 more than in 2011).
In Austin (Travis County), 60.2% voted for Democrats and 36.2% for Republicans in 2012 Presidential Election. In Santa Clarita (Los Angeles County), 69.7% voted for Democrats and 27.8% for Republicans.
Elections
Type
Democrats
Republicans
Other
Year
Austin
Santa Clarita
Austin
Santa Clarita
Austin
Santa Clarita
2020
71.7%
71.0%
26.5%
26.9%
1.8%
2.1%
2016
65.8%
72.0%
27.2%
22.5%
7.0%
5.5%
2012
60.2%
69.7%
36.2%
27.8%
3.6%
2.4%
2008
63.8%
69.2%
34.4%
28.8%
1.8%
1.9%
2004
56.1%
63.3%
42.1%
35.7%
1.8%
1.0%
2000
41.7%
63.6%
47.0%
32.4%
11.3%
4.0%
1996
52.4%
59.3%
40.0%
31.0%
7.7%
9.7%
Breakdown of population affiliated with a religious congregation
Type
Adherents
Congregations
Religion
Austin
Santa Clarita
Austin
Santa Clarita
CATHOLIC CHURCH
17.3%
36.1%
4.5%
4.7%
SOUTHERN BAPTIST CONVENTION
8.0%
1.0%
22.8%
9.0%
EPISCOPAL CHURCH
1.4%
0.4%
2.8%
1.4%
MUSLIM ESTIMATE
1.2%
0.7%
0.7%
1.0%
EVANGELICAL LUTHERAN CHURCH IN AMERICA
1.0%
0.2%
2.5%
1.9%
LUTHERAN CHURCH
0.9%
0.2%
2.1%
1.6%
SEVENTH DAY ADVENTIST CHURCH
0.2%
0.5%
1.0%
2.4%
AMERICAN BAPTIST CHURCHES IN THE USA
0.1%
0.5%
0.1%
3.1%
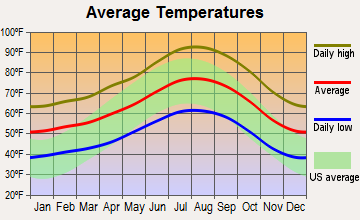
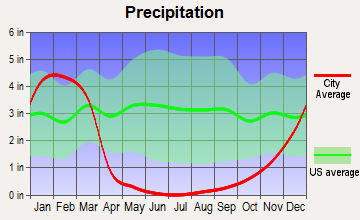
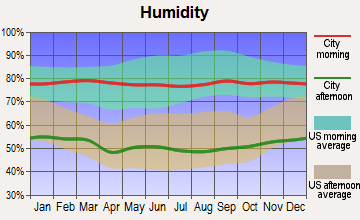
Weather
If you're a fan of the sun, both Austin and Santa Clarita have plenty to offer. However, Austin can get quite hot in the summer with temperatures well into the 90s, and also experiences considerably more rainfall compared to Santa Clarita. In contrast, Santa Clarita enjoys the typical Mediterranean climate - pleasant, warm summers and mild, wet winters. Both cities receive low snowfall, with Austin seeing occasional, minor snow and Santa Clarita virtually none.
Weather and climate
Type
Austin
Santa Clarita
Temperature - Average
68.5°F
63.2°F
Humidity - Average morning or afternoon humidity
75.2%
63.6%
Humidity - Differences between morning and afternoon humidity
40%
18.3%
Humidity - Maximum monthly morning or afternoon humidity
89%
68.9%
Humidity - Minimum monthly morning or afternoon humidity
49%
50.5%
Precipitation - Yearly average
33.7 in
18.2 in
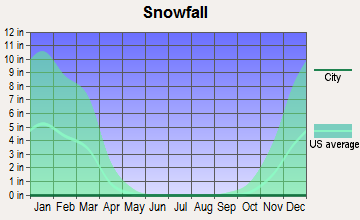
Snowfall - Yearly average
1.4 in
0 in
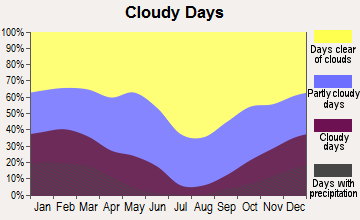
Clouds - Number of days clear of clouds
19.3%
27.8%
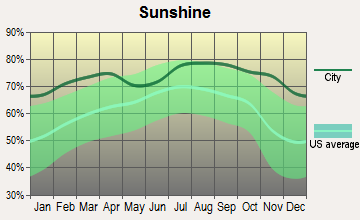
Sunshine amount - Average
63.3%
78.4%
Sunshine amount - Differences during a year
22%
21.9%
Sunshine amount - Maximum monthly
72%
84.9%
Sunshine amount - Minimum monthly
50%
63%
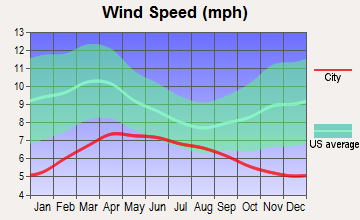
Wind speed - Average
7.2 mph
3 mph
Average climate in Austin, Texas
Average climate in Santa Clarita, California
Air pollution
Type
AQI
CO
NO2
OZONE
PB
PM10
PM25
SO2
Year
Austin
Santa Clarita
Austin
Santa Clarita
Austin
Santa Clarita
Austin
Santa Clarita
Santa Clarita
Santa Clarita
Austin
Santa Clarita
Austin
Santa Clarita
2018
76
129
N/A
0.24
4.9
10.9
26.7
31.8
0.002
N/A
24.4
N/A
8.7
10.4
0.2
N/A
2017
76
129
N/A
0.26
4.6
10.5
29.7
33.6
0.002
N/A
25.0
N/A
8.3
10.3
0.3
N/A
2016
71
117
N/A
0.21
4.2
10.1
29.5
33.3
0.002
N/A
23.8
N/A
8.2
9.4
0.2
N/A
2015
78
123
N/A
0.19
4.4
11.8
28.9
33.8
0.001
N/A
21.8
N/A
8.6
8.7
0.3
N/A
2014
74
133
N/A
0.22
5.2
12.8
28.3
34.7
0.003
N/A
25.5
N/A
8.7
10.2
0.5
N/A
2013
78
134
0.09
0.22
5.5
14.4
29.5
35.1
0.004
N/A
24.8
N/A
8.6
9.8
0.5
0.3
2012
86
138
0.13
0.22
5.5
13.6
30.1
33.3
0.004
N/A
24.6
N/A
8.6
10.1
N/A
0.5
2011
83
135
0.11
0.23
2.6
13.6
33.0
32.0
0.006
N/A
24.3
N/A
9.1
12.5
N/A
0.5
2010
77
124
0.05
0.20
3.2
14.3
29.4
29.6
0.005
N/A
21.5
N/A
8.8
13.7
N/A
0.8
2009
76
147
0.05
0.25
2.6
15.1
29.7
31.2
0.006
N/A
N/A
N/A
9.0
14.5
N/A
0.5
2008
81
143
0.12
0.28
3.2
16.5
30.7
32.6
N/A
N/A
31.7
N/A
9.7
18.6
N/A
0.8
2007
82
114
0.12
0.33
3.1
19.7
27.1
29.8
0.008
N/A
N/A
N/A
9.8
N/A
N/A
1.0
2006
89
120
0.14
0.23
3.8
18.4
31.3
31.4
N/A
N/A
N/A
N/A
10.0
N/A
0.2
0.6
2005
92
127
0.15
0.32
4.4
19.2
29.0
29.8
N/A
N/A
N/A
N/A
10.7
N/A
0.2
1.6
2004
74
134
0.16
0.42
3.3
20.4
26.8
31.6
N/A
N/A
N/A
N/A
N/A
N/A
N/A
2.4
2003
85
142
0.26
0.48
4.2
21.2
28.9
32.2
N/A
N/A
N/A
N/A
N/A
N/A
0.1
1.3
2002
83
153
0.33
0.58
3.9
19.4
27.2
31.5
0.010
N/A
N/A
N/A
N/A
N/A
N/A
2.0
2001
83
130
0.31
0.72
4.2
22.4
25.5
27.3
0.011
N/A
N/A
N/A
N/A
N/A
N/A
0.7
2000
86
140
0.28
0.79
4.7
24.5
27.8
26.6
0.012
N/A
N/A
N/A
N/A
N/A
N/A
0.5
Natural disasters
Type
Austin
Santa Clarita
Tornado activity compared to U.S. average
137.9%
12.3%
Earthquake activity compared to U.S. average
80.4%
7,347.5%
Natural disasters compared to U.S. average
29%
57%
Transportation
Public transportation and commuting in Austin largely depend on buses and cars, with developments in light rail underway. Santa Clarita offers a more comprehensive public transport system with local and commuter buses, along with easy connections to the Metrolink train service for LA commutes.
Transport
Type
Austin
Santa Clarita
Amtrak stations
1
1
Amtrak stations nearby
1
3
FAA registered aircraft
911
43
FAA registered aircraft manufacturers and dealers
21
0
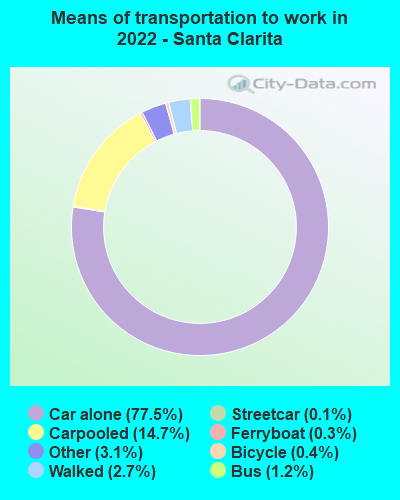
Means of transportation to work
Type
Austin
Santa Clarita
Bicycle
0.8%
0.2%
Bus
1.5%
0.4%
Carpooled
7.9%
12.2%
Car alone
85.9%
82.9%
Motorcycle
0.3%
0.2%
Railroad
0%
0.9%
Taxicab
0.1%
0%
Walked
2%
1.9%
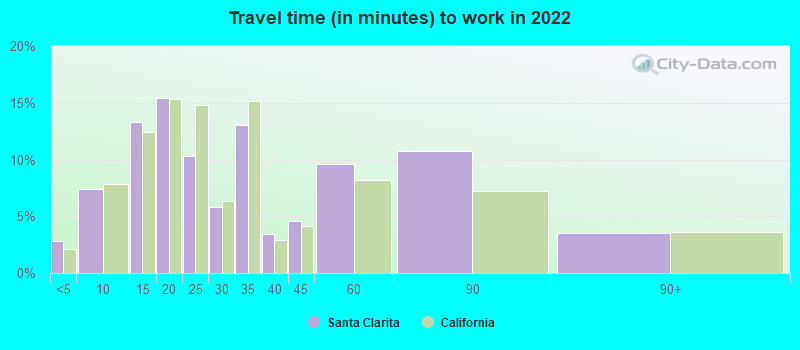
Average travel time to work
Type
Austin
Santa Clarita
Average
29.9 min
28.9 min
Other means
22.7 min
34 min
Public transportation
37.9 min
54.6 min
Private vehicle occupancy
Type
Austin
Santa Clarita
Average
1.1
1.2
Drove alone
91.2%
88.4%
In 2 person carpool
6.3%
8.4%
In 3 person carpool
1.7%
2.1%
In 4 person carpool
0.6%
0.6%
In 5-6 person carpool
0.1%
0.5%
In 7+ person carpool
0.2%
0.1%
How many people usually rode to work in the car, truck or van.
Real Estate
The real estate markets in both cities are booming. Austin real estate, while rising in price, is still quite affordable compared to other major US cities. In contrast, Santa Clarita, like many California cities, has a high real estate cost but also offers great amenities and living standards.
Neighborhoods
Austin is known for its diverse neighborhoods with each having a distinctive culture like the hipster vibes of South Congress or the upscale Tarrytown. Santa Clarita, composed of distinctive communities like Valencia and Canyon Country, offers residential areas with a relatively quieter small-town feel.
Houses and residents
Type
Austin
Santa Clarita
Houses
469,156
74,788
Average household size (people)
2.4
2.9
Median year apartment built
1997
1988
Median year house/condo built
1988
1986
Length of stay in the house since moving in
12.1 years
12.3 years
Houses occupied
449,399 (95.8%)
73,509 (98.3%)
Houses occupied by owners
196,458 (43.7%)
53,424 (72.7%)
Houses occupied by renters
252,941 (56.3%)
20,085 (27.3%)
Median rent asked for vacant for-rent units
$1,286
$3,305
Median monthly housing costs
$1,521
$2,295
Median price asked for vacant for-sale houses and condos
$549,769
$765,753
Estimated median house or condo value
$482,900
$656,000
Median numbers of rooms
4.4
5.7
Median number of rooms in apartments
3.4
4.2
Median number of rooms in houses and condos
6
6.2
Median house price - detached houses
$595,996
$690,437
Median house price - in 2-unit structures
$393,984
$412,937
Median house price - in 3-to-4-unit structures
$262,826
$422,554
Median house price - in 5 or more unit structures
$576,111
$360,428
Median house price - mobile homes
$56,102
$150,665
Median house price - Townhouses or other attached units
$459,657
$468,632
Median house price - All housing units
$571,154
$619,198
Median house age
28
35
Renting percentage
54.9%
28.9%
Housing density (houses/condos per square mile)
1,865.3
1,563.7
House value disparities
28.4%
20.2%
Household income disparities
44.8%
39.5%
Median household income for houses/condes with a mortgage
$141,177
$141,857
Median household income for apartments without a mortgage
$86,430
$86,356
Housing units without a mortgage
1,799 (1.3%)
398 (1%)
Housing units with both a second mortgage and home equity loan
6,421 (4.8%)
2,546 (6.2%)
Housing units with a mortgage
132,628 (98.7%)
40,480 (99%)
Housing units with a home equity loan
206 (0.2%)
298 (0.7%)
Housing units with a second mortgage
8,515 (6.3%)
3,012 (7.4%)
House/condo owner moved in on average (years ago)
9
10
House/condo renter moved in on average (years ago)
1
2
Housing units lacking complete kitchen facilities
0.9%
1.5%
Housing units lacking complete plumbing facilities
0.6%
0.9%
Housing units in structures
Housing units in structures
Austin
Santa Clarita
One, detached
43.1%
61.5%
One, attached
5.2%
10.6%
Two
2.4%
0.6%
3 or 4
4.1%
4.4%
5 to 9
7.2%
7.0%
10 to 19
11.0%
4.4%
20 to 49
8.9%
2.7%
50 or more
17.2%
6.1%
Mobile homes
1.0%
2.5%
Boats, RVs, vans, etc.
0.0%
0.1%
Median real estate property taxes paid for housing units
Self-employed workers in own not incorporated business
38,777
8,028
State government workers
46,229
3,883
Unpaid family workers
102
332
Industries and Occupations
In Austin, the top industries are tech, entertainment, and government, owing to its status as the state capital. The most prevalent occupations are tied to these industries. Santa Clarita, on the other hand, is heavily influenced by the entertainment industry, with a large number of residents employed by Six Flags, film studios, and other entertainment venues.
Both Austin and Santa Clarita offer top-notch healthcare facilities. Austin is home to the highly esteemed Dell Medical School and numerous top-rated hospitals. Santa Clarita is served by excellent healthcare systems like Henry Mayo Newhall Hospital, and various specialty health centers.
Health (county statistics)
Type
Austin
Santa Clarita
General health status score of residents in this county from 1 (poor) to 5 (excellent)
Austin has seen significant infrastructure development due to the rapid population growth and urbanization, with ongoing improvements in transport, utilities, and public services. Santa Clarita also enjoys well-maintained and planned infrastructure that supports its semi-urban lifestyle. Both cities invest heavily in promoting green and sustainable living.
Infrastructure
Type
Austin
Santa Clarita
TV stations
20
10
Bank branches located here
264
16
Bank institutions located here
43
9
Drinking water stations with no reported violations in the past
46
0
Drinking water stations with reported violations in the past
HMDA - Conventional home purchase loans - Applications denied
Year
Austin
Santa Clarita
1999
4,733
529
2000
2,950
141
2001
2,038
89
2002
1,772
98
2003
2,213
847
2004
2,458
1,148
2005
3,121
1,513
2006
3,367
1,281
2007
2,560
1,053
2008
1,747
461
2009
1,067
209
Culture and Food
Austin is renowned for its live music scene, festivals like SXSW, and eclectic food scene featuring Tex-Mex and BBQ. Santa Clarita, with influence from the greater LA region, has a diverse food scene from beach food to gourmet cuisine and is close to numerous cultural attractions.
Sports Teams
Austin is home to Austin FC (MLS) and the Texas Longhorns. While Santa Clarita does not have any major sports teams, it has easy access to LA's Lakers (NBA), Dodgers (MLB), Rams (NFL), and Kings (NHL).


 Austin, TX
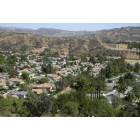
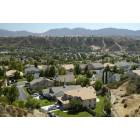
 Santa Clarita, CA