Comparing Charlotte, North Carolina and Hialeah, Florida entails contrasting lifestyles, economic conditions, and cultural nuances. The two cities offer different experiences, from the urban lifestyle in a large banking hub like Charlotte to the culturally vibrant and largely Latino community of Hialeah. The following comparison should help potential relocators and tourists decide which city might better suit them.
Distance between
Charlotte, NC and
Hialeah, FL : 646.5 miles
Charlotte's population is larger by 299%. Its population has grown by 338,881 people (62.7%) since 2000. The population of Hialeah has decreased by 5,929 people (2.6%) during that time.
Crime rates in both cities are above the national average, with Charlotte somewhat worse than Hialeah. However, both cities have made strides towards improving public safety, employing community policing and other initiatives. It's advisable for tourists and potential residents to research specific areas in both cities for clearer information.
Cost of Living
Overall, the cost of living in Charlotte is slightly higher than in Hialeah. Although housing in both cities is below the national average, Charlotte's housing is more expensive. Groceries, utilities, and transportation costs also tend to be higher in Charlotte.
Income Tax
Hialeah residents don't pay state income tax, as Florida doesn't levy one, whereas Charlotte residents pay state income tax with rates ranging from 5.25% to 7.75% depending on income.
Property Tax
Property tax rates vary in both cities, but generally, rates in Hialeah are lower. In Charlotte, the average property tax rate is 0.83%, while Hialeah sees lower rates of about 0.67%.
Sales Tax
Sales tax is higher in Hialeah at 7% (Florida state law) compared to Charlotte's 7.25% (North Carolina state law).
Income
Type
Charlotte
Hialeah
Estimated median household income
$70,869
$46,674
Estimated per capita income
$44,593
$21,712
Cost of living index (U.S. average is 100)
93.2
107
If you make $50,000 in Charlotte, you will have to make $57,403 in Hialeah to maintain the same standard of living.
Geographical Conditions
Charlotte, a city in Piedmont, is characterized by rolling hills and lush greenery. It's a few hours drive from both the mountains and the coast. Hialeah sits on a larger Atlantic coastal plain, boasting proximity to beautiful beaches and the Everglades.
Charlotte has a robust education system with reputable schools, many belonging to the Charlotte-Mecklenburg School system. It also houses several universities, including the University of North Carolina at Charlotte. Hialeah's education system is part of the Miami-Dade County Public Schools, the fourth-largest school district in the United States, and it has several colleges and technical institutes.
Charlotte is known as the second largest banking hub in the US, hosting headquarters of Bank of America and East Coast operations of Wells Fargo. Other than finance, Charlotte's economy includes sectors like energy, healthcare, and retail. Hialeah's economy is diverse, with industries ranging from retail to healthcare, education, and manufacturing.
Biggest Employers
Charlotte's biggest employers are Atrium Health, Wells Fargo, Bank of America, and American Airlines. In Hialeah, the largest employers are big-box stores, healthcare providers such as Palmetto General Hospital, and the city's education system.
In Charlotte (Mecklenburg County), 60.8% voted for Democrats and 38.3% for Republicans in 2012 Presidential Election. In Hialeah (Miami-Dade County), 61.8% voted for Democrats and 38.0% for Republicans.
Elections
Type
Democrats
Republicans
Other
Year
Charlotte
Hialeah
Charlotte
Hialeah
Charlotte
Hialeah
2020
66.8%
53.5%
31.6%
46.2%
1.6%
0.3%
2016
62.3%
63.4%
32.9%
33.9%
4.8%
2.7%
2012
60.8%
61.8%
38.3%
38.0%
0.9%
0.3%
2008
62.0%
58.1%
37.6%
41.9%
0.5%
0.0%
2004
51.7%
53.0%
48.0%
46.7%
0.3%
0.3%
2000
48.4%
52.7%
51.1%
46.4%
0.5%
0.9%
1996
48.6%
57.3%
45.9%
37.9%
5.5%
4.8%
Breakdown of population affiliated with a religious congregation
Type
Adherents
Congregations
Religion
Charlotte
Hialeah
Charlotte
Hialeah
SOUTHERN BAPTIST CONVENTION
9.0%
3.2%
19.0%
21.8%
CATHOLIC CHURCH
8.5%
21.8%
1.8%
4.5%
AMERICAN BAPTIST CHURCHES IN THE USA
2.3%
0.0%
1.1%
0.2%
EPISCOPAL CHURCH
1.2%
0.5%
1.3%
2.1%
EVANGELICAL LUTHERAN CHURCH IN AMERICA
0.9%
0.2%
1.8%
1.3%
PRESBYTERIAN CHURCH IN AMERICA
0.6%
0.1%
1.9%
1.0%
SEVENTH DAY ADVENTIST CHURCH
0.5%
1.1%
1.5%
4.3%
MUSLIM ESTIMATE
0.3%
0.9%
1.2%
1.0%
Weather
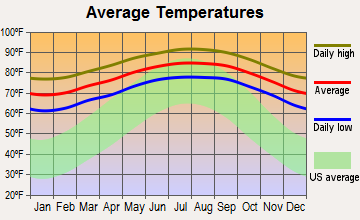
Weather is noticeably different between these two cities. Those who prefer hot summers and mild winters may favor Hialeah, which has a tropical monsoon climate. Charlotte, on the other hand, experiences all four seasons with largely hot and humid summers and mild to slightly cold winters.
Weather and climate
Type
Charlotte
Hialeah
Temperature - Average
61°F
77.9°F
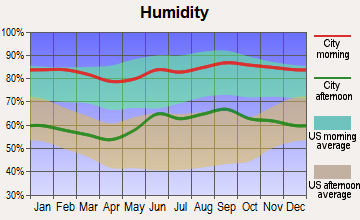
Humidity - Average morning or afternoon humidity
72.3%
77.3%
Humidity - Differences between morning and afternoon humidity
41%
31%
Humidity - Maximum monthly morning or afternoon humidity
87%
86%
Humidity - Minimum monthly morning or afternoon humidity
46%
55%
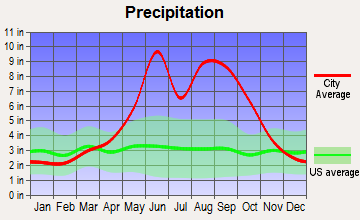
Precipitation - Yearly average
44.5 in
63.5 in
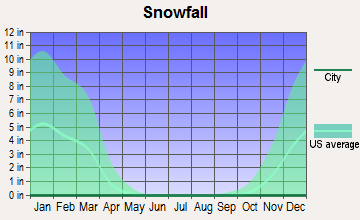
Snowfall - Yearly average
10.2 in
0 in
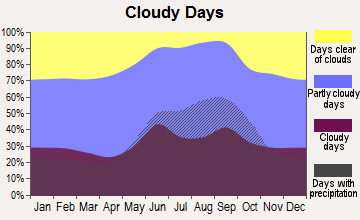
Clouds - Number of days clear of clouds
18.1%
12.3%
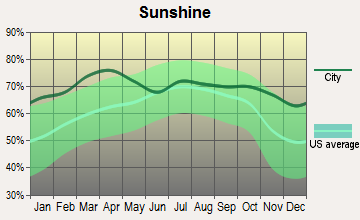
Sunshine amount - Average
69.8%
76.8%
Sunshine amount - Differences during a year
14%
16%
Sunshine amount - Maximum monthly
70%
79%
Sunshine amount - Minimum monthly
56%
63%
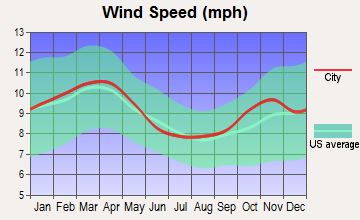
Wind speed - Average
6.9 mph
9.1 mph
Average climate in Charlotte, North Carolina
Average climate in Hialeah, Florida
Air pollution
Type
AQI
CO
NO2
OZONE
PB
PM10
PM25
SO2
Year
Charlotte
Hialeah
Charlotte
Hialeah
Charlotte
Hialeah
Charlotte
Hialeah
Charlotte
Charlotte
Hialeah
Charlotte
Hialeah
Charlotte
Hialeah
2018
75
72
0.24
0.24
6.3
5.4
27.8
27.8
N/A
N/A
15.5
15.5
8.2
8.1
0.2
0.3
2017
77
80
0.25
0.24
7.0
6.1
28.0
27.4
N/A
N/A
16.3
N/A
8.8
8.4
0.2
0.3
2016
82
68
0.25
0.25
7.6
5.5
28.7
29.3
N/A
N/A
N/A
N/A
8.4
7.1
0.2
0.0
2015
76
62
0.25
0.22
8.1
3.4
27.6
26.2
N/A
N/A
N/A
N/A
8.6
8.2
0.2
0.0
2014
76
71
0.26
0.23
8.5
4.6
26.3
27.7
N/A
N/A
N/A
N/A
9.3
8.0
0.3
0.0
2013
71
64
0.29
0.18
8.4
3.4
25.5
27.3
N/A
N/A
N/A
N/A
8.6
7.9
0.3
0.0
2012
95
71
0.28
0.19
8.7
3.4
27.3
28.6
N/A
N/A
N/A
N/A
9.7
8.7
0.3
0.0
2011
94
72
0.34
0.12
10.1
3.7
28.9
28.3
N/A
N/A
N/A
N/A
11.2
8.7
0.6
0.0
2010
97
77
0.33
0.33
11.8
5.0
28.0
29.4
N/A
N/A
N/A
N/A
11.6
9.1
1.0
0.0
2009
82
67
0.30
0.52
10.0
4.2
25.4
28.8
N/A
N/A
N/A
N/A
11.1
9.1
0.9
0.0
2008
102
95
0.32
0.59
11.2
4.2
27.6
31.0
N/A
N/A
N/A
18.0
13.0
10.5
2.1
0.0
2007
108
94
0.37
0.65
13.9
5.4
29.1
33.5
0.001
N/A
N/A
21.9
14.5
10.5
3.0
0.0
2006
107
87
0.44
0.57
13.9
6.4
27.3
34.6
0.000
N/A
N/A
22.3
14.8
10.2
3.3
0.0
2005
109
75
0.53
0.52
14.6
6.5
30.6
31.8
0.000
N/A
N/A
18.8
15.2
8.7
2.7
0.0
2004
89
69
0.53
1.03
14.6
6.4
28.9
31.3
0.001
N/A
N/A
19.5
N/A
8.5
2.8
0.3
2003
85
70
0.57
1.11
15.6
7.2
27.6
29.5
0.003
N/A
N/A
N/A
N/A
8.4
3.0
0.4
2002
103
75
0.63
0.73
15.3
6.5
32.6
30.2
0.003
N/A
N/A
N/A
N/A
8.4
2.7
2.1
2001
108
84
0.72
0.74
17.5
6.8
32.3
30.2
0.005
N/A
N/A
N/A
N/A
9.1
3.9
1.5
2000
107
66
0.79
0.81
18.0
7.3
32.6
31.1
0.014
N/A
N/A
N/A
N/A
N/A
4.4
1.3
Natural disasters
Type
Charlotte
Hialeah
Tornado activity compared to U.S. average
111.5%
66.7%
Earthquake activity compared to U.S. average
79%
1.1%
Natural disasters compared to U.S. average
9%
10%
Transportation
Public transportation in Charlotte is provided by Charlotte Area Transit System (CATS), including buses and a light rail system. Hialeah is served by the Miami-Dade Transit system, offering comprehensive bus routes and connection to Miami's Metrorail.
Transport
Type
Charlotte
Hialeah
Amtrak stations
1
0
Amtrak stations nearby
2
3
FAA registered aircraft
439
47
FAA registered aircraft manufacturers and dealers
12
2
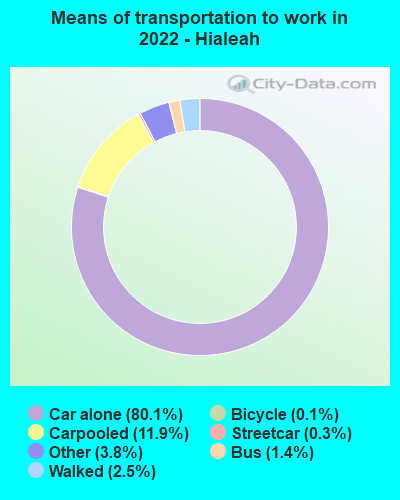
Means of transportation to work
Type
Charlotte
Hialeah
Bicycle
0.1%
0.1%
Bus
1.2%
1.5%
Carpooled
8.7%
10.2%
Car alone
86.2%
85%
Railroad
0.4%
0.1%
Subway
0%
0.2%
Taxicab
0.2%
0%
Walked
1.5%
1.2%
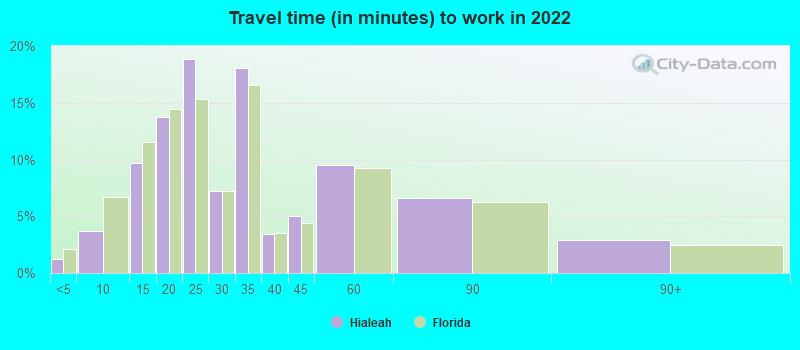
Average travel time to work
Type
Charlotte
Hialeah
Average
29.6 min
31.1 min
Other means
24.9 min
27.8 min
Public transportation
44.1 min
47.6 min
Private vehicle occupancy
Type
Charlotte
Hialeah
Average
1.2
1.2
Drove alone
90%
88.7%
In 2 person carpool
6.9%
7.4%
In 3 person carpool
1.8%
0.6%
In 4 person carpool
0.8%
1.4%
In 5-6 person carpool
0.5%
1.6%
In 7+ person carpool
0.1%
0.2%
How many people usually rode to work in the car, truck or van.
Real Estate
Charlotte's real estate market is more expensive than Hialeah's. However, Charlotte offers a variety of housing options from apartments to family homes, and is experiencing a significant growth in its downtown area. Hialeah's real estate market has a variety of affordable housing options, particularly enticing for retirees and young families.
Neighborhoods
Charlotte is made up of various distinct neighborhoods each offering a unique flair, such as the artsy NoDa or the upscale Myers Park. Hialeah is known for its tight-knit, family-oriented communities with a strong Cuban cultural influence.
Houses and residents
Type
Charlotte
Hialeah
Houses
393,631
78,076
Average household size (people)
2.5
3.1
Median year apartment built
1998
1975
Median year house/condo built
1993
1973
Length of stay in the house since moving in
11.8 years
15.4 years
Houses occupied
365,269 (92.8%)
75,692 (96.9%)
Houses occupied by owners
193,930 (53.1%)
35,676 (47.1%)
Houses occupied by renters
171,339 (46.9%)
40,016 (52.9%)
Median rent asked for vacant for-rent units
$1,482
$712.50
Median monthly housing costs
$1,302
$1,239
Median price asked for vacant for-sale houses and condos
$445,491
$578,978
Estimated median house or condo value
$321,400
$324,000
Median numbers of rooms
5.3
4.4
Median number of rooms in apartments
4
3.9
Median number of rooms in houses and condos
6.6
5.2
Median house price - detached houses
$388,029
$353,442
Median house price - in 2-unit structures
$184,325
$207,624
Median house price - in 3-to-4-unit structures
$178,624
$218,498
Median house price - in 5 or more unit structures
$433,957
$239,263
Median house price - mobile homes
$52,977
$433,672
Median house price - Townhouses or other attached units
$296,370
$285,621
Median house price - All housing units
$378,423
$317,773
Median house age
26
46
Renting percentage
42.6%
49.4%
Housing density (houses/condos per square mile)
1,624.8
4,057.7
House value disparities
33.3%
24.8%
Household income disparities
44.1%
45.8%
Median household income for houses/condes with a mortgage
$105,905
$64,386
Median household income for apartments without a mortgage
$70,681
$44,969
Housing units without a mortgage
3,089 (2.1%)
436 (2.3%)
Housing units with both a second mortgage and home equity loan
10,553 (7.2%)
756 (4%)
Housing units with a mortgage
142,912 (97.9%)
18,412 (97.7%)
Housing units with a home equity loan
171 (0.1%)
53 (0.3%)
Housing units with a second mortgage
13,532 (9.3%)
850 (4.5%)
House/condo owner moved in on average (years ago)
9
15
House/condo renter moved in on average (years ago)
1
3
Housing units lacking complete kitchen facilities
0.8%
2.1%
Housing units lacking complete plumbing facilities
0.2%
1.1%
Housing units in structures
Housing units in structures
Charlotte
Hialeah
One, detached
52.7%
39.3%
One, attached
9.1%
9.0%
Two
0.9%
1.3%
3 or 4
2.9%
6.5%
5 to 9
7.1%
8.2%
10 to 19
9.5%
5.7%
20 to 49
6.2%
14.4%
50 or more
10.3%
15.1%
Mobile homes
1.4%
0.5%
Boats, RVs, vans, etc.
0.0%
0.1%
Median real estate property taxes paid for housing units
Self-employed workers in own not incorporated business
25,780
14,316
State government workers
16,519
1,118
Unpaid family workers
1,214
379
Industries and Occupations
In Charlotte, major industries include finance, energy, and healthcare, with a growing tech scene. Hialeah's economy drawn from retail trade, healthcare and manufacturing sectors. The city also has a clothing industry, particularly for jeans.
Charlotte's healthcare sector is strong, with some nationally ranked hospitals like Atrium Health. In Hialeah, the healthcare system is robust and part of the larger Miami system, featuring facilities like Palmetto General Hospital.
Health (county statistics)
Type
Charlotte
Hialeah
General health status score of residents in this county from 1 (poor) to 5 (excellent)
Charlotte's infrastructure is robust, supported by the fortunes of the city's banking sector. The city also has a streamlined public transit system. Hialeah, although smaller, maintains a good level of infrastructure, including public facilities and parks.
Infrastructure
Type
Charlotte
Hialeah
Hospitals
37
6
TV stations
16
27
Bank branches located here
202
53
Bank institutions located here
26
22
Main business address for public companies
33
2
Nuclear power plants nearby
2
0
Drinking water stations with no reported violations in the past
24
1
Drinking water stations with reported violations in the past
HMDA - Conventional home purchase loans - Applications denied
Year
Charlotte
Hialeah
1999
3,049
0
2000
1,568
267
2001
1,382
265
2002
1,275
244
2003
1,879
696
2004
2,415
983
2005
3,078
1,502
2006
3,864
2,294
2007
3,106
1,204
2008
1,287
319
2009
617
73
Culture and Food
Charlotte adopts a Southern culture and cuisine, featuring barbecue, craft breweries and more. The city also has a burgeoning arts scene. Hialeah is known for its rich Cuban culture and Latin American cuisine, with a vibrant community filled with festivals and events.
Sports Teams
Charlotte hosts professional sports teams including the Carolina Panthers (NFL) and Charlotte Hornets (NBA). Hialeah does not have its own major league teams, but Miami's teams like the Heat (NBA), Dolphins (NFL), and Marlins (MLB) are nearby.


 Charlotte, NC
 Hialeah, FL