Cleveland, a vibrant city by Lake Erie, and Parma, a prominent suburban city, both located in the state of Ohio, offer unique experiences to both residents and tourists. Cleveland is known for its bustling urban environment, rich history, and diverse culture, whilst Parma, being the second largest city in Cuyahoga County after Cleveland, is often admired for its quieter, more laid-back lifestyle, excellent schools, and lower cost of living. While both cities have their unique benefits and drawbacks, choosing between them greatly depends on one's personal preferences and lifestyle needs.
Distance between
Cleveland, OH and
Parma, OH : 7.0 miles
Cleveland's population is larger by 360%. Its population has decreased by 110,412 people (23.1%) since 2000. The population of Parma has decreased by 5,673 people (6.6%) during that time.
In terms of crime and safety, Parma consistently ranks as one of the safest cities in Ohio, offering a high level of security for both residents and visitors. On the other hand, crime rates tend to be higher in Cleveland, largely due to its urban nature and larger population. Nonetheless, Cleveland's downtown area and most residential neighborhoods are relatively safe, and policing and community efforts have contributed to a steady decline in crime over the years.
City-data.com crime index counts serious crimes and violent crime more heavily. It adjusts for the number of visitors and daily workers commuting into cities. (higher means more crime, U.S. average = 301.1)
City-data.com crime index counts serious crimes and violent crime more heavily. It adjusts for the number of visitors and daily workers commuting into cities. (higher means more crime, U.S. average = 301.1)
Sex Offenders
According to our data, there are 1,976 registered sex offenders living in Cleveland and 112 registered sex offenders living in . The ratio of residents to sex offenders in Cleveland is 195 to 1; the ratio in Parma is 710 to 1. The number of registered sex offenders compared to the number of residents is much larger in Cleveland than that in Parma.
Cost of Living
Parma generally offers a lower cost of living compared to Cleveland. Housing in Parma is cheaper on average and residents tend to enjoy lower costs for groceries and other everyday necessities. Cleveland, being a larger, more urban city, naturally comes with a higher cost of living, particularly in downtown areas and upscale neighborhoods. However, it also offers a wider range of amenities and services that may justify the cost for some.
Income Tax
Cleveland imposes a city income tax of 2.5% on residents, non-residents working in the city, and businesses. Parma has an income tax rate of 2.5% for residents and businesses, but also offers a 100% credit for residents who work outside the city and pay taxes to another municipality.
Property Tax
Both Cleveland and Parma have a variety of property tax rates, depending on the specific location within each city. Rates in Cleveland generally tend to be higher, primarily due to the city's robust public services and amenities. Meanwhile, Parma offers a lower property tax, making it friendly for homeowners.
Sales Tax
Both cities are subject to Ohio's state sales tax rate of 5.75%. Additionally, Cuyahoga County, where both Cleveland and Parma are located, has a county sales tax of 2.25%, resulting in a total sales tax rate of 8% for both cities.
Income
Type
Cleveland
Parma
Estimated median household income
$35,562
$57,444
Estimated per capita income
$24,093
$30,463
Cost of living index (U.S. average is 100)
94.3
95
If you make $50,000 in Cleveland, you will have to make $50,371 in Parma to maintain the same standard of living.
Geographical Conditions
Both Cleveland and Parma are located in Northeast Ohio, featuring relatively flat landscapes. Cleveland's geography is characterized more by urban spaces and Lake Erie's coastline, offering several waterfront activities. Parma, being a suburb, has more green spaces and is largely residential.
Cleveland boasts numerous high-quality private and public schools, as well as several notable universities, including Case Western Reserve University and Cleveland State University. Parma, primarily a residential city, offers excellent public schools administered by the Parma City School District. However, it lacks the higher education opportunities present in Cleveland.
Cleveland's economy is diverse, with strong sectors in healthcare, higher education, financial services, and manufacturing. On the other hand, Parma's economy is primarily based on retail, healthcare, manufacturing and local services. Job opportunities are generally more abundant in Cleveland, but Parma offers a comparatively small-town community atmosphere with decent job prospects.
Biggest Employers
In Cleveland, some of the biggest employers include The Cleveland Clinic, University Hospitals, and KeyCorp. Parma, on the other hand, has General Motors, Parma Community General Hospital, and Cuyahoga County Community College as its leading employers.
There were 104 building permits issued in Cleveland in 2012 (18 more than in 2011) compared to 44 building permits issued in Parma in 2012 (41 more than in 2011).
Weather
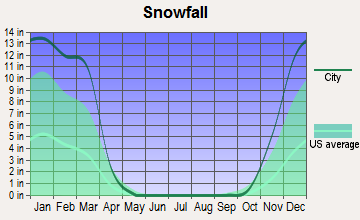
Cleveland and Parma share relatively similar weather patterns as they are geographically close. Both cities experience four distinct seasons, with hot, humid summers and cold, snowy winters. Lake Erie moderates the climate in Cleveland slightly, making it somewhat less severe than that in Parma. Winter lake-effect snow is common in both cities, though tends to be heavier in Cleveland.
Weather and climate
Type
Cleveland
Parma
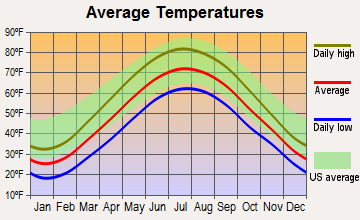
Temperature - Average
50.1°F
49.8°F
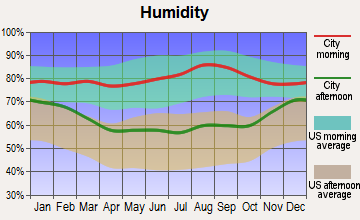
Humidity - Average morning or afternoon humidity
75.8%
75.8%
Humidity - Differences between morning and afternoon humidity
27%
27%
Humidity - Maximum monthly morning or afternoon humidity
83%
83%
Humidity - Minimum monthly morning or afternoon humidity
56%
56%
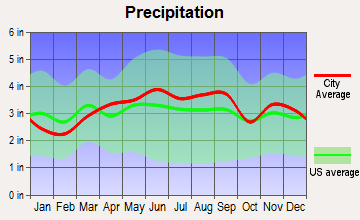
Precipitation - Yearly average
38.5 in
38.6 in
Snowfall - Yearly average
115.9 in
116 in
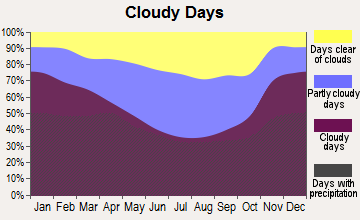
Clouds - Number of days clear of clouds
11.2%
11.2%
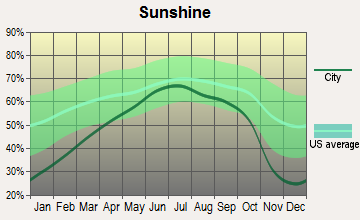
Sunshine amount - Average
51.8%
51.8%
Sunshine amount - Differences during a year
44%
44%
Sunshine amount - Maximum monthly
66%
66%
Sunshine amount - Minimum monthly
22%
22%
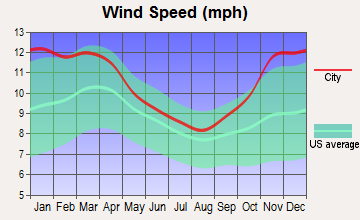
Wind speed - Average
10.4 mph
10.4 mph
Average climate in Cleveland, Ohio
Average climate in Parma, Ohio
Air pollution
Type
AQI
CO
NO2
OZONE
PM10
PM25
SO2
Year
Cleveland
Parma
Cleveland
Parma
Cleveland
Parma
Cleveland
Parma
Cleveland
Parma
Cleveland
Parma
Cleveland
Parma
2018
85
85
0.26
0.25
11.3
11.3
26.9
25.6
22.7
22.7
9.3
9.0
0.6
0.6
2017
82
82
0.27
0.25
11.4
11.4
27.6
26.6
23.2
23.2
8.2
7.7
0.5
0.5
2016
81
82
0.27
0.25
11.1
11.1
27.1
26.2
23.4
23.4
9.9
9.4
1.0
0.9
2015
76
76
0.27
0.26
12.9
12.9
25.1
24.7
31.5
31.5
8.0
7.7
1.9
1.7
2014
83
83
0.25
0.24
12.3
12.3
23.7
23.3
28.4
28.4
10.6
10.0
1.7
1.7
2013
88
88
0.24
0.24
12.9
12.9
23.8
23.7
27.3
27.3
12.0
11.4
1.9
1.9
2012
119
119
0.28
0.26
13.7
13.7
26.5
26.3
32.0
32.0
15.2
14.4
2.5
2.4
2011
110
110
0.29
0.27
15.3
15.3
25.8
24.5
29.7
29.7
16.1
15.3
3.4
3.2
2010
113
113
0.35
0.21
15.8
15.8
27.0
26.3
24.2
24.2
18.7
18.0
3.6
3.3
2009
67
70
0.37
0.35
17.1
17.1
26.0
23.7
21.5
21.5
N/A
N/A
3.7
3.4
2008
87
91
0.29
0.29
15.2
15.4
32.9
29.7
27.1
27.1
N/A
N/A
4.2
3.9
2007
94
100
0.29
0.29
18.1
18.4
32.9
30.3
30.3
30.3
N/A
N/A
5.2
4.9
2006
75
78
0.25
0.27
16.2
16.4
27.7
26.9
27.3
27.3
N/A
N/A
5.0
4.9
2005
98
111
0.27
0.28
19.2
19.5
28.6
27.4
31.7
31.7
N/A
N/A
5.7
5.4
2004
77
84
0.47
0.47
19.5
19.9
20.1
23.5
29.2
28.4
N/A
N/A
3.8
3.7
2003
81
92
0.49
0.47
19.6
20.0
25.8
25.0
28.3
27.5
N/A
N/A
5.7
5.5
2002
95
99
0.40
0.41
19.8
20.3
28.6
29.3
32.5
30.1
N/A
N/A
5.1
5.1
2001
91
100
0.43
0.44
21.1
21.6
28.4
28.9
35.9
30.3
N/A
N/A
5.9
5.6
2000
79
90
0.48
0.50
20.5
21.0
25.2
24.9
35.9
34.7
N/A
N/A
5.8
5.5
Natural disasters
Type
Cleveland
Parma
Tornado activity compared to U.S. average
93%
99.4%
Earthquake activity compared to U.S. average
50.2%
51.4%
Natural disasters compared to U.S. average
16%
16%
Transportation
Cleveland has a more extensive public transit system operated by the Greater Cleveland Regional Transit Authority, which includes buses, trolleys, and the Rapid Transit rail system. Parma primarily relies on roads and highways, with most residents commuting by private vehicle. However, there are also bus services available.
Transport
Type
Cleveland
Parma
Amtrak stations
1
0
Amtrak stations nearby
1
2
FAA registered aircraft
307
15
FAA registered aircraft manufacturers and dealers
19
0
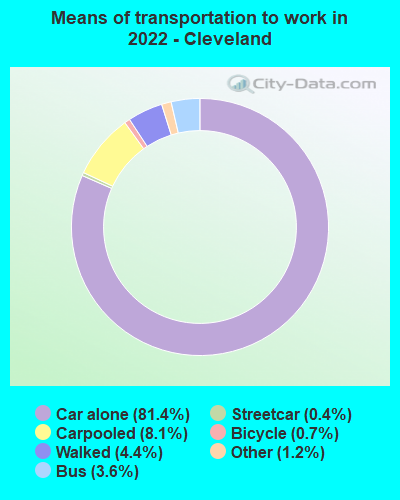
Means of transportation to work
Type
Cleveland
Parma
Bicycle
0.2%
0.3%
Bus
3.5%
0.9%
Carpooled
7.7%
9.2%
Car alone
83.1%
86%
Railroad
0.1%
0%
Streetcar
0.4%
0%
Taxicab
0.1%
0.2%
Walked
3.9%
2.5%
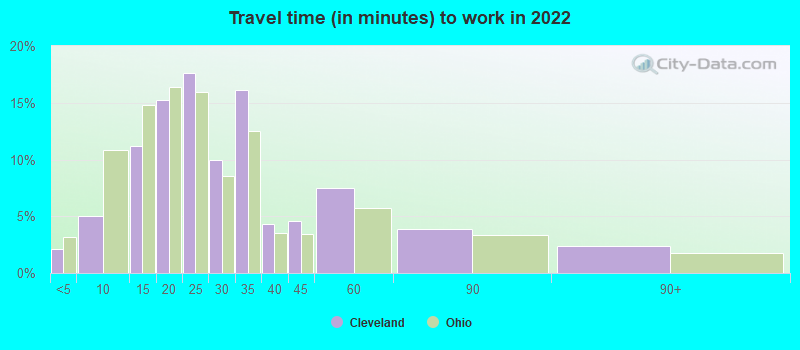
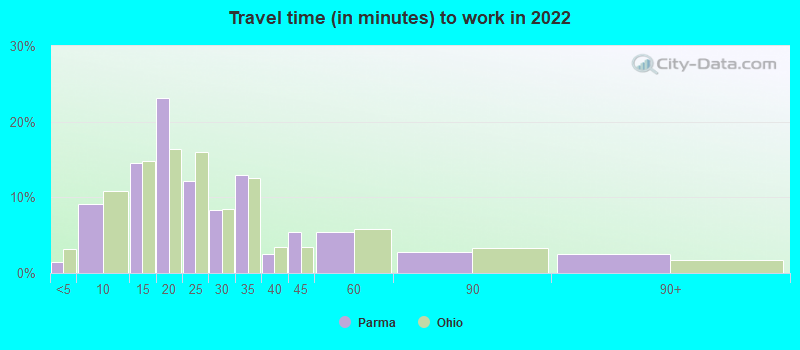
Average travel time to work
Type
Cleveland
Parma
Average
28.9 min
22.3 min
Other means
23.2 min
24.2 min
Public transportation
42.9 min
44.2 min
Private vehicle occupancy
Type
Cleveland
Parma
Average
1.2
1.1
Drove alone
87.9%
90.6%
In 2 person carpool
10.3%
7%
In 3 person carpool
1%
1.6%
In 4 person carpool
0.4%
0.6%
In 7+ person carpool
0.3%
0.2%
How many people usually rode to work in the car, truck or van.
Real Estate
Real estate is generally cheaper in Parma than in Cleveland. Parma has a predominance of affordable, single-family homes, offering a mix of new and older houses. On the other hand, the housing market in Cleveland varies significantly from one neighborhood to another, with prices generally higher, particularly for downtown apartments and lakeside properties.
Neighborhoods
Cleveland offers a greater diversity of neighborhoods, from the buzzing Downtown district to the hip Tremont and Ohio City areas to upscale residential areas such as Shaker Heights. Parma, being a predominantly residential city, offers pleasant, family-friendly neighborhoods characterized by quiet, tree-lined streets.
Houses and residents
Type
Cleveland
Parma
Houses
202,735
35,322
Average household size (people)
2.3
2.3
Median year apartment built
1946
1965
Length of stay in the house since moving in
17.5 years
15.2 years
Houses occupied
171,321 (84.5%)
33,401 (94.6%)
Houses occupied by owners
67,039 (39.1%)
24,934 (74.7%)
Houses occupied by renters
104,282 (60.9%)
8,467 (25.4%)
Median rent asked for vacant for-rent units
$1,284
$1,246
Median monthly housing costs
$754
$919
Median price asked for vacant for-sale houses and condos
$86,306
$131,548
Estimated median house or condo value
$83,400
$148,000
Median numbers of rooms
5.2
6.1
Median number of rooms in apartments
4.4
4.4
Median number of rooms in houses and condos
6.3
6.5
Median house age
80
63
Renting percentage
55.9%
25.8%
Housing density (houses/condos per square mile)
2,613.2
1,769.6
House value disparities
41.6%
20.4%
Household income disparities
48.5%
38.8%
Median household income for houses/condes with a mortgage
$61,885
$76,146
Median household income for apartments without a mortgage
$42,551
$58,543
Housing units without a mortgage
2,325 (6.3%)
941 (5.7%)
Housing units with both a second mortgage and home equity loan
2,348 (6.4%)
920 (5.6%)
Housing units with a mortgage
34,401 (93.7%)
15,631 (94.3%)
Housing units with a home equity loan
166 (0.5%)
74 (0.4%)
Housing units with a second mortgage
3,335 (9.1%)
1,296 (7.8%)
House/condo owner moved in on average (years ago)
19
15
House/condo renter moved in on average (years ago)
3
2
Housing units lacking complete kitchen facilities
8.8%
1.1%
Housing units lacking complete plumbing facilities
5.1%
0.2%
Housing units in structures
Housing units in structures
Cleveland
Parma
One, detached
48.7%
77.7%
One, attached
5.6%
1.9%
Two
14.7%
2.7%
3 or 4
5.2%
0.5%
5 to 9
5.0%
5.3%
10 to 19
3.8%
4.8%
20 to 49
3.3%
0.9%
50 or more
13.1%
6.0%
Mobile homes
0.4%
0.1%
Boats, RVs, vans, etc.
0.1%
0.0%
Median real estate property taxes paid for housing units
Self-employed workers in own not incorporated business
7,246
2,960
State government workers
2,212
700
Unpaid family workers
328
56
Industries and Occupations
Cleveland has a broad range of industries including healthcare, manufacturing, financial services, and technology. Parma, while not as diverse, still offers opportunities in sectors such as manufacturing, retail, and healthcare. In terms of occupations, Cleveland's proximity to a variety of large corporations and institutions provides a wider array of job prospects compared to Parma.
Health diagnosing and treating practitioners and other technical occupations
6.2%
4.0%
Business and financial operations occupations
5.7%
6.0%
Production occupations
5.3%
4.3%
Educational instruction, and library occupations
5.1%
7.4%
Personal care and service occupations
4.6%
2.7%
Building and grounds cleaning and maintenance occupations
4.1%
0.4%
Health technologists and technicians
3.5%
5.7%
Material moving occupations
3.2%
2.8%
Community and social service occupations
2.6%
3.5%
Transportation occupations
2.4%
3.4%
Computer and mathematical occupations
2.1%
2.1%
Legal occupations
1.4%
1.6%
Life, physical, and social science occupations
1.0%
0.0%
Arts, design, entertainment, sports, and media occupations
0.7%
1.8%
Health Care
Cleveland is renowned globally for its healthcare institutions, hosting the world-class Cleveland Clinic and University Hospitals. Parma has a strong healthcare sector, with Parma Community General Hospital serving as a significant healthcare provider. However, it doesn't match the wide variety of specialized care and advanced medical research available in Cleveland.
Cleveland, being a larger city, has a more extensive infrastructure offering more in terms of amenities and services than Parma. Moreover, Cleveland benefits from the presence of a well-established public transportation system, while Parma largely relies on private automobiles for transport.
Infrastructure
Type
Cleveland
Parma
Hospitals
30
9
TV stations
16
19
Bank branches located here
116
25
Bank institutions located here
17
13
Drinking water stations with no reported violations in the past
1
0
Drinking water stations with reported violations in the past
HMDA - Conventional home purchase loans - Applications denied
Year
Cleveland
Parma
1999
1,871
77
2000
2,587
95
2001
2,077
106
2002
1,561
98
2003
1,242
120
2004
1,561
210
2005
3,297
250
2006
3,951
270
2007
2,211
132
2008
482
76
2009
184
30
Culture and Food
Cleveland is renowned for its thriving arts and culture scene. It boasts world-class museums, Broadway shows at Playhouse Square, and eclectic dining featuring cuisine from around the world. Parma, while having a smaller and less diverse cultural and food scene, is known for its strong Polish and Ukrainian influences, featuring many Eastern European restaurants and shops.
Sports Teams
Cleveland is home to three major sports franchises: The Cleveland Browns (NFL), Cleveland Cavaliers (NBA), and Cleveland Indians (MLB). Parma does not have major league sports teams but does support local sports at the high school and minor league levels.

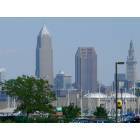


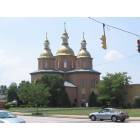
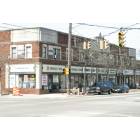

 Cleveland, OH
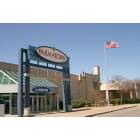
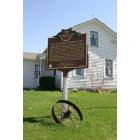
 Parma, OH