Fort Worth, Texas, and Chula Vista, California, may both be prominent American cities, but they offer distinct experiences in terms of weather, cost of living, employment, and culture. Fort Worth is known for its Texan charm, cowtown history, and friendly locals, while Chula Vista prides itself on its coastal location, Hispanic influence, and emphasis on outdoor activities. While each city has its unique pros and cons, a wide range of factors, from crime rates and weather to taxes and transportation, can influence the choice between living in Fort Worth or Chula Vista.
Distance between
Fort Worth, TX and
Chula Vista, CA : 1,144.8 miles
Fort Worth's population is larger by 238%. Its population has grown by 400,814 people (75.0%) since 2000. The population of Chula Vista has grown by 103,664 people (59.7%) during that time.
When it comes to crime and safety, both cities show a contrast. According to the available data, Fort Worth, Texas, has a higher crime rate compared to the national average. However, like many cities, crime tends to be localized with areas of the city having a much lower crime rate. On the other hand, Chula Vista, California, boasts a crime rate that is lower than the national average, making it one of the safer cities of its size in the country. Both cities have active police forces dedicated to maintaining safety and minimizing crime.
City-data.com crime index counts serious crimes and violent crime more heavily. It adjusts for the number of visitors and daily workers commuting into cities. (higher means more crime, U.S. average = 301.1)
City-data.com crime index counts serious crimes and violent crime more heavily. It adjusts for the number of visitors and daily workers commuting into cities. (higher means more crime, U.S. average = 301.1)
Sex Offenders
According to our data, there are 3,166 registered sex offenders living in Fort Worth and 204 registered sex offenders living in . The ratio of residents to sex offenders in Fort Worth is 270 to 1; the ratio in Chula Vista is 1,310 to 1. The number of registered sex offenders compared to the number of residents is much larger in Fort Worth than that in Chula Vista.
Cost of Living
Cost of living is an important factor for anyone considering relocation. The cost of living in Chula Vista is significantly higher than in Fort Worth. This difference reflects broader trends in California and Texas, and it primarily stems from housing costs. Grocery, healthcare, and transportation costs also tend to be higher in Chula Vista. However, salaries in Chula Vista are comparatively higher than Fort Worth, which can somewhat balance the high cost of living.
Income Tax
A significant difference between California and Texas is the absence of a state income tax in Texas. This absence can be a big draw for some people considering a move to Fort Worth. In contrast, California has a progressive income tax system where rate ranges from 1% to 13.3% depending on the income level.
Property Tax
When it comes to property taxes, Texas is known for having some of the highest rates in the nation, and Fort Worth is no exception. Conversely, property taxes in Chula Vista tend to be moderate compared to national averages, albeit still higher than in some states.
Sales Tax
Tax-wise, Chula Vista has a higher combined sales tax at around 8.75%, which is higher than the national average. On the other hand, Fort Worth has a combined sales tax of 8.25%, which while lower than Chula Vista, is still higher than some states.
Income
Type
Fort Worth
Chula Vista
Estimated median household income
$68,235
$91,949
Estimated per capita income
$34,106
$35,138
Cost of living index (U.S. average is 100)
95.4
123.4
If you make $50,000 in Fort Worth, you will have to make $64,675 in Chula Vista to maintain the same standard of living.
Geographical Conditions
Fort Worth is located in North Central Texas and is known for its flatlands and prairies, with some rolling hills. Meanwhile, Chula Vista is located between the San Diego Bay and coastal mountain foothills, offering residents both coastal and mountain views. The geography of both cities lends itself to unique local attractions and activities.
Both cities are served by large school districts and have access to higher education institutions. Chula Vista is a part of the Sweetwater Union High School District and the Chula Vista Elementary School District, boasting a wide range of schools including specialized and charter schools. In addition to local colleges, it's near UC San Diego and San Diego State University. Fort Worth has the Fort Worth Independent School District and private schools, with Texas Christian University and University of North Texas Health Science Center within its limits. Texas's commitment to education is reflected in the quality and abundance of its school options.
Both cities have a healthy job market. Fort Worth's economy is diverse with key sectors being aviation, healthcare, technology, and oil and gas. The military also has a big impact on the economy with the Naval Air Station Joint Reserve Base Fort Worth based here. In comparison, Chula Vista's economy is driven by tourism, the telecommunication industry, aerospace, and the public sector. Both cities have a lower unemployment rate than the national average, which is a positive sign for job seekers moving to either city.
Biggest Employers
Fort Worth’s largest employers include the American Airlines Group, Lockheed Martin Aeronautics, and the Fort Worth Independent School District. Conversely, the top employers in Chula Vista are the Sweetwater Union High School District, Chula Vista Elementary School District, and the City of Chula Vista. These employers represent the diverse range of sectors that contribute to each city's local economy.
There were 7,236 building permits issued in Fort Worth in 2012 (4810 more than in 2011) compared to 291 building permits issued in Chula Vista in 2012 (137 less than in 2011).
In Fort Worth (Tarrant County), 41.4% voted for Democrats and 57.1% for Republicans in 2012 Presidential Election. In Chula Vista (San Diego County), 52.6% voted for Democrats and 45.0% for Republicans.
Elections
Type
Democrats
Republicans
Other
Year
Fort Worth
Chula Vista
Fort Worth
Chula Vista
Fort Worth
Chula Vista
2020
49.3%
60.3%
49.1%
37.5%
1.6%
2.1%
2016
43.2%
56.3%
51.8%
36.6%
5.0%
7.1%
2012
41.4%
52.6%
57.1%
45.0%
1.4%
2.4%
2008
43.8%
54.2%
55.5%
44.0%
0.7%
1.8%
2004
37.0%
46.7%
62.5%
52.9%
0.5%
0.4%
2000
36.9%
45.8%
60.9%
49.8%
2.3%
4.5%
1996
41.6%
44.1%
50.9%
45.6%
7.5%
10.3%
Breakdown of population affiliated with a religious congregation
Type
Adherents
Congregations
Religion
Fort Worth
Chula Vista
Fort Worth
Chula Vista
SOUTHERN BAPTIST CONVENTION
17.3%
1.1%
33.3%
12.0%
CATHOLIC CHURCH
11.1%
25.9%
1.9%
6.7%
MUSLIM ESTIMATE
2.2%
0.7%
0.9%
1.1%
LUTHERAN CHURCH
0.5%
0.4%
0.9%
2.2%
SEVENTH DAY ADVENTIST CHURCH
0.4%
0.5%
1.6%
2.0%
EPISCOPAL CHURCH
0.3%
0.4%
0.8%
2.0%
EVANGELICAL LUTHERAN CHURCH IN AMERICA
0.3%
0.4%
0.9%
2.0%
Weather
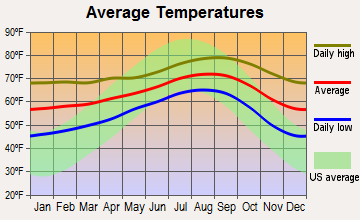
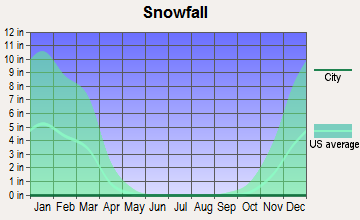
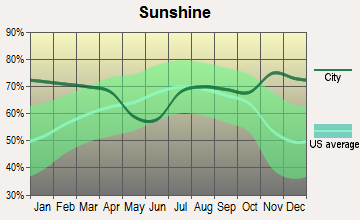
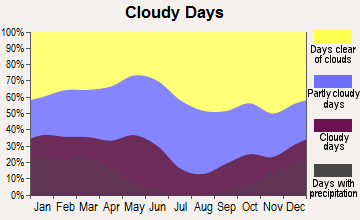
Weather marks a notable difference between Fort Worth and Chula Vista. Fort Worth experiences a humid subtropical climate with hot, humid summers and generally mild winters. Thunderstorms are frequent in spring and fall seasons. On the contrary, Chula Vista, due to its coastal location, enjoys a Mediterranean climate characterized by mild, wet winters and hot, dry summers. Chula Vista sees more sun and less contrast of temperatures throughout the year, which is a big draw for those who enjoy outdoor activities year-round.
Weather and climate
Type
Fort Worth
Chula Vista
Temperature - Average
65°F
63.9°F
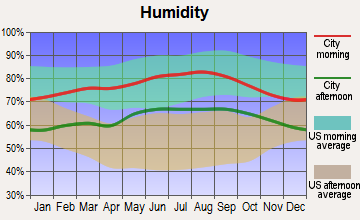
Humidity - Average morning or afternoon humidity
71.4%
74%
Humidity - Differences between morning and afternoon humidity
34.1%
22%
Humidity - Maximum monthly morning or afternoon humidity
82.1%
80%
Humidity - Minimum monthly morning or afternoon humidity
48%
58%
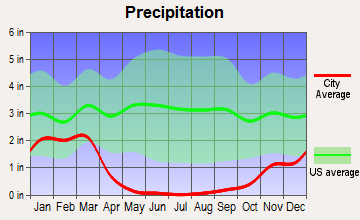
Precipitation - Yearly average
35 in
10.3 in
Snowfall - Yearly average
4.2 in
0 in
Clouds - Number of days clear of clouds
22.8%
24.3%
Sunshine amount - Average
66.6%
74.8%
Sunshine amount - Differences during a year
20%
19%
Sunshine amount - Maximum monthly
74%
75%
Sunshine amount - Minimum monthly
54%
56%
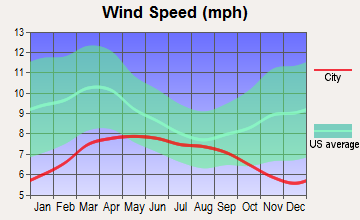
Wind speed - Average
10.3 mph
6.9 mph
Average climate in Fort Worth, Texas
Average climate in Chula Vista, California
Air pollution
Type
AQI
CO
NO2
OZONE
PB
PM10
PM25
SO2
Year
Fort Worth
Chula Vista
Fort Worth
Chula Vista
Fort Worth
Chula Vista
Fort Worth
Chula Vista
Chula Vista
Chula Vista
Fort Worth
Chula Vista
Fort Worth
Chula Vista
2018
67
101
N/A
0.36
5.8
8.6
27.1
29.4
0.010
N/A
N/A
N/A
N/A
11.5
N/A
0.1
2017
67
115
N/A
0.39
6.2
9.1
27.2
28.8
0.010
N/A
N/A
N/A
N/A
11.5
N/A
0.1
2016
56
105
N/A
0.34
6.3
9.1
25.5
28.6
0.010
N/A
N/A
N/A
N/A
12.0
N/A
0.1
2015
61
105
N/A
0.34
6.5
10.0
24.8
28.5
0.015
N/A
N/A
N/A
N/A
12.0
N/A
0.1
2014
56
99
0.22
0.42
6.8
10.6
26.6
26.3
0.012
N/A
N/A
N/A
N/A
10.8
N/A
0.1
2013
64
128
0.25
0.61
6.4
10.8
26.5
28.7
0.013
N/A
N/A
N/A
N/A
12.2
N/A
0.3
2012
87
107
0.26
0.54
7.8
11.1
30.3
31.2
0.013
N/A
N/A
N/A
N/A
13.6
N/A
0.2
2011
79
108
0.23
0.57
7.9
12.3
30.7
27.1
0.023
N/A
N/A
N/A
N/A
14.0
N/A
2.1
2010
70
91
0.23
0.56
8.5
12.2
27.7
33.6
0.017
N/A
N/A
N/A
N/A
N/A
N/A
1.4
2009
81
109
0.25
0.55
8.7
13.4
29.5
33.3
0.014
N/A
N/A
N/A
N/A
N/A
N/A
2.0
2008
69
401
0.25
0.60
9.6
14.8
25.8
32.7
N/A
N/A
207.2
N/A
N/A
N/A
N/A
2.3
2007
75
160
0.30
0.66
10.6
15.0
24.6
34.2
0.012
N/A
64.3
N/A
N/A
N/A
N/A
2.6
2006
90
130
0.34
0.61
10.2
16.9
29.7
32.4
0.056
N/A
64.0
N/A
N/A
N/A
N/A
3.3
2005
102
126
0.34
0.68
10.9
16.3
28.4
32.2
0.049
N/A
72.6
N/A
11.3
N/A
0.9
3.1
2004
78
116
0.39
0.72
10.6
16.0
25.4
30.6
0.055
N/A
N/A
N/A
N/A
N/A
N/A
3.1
2003
82
128
0.40
0.71
11.1
17.7
27.2
23.1
0.048
N/A
N/A
N/A
N/A
N/A
N/A
3.6
2002
94
125
0.37
0.74
11.8
17.7
25.8
30.7
0.015
N/A
N/A
N/A
N/A
N/A
N/A
3.7
2001
16
129
0.48
0.81
N/A
16.9
N/A
30.8
0.029
N/A
N/A
N/A
N/A
N/A
N/A
3.3
2000
17
132
0.55
0.84
N/A
16.9
N/A
28.4
0.045
N/A
N/A
N/A
N/A
N/A
N/A
2.7
Natural disasters
Type
Fort Worth
Chula Vista
Tornado activity compared to U.S. average
249.6%
5%
Earthquake activity compared to U.S. average
562.8%
5,616.5%
Natural disasters compared to U.S. average
23%
39%
Transportation
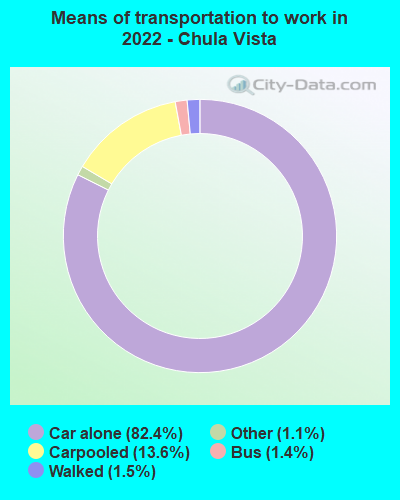
Public transportation, while available in both cities, is more widely used in Chula Vista. The Metropolitan Transit System (MTS) offers bus routes throughout Chula Vista and the surrounding areas. Fort Worth Transportation Authority provides bus service within Fort Worth, and the Trinity Railway Express connects Fort Worth with Dallas. However, like many Texas cities, Fort Worth is a car-friendly city and the majority of residents prefer driving.
Transport
Type
Fort Worth
Chula Vista
Amtrak stations
1
0
Amtrak stations nearby
1
1
FAA registered aircraft
2
59
FAA registered aircraft manufacturers and dealers
19
0
Means of transportation to work
Type
Fort Worth
Chula Vista
Bicycle
0.1%
0.2%
Bus
0.4%
2.6%
Carpooled
11%
10%
Car alone
85.8%
79.6%
Motorcycle
0.1%
0.3%
Railroad
0%
0.4%
Streetcar
0%
0.2%
Walked
1.3%
3.6%
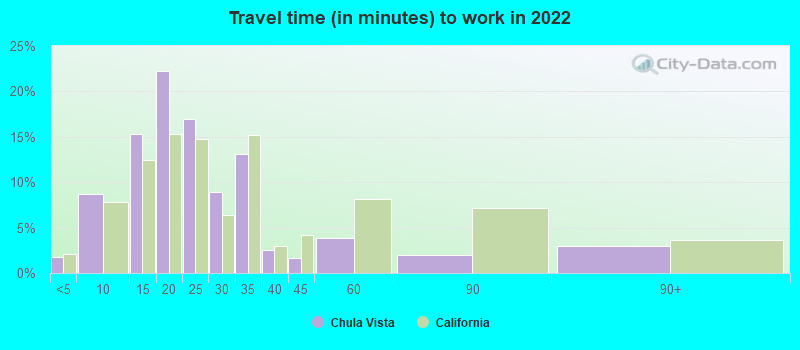
Average travel time to work
Type
Fort Worth
Chula Vista
Average
28.5 min
23 min
Other means
25.3 min
26.2 min
Public transportation
41.8 min
46.6 min
Private vehicle occupancy
Type
Fort Worth
Chula Vista
Average
1.2
1.2
Drove alone
87.6%
88.5%
In 2 person carpool
8.5%
8.2%
In 3 person carpool
2.5%
2.1%
In 4 person carpool
1.1%
0.9%
In 5-6 person carpool
0.3%
0.3%
How many people usually rode to work in the car, truck or van.
Real Estate
The real estate market offers numerous opportunities in both cities, but they are notably different in terms of price. Property prices, as well as rent rates, are significantly higher in Chula Vista compared to Fort Worth. However, both cities offer a range of housing options from apartments and condos to detached houses, to suit different needs and preferences.
Neighborhoods
Both Fort Worth and Chula Vista offer a variety of neighborhoods that cater to different lifestyles. Fort Worth has distinct areas like the historic Stockyards for a taste of the old west and Sundance Square for a vibrant urban environment. Chula Vista offers coastal neighborhoods, where you could have a view of the bay or the mountains, and Eastlake, known for its family-friendly environment and modern amenities.
Houses and residents
Type
Fort Worth
Chula Vista
Houses
361,341
88,821
Average household size (people)
2.8
3.2
Median year apartment built
1991
1982
Median year house/condo built
1995
1990
Length of stay in the house since moving in
11.2 years
13.2 years
Houses occupied
334,286 (92.5%)
83,451 (94%)
Houses occupied by owners
185,197 (55.4%)
48,589 (58.2%)
Houses occupied by renters
149,089 (44.6%)
34,862 (41.8%)
Median rent asked for vacant for-rent units
$1,068
$1,736
Median monthly housing costs
$1,328
$2,012
Median price asked for vacant for-sale houses and condos
$288,576
$648,184
Estimated median house or condo value
$249,000
$655,100
Median numbers of rooms
5.3
4.9
Median number of rooms in apartments
4.2
3.8
Median number of rooms in houses and condos
6.3
6
Median house price - detached houses
$279,885
$656,786
Median house price - in 2-unit structures
Over $1,000,000
$397,704
Median house price - in 3-to-4-unit structures
$337,081
$379,885
Median house price - in 5 or more unit structures
$298,062
$375,564
Median house price - mobile homes
$58,470
$80,419
Median house price - Townhouses or other attached units
$279,957
$474,754
Median house price - All housing units
$279,281
$579,650
Median house age
29
36
Renting percentage
40.8%
41.9%
Housing density (houses/condos per square mile)
1,235.2
1,817.2
House value disparities
31.8%
19.7%
Household income disparities
43.6%
41.7%
Median household income for houses/condes with a mortgage
$106,170
$133,618
Median household income for apartments without a mortgage
$72,147
$73,475
Housing units without a mortgage
2,986 (2.4%)
303 (0.9%)
Housing units with both a second mortgage and home equity loan
3,696 (3%)
2,201 (6.5%)
Housing units with a mortgage
121,099 (97.6%)
33,694 (99.1%)
Housing units with a home equity loan
66 (0.1%)
0 (0%)
Housing units with a second mortgage
5,171 (4.2%)
2,899 (8.5%)
House/condo owner moved in on average (years ago)
8
11
House/condo renter moved in on average (years ago)
1
3
Housing units lacking complete kitchen facilities
1.8%
1.5%
Housing units lacking complete plumbing facilities
0.7%
0.6%
Housing units in structures
Housing units in structures
Fort Worth
Chula Vista
One, detached
65.4%
53.2%
One, attached
2.9%
13.4%
Two
1.6%
1.3%
3 or 4
4.1%
4.9%
5 to 9
5.8%
3.8%
10 to 19
6.5%
5.7%
20 to 49
4.6%
5.0%
50 or more
7.0%
8.3%
Mobile homes
2.1%
4.3%
Boats, RVs, vans, etc.
0.0%
0.1%
Median real estate property taxes paid for housing units
Self-employed workers in own not incorporated business
27,257
9,347
State government workers
8,587
7,115
Unpaid family workers
392
174
Industries and Occupations
The key industries in Fort Worth include aviation, defense, healthcare, oil, and gas, whereas in Chula Vista the top industries are tourism, telecommunication, and public administration. Occupations in Fort Worth are largely in management, business, sciences, and arts, with a considerable portion dedicated to sales and office work. Chula Vista’s major occupations are within the management, business, science, arts, and service sectors. Both cities offer diverse job opportunities, although the specific industries differ.
Both cities offer robust health care facilities. Fort Worth houses the reputable Baylor Scott & White All Saints Medical Center and Texas Health Harris Methodist Hospital. Chula Vista, on the other hand, boasts the highly-rated Scripps Mercy Hospital Chula Vista and Sharp Chula Vista Medical Center. Both cities give residents numerous options for primary and specialized healthcare.
Health (county statistics)
Type
Fort Worth
Chula Vista
General health status score of residents in this county from 1 (poor) to 5 (excellent)
Infrastructure-wise, both Fort Worth and Chula Vista offer a good degree of development. Fort Worth has an extensive network of freeways and tollways along with good air connectivity through the Dallas/Fort Worth International Airport. Chula Vista is served by two major freeways and the Brown Field Municipal Airport. Both cities also offer well-maintained public utilities and telecommunication networks.
Infrastructure
Type
Fort Worth
Chula Vista
Hospitals
76
3
TV stations
25
12
Bank branches located here
175
41
Bank institutions located here
42
15
Drinking water stations with no reported violations in the past
3
0
Drinking water stations with reported violations in the past
HMDA - Conventional home purchase loans - Applications denied
Year
Fort Worth
Chula Vista
1999
3,575
603
2000
2,473
217
2001
2,109
191
2002
1,701
242
2003
2,183
1,205
2004
3,202
2,345
2005
4,261
2,433
2006
4,161
1,869
2007
2,871
1,389
2008
1,256
749
2009
585
300
Culture and Food
Culturally, Fort Worth offers a unique blend of western heritage and vibrant arts. It is renowned for its stockyards and cowboy culture, yet also boasts world-class art museums. The city has a diverse food scene, with barbecue and Tex-Mex being notable. Chula Vista, with its significant Hispanic population, incorporates a multicultural vibe. The city is known for its Mexican cuisine, along with seafood and Cali-Baja flavors. Chula Vista also hosts numerous festivals and concerts, highlighting its vibrant art and music scene.
Sports Teams
Sports fanatics will find plenty to cheer about in both cities. Fort Worth’s close proximity to Dallas means easy access to teams like the Dallas Cowboys (NFL), Texas Rangers (MLB), and Dallas Mavericks (NBA). Chula Vista residents can cheer for San Diego Padres (MLB) and San Diego Seals (NLL). Both cities also offer opportunities for participation in sports at all levels, from youth to adult leagues.


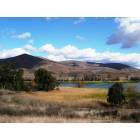


 Fort Worth, TX
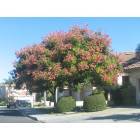
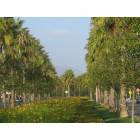
 Chula Vista, CA