Comparing and contrasting Fort Worth, Texas, and Stockton, California, presents two distinct experiences in terms of climate, culture, economy, and lifestyle. While both cities have their unique charm, differences can be seen from numerous criteria such as crime and safety to public infrastructure and healthcare. This comparison would provide a vivid snapshot of how living or visiting either city might feel, focusing on specific factors such as education, work, major industries, real estate, taxation, and geographical conditions.
Distance between
Fort Worth, TX and
Stockton, CA : 1,393.7 miles
Fort Worth's population is larger by 190%. Its population has grown by 400,814 people (75.0%) since 2000. The population of Stockton has grown by 78,349 people (32.1%) during that time.
In terms of safety, both cities have areas of concern, like any urban area. However, Fort Worth has a lower crime rate than Stockton, making it comparatively safer. Fort Worth's crime rate is lower than the national average, while Stockton’s is higher. Tourists and locals alike should still exercise caution and good judgement in both cities.
City-data.com crime index counts serious crimes and violent crime more heavily. It adjusts for the number of visitors and daily workers commuting into cities. (higher means more crime, U.S. average = 301.1)
City-data.com crime index counts serious crimes and violent crime more heavily. It adjusts for the number of visitors and daily workers commuting into cities. (higher means more crime, U.S. average = 301.1)
Sex Offenders
According to our data, there are 3,166 registered sex offenders living in Fort Worth and 958 registered sex offenders living in . The ratio of residents to sex offenders in Fort Worth is 270 to 1; the ratio in Stockton is 321 to 1. The number of registered sex offenders compared to the number of residents in Fort Worth is near to than in Stockton.
Cost of Living
Living in Fort Worth is generally less expensive than in Stockton. Housing tends to be more affordable in Fort Worth, and overall, the cost of living index in Fort Worth is less than the national average, while in Stockton, it's above the national average.
Income Tax
While California charges a state income tax with several brackets, Texas has no state income tax, a fact that might make Fort Worth more appealing to some individuals and businesses.
Property Tax
Texas has a higher property tax rate than California, so while houses may be cheaper to buy in Fort Worth, the ongoing cost could be higher than in Stockton.
Sales Tax
Texas boasts a lower state sales tax than California, which can make everyday purchases slightly cheaper for residents of and visitors to Fort Worth. However, California's taxation system does have a more progressive structure in terms of income tax.
Income
Type
Fort Worth
Stockton
Estimated median household income
$68,235
$69,844
Estimated per capita income
$34,106
$26,811
Cost of living index (U.S. average is 100)
95.4
99.1
If you make $50,000 in Fort Worth, you will have to make $51,939 in Stockton to maintain the same standard of living.
Geographical Conditions
Fort Worth’s topography is flat with some rolling hills – a typical Texas landscape, while Stockton is located in California's central valley, surrounded by fertile farmland and close to both mountains and the sea.
Both cities house universities and colleges, offering good education opportunities. Fort Worth is home to Texas Christian University and other institutions while Stockton is home to the University of the Pacific. However, Fort Worth’s school district is rated higher in overall performance compared to Stockton’s.
Fort Worth has a robust economy with a focus on sectors like technology, aviation, healthcare, and logistics. Meanwhile, Stockton's economy is based on agriculture and food manufacturing, but it also has a growing sector in logistics and has been noted for its renewable energy industry.
Biggest Employers
The American Airlines Group, Lockheed Martin, and the local school district are among the biggest employers in Fort Worth. In Stockton, major employers include San Joaquin County, St. Joseph's Medical Center, and the local school district.
There were 7,236 building permits issued in Fort Worth in 2012 (4810 more than in 2011) compared to 548 building permits issued in Stockton in 2012 (421 more than in 2011).
In Fort Worth (Tarrant County), 41.4% voted for Democrats and 57.1% for Republicans in 2012 Presidential Election. In Stockton (San Joaquin County), 55.6% voted for Democrats and 41.9% for Republicans.
Elections
Type
Democrats
Republicans
Other
Year
Fort Worth
Stockton
Fort Worth
Stockton
Fort Worth
Stockton
2020
49.3%
55.6%
49.1%
41.8%
1.6%
2.6%
2016
43.2%
53.4%
51.8%
39.2%
5.0%
7.5%
2012
41.4%
55.6%
57.1%
41.9%
1.4%
2.5%
2008
43.8%
54.2%
55.5%
43.6%
0.7%
2.2%
2004
37.0%
46.3%
62.5%
53.7%
0.5%
0.0%
2000
36.9%
47.9%
60.9%
49.1%
2.3%
3.0%
1996
41.6%
46.3%
50.9%
44.9%
7.5%
8.8%
Breakdown of population affiliated with a religious congregation
Type
Adherents
Congregations
Religion
Fort Worth
Stockton
Fort Worth
Stockton
SOUTHERN BAPTIST CONVENTION
17.3%
1.1%
33.3%
10.2%
CATHOLIC CHURCH
11.1%
26.8%
1.9%
4.0%
MUSLIM ESTIMATE
2.2%
1.5%
0.9%
2.0%
LUTHERAN CHURCH
0.5%
0.4%
0.9%
1.1%
SEVENTH DAY ADVENTIST CHURCH
0.4%
0.7%
1.6%
3.1%
EPISCOPAL CHURCH
0.3%
0.1%
0.8%
0.7%
CHRISTIAN REFORMED CHURCH NORTH AMERICA
0.0%
0.4%
0.1%
1.3%
Weather
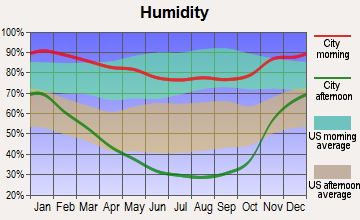
Fort Worth's climate is humid subtropical, with hot, humid summers and mild to cool winters. Stockton, on the other hand, experiences a Mediterranean climate with hot, dry summers and mild, wet winters. If you prefer year-round warmth and sunshine, Fort Worth might be your choice, but if you enjoy a cooler, more varied climate you might lean towards Stockton.
Weather and climate
Type
Fort Worth
Stockton
Temperature - Average
65°F
60.9°F
Humidity - Average morning or afternoon humidity
71.4%
63.2%
Humidity - Differences between morning and afternoon humidity
34.1%
59%
Humidity - Maximum monthly morning or afternoon humidity
82.1%
86%
Humidity - Minimum monthly morning or afternoon humidity
48%
27%
Precipitation - Yearly average
35 in
16.6 in
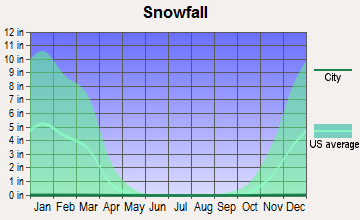
Snowfall - Yearly average
4.2 in
0 in
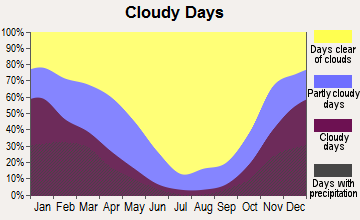
Clouds - Number of days clear of clouds
22.8%
30.7%
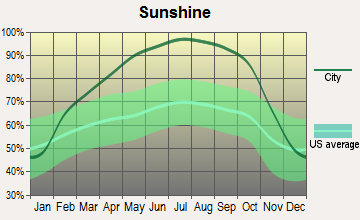
Sunshine amount - Average
66.6%
81.6%
Sunshine amount - Differences during a year
20%
44.4%
Sunshine amount - Maximum monthly
74%
91.9%
Sunshine amount - Minimum monthly
54%
47.5%
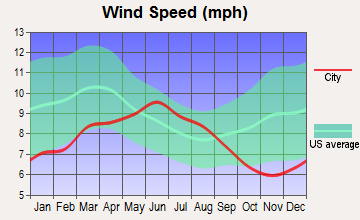
Wind speed - Average
10.3 mph
8.3 mph
Average climate in Fort Worth, Texas
Average climate in Stockton, California
Air pollution
Type
AQI
CO
NO2
OZONE
PB
PM10
PM25
SO2
Year
Fort Worth
Stockton
Fort Worth
Stockton
Fort Worth
Stockton
Fort Worth
Stockton
Stockton
Stockton
Fort Worth
Stockton
Fort Worth
Stockton
2018
67
124
N/A
0.30
5.8
12.2
27.1
23.2
0.006
N/A
30.5
N/A
N/A
16.5
N/A
0.8
2017
67
108
N/A
0.29
6.2
11.3
27.2
23.4
0.005
N/A
27.4
N/A
N/A
12.3
N/A
1.5
2016
56
111
N/A
0.26
6.3
12.2
25.5
21.7
0.005
N/A
22.2
N/A
N/A
12.7
N/A
1.5
2015
61
113
N/A
0.27
6.5
11.9
24.8
24.0
0.005
N/A
26.3
N/A
N/A
12.7
N/A
1.0
2014
56
109
0.22
0.26
6.8
13.4
26.6
26.1
0.005
N/A
26.9
N/A
N/A
11.5
N/A
0.8
2013
64
111
0.25
0.31
6.4
15.5
26.5
23.8
0.005
N/A
29.8
N/A
N/A
15.7
N/A
0.6
2012
87
114
0.26
0.19
7.8
14.4
30.3
24.2
0.005
N/A
24.0
N/A
N/A
12.4
N/A
0.7
2011
79
105
0.23
0.25
7.9
15.5
30.7
22.1
0.003
N/A
23.5
N/A
N/A
12.6
N/A
0.9
2010
70
96
0.23
0.14
8.5
13.9
27.7
21.9
0.003
N/A
14.0
N/A
N/A
9.1
N/A
1.1
2009
81
98
0.25
0.20
8.7
15.3
29.5
21.1
0.005
N/A
15.8
N/A
N/A
6.0
N/A
1.0
2008
69
107
0.25
0.26
9.6
16.8
25.8
22.7
N/A
N/A
24.7
N/A
N/A
10.2
N/A
1.1
2007
75
110
0.30
0.34
10.6
16.4
24.6
21.5
0.009
N/A
19.5
N/A
N/A
12.5
N/A
1.1
2006
90
94
0.34
0.41
10.2
18.4
29.7
22.1
N/A
N/A
N/A
N/A
N/A
N/A
N/A
2.1
2005
102
81
0.34
0.44
10.9
17.2
28.4
20.1
N/A
N/A
N/A
N/A
11.3
N/A
0.9
2.0
2004
78
82
0.39
0.47
10.6
17.1
25.4
19.9
N/A
N/A
25.2
N/A
N/A
N/A
N/A
1.6
2003
82
89
0.40
0.55
11.1
18.4
27.2
19.1
N/A
N/A
26.1
N/A
N/A
N/A
N/A
2.2
2002
94
86
0.37
0.53
11.8
20.5
25.8
18.9
0.007
N/A
29.2
N/A
N/A
N/A
N/A
2.5
2001
16
97
0.48
0.54
N/A
19.4
N/A
19.7
0.006
N/A
28.3
N/A
N/A
N/A
N/A
2.1
2000
17
99
0.55
0.64
N/A
21.2
N/A
18.9
0.007
N/A
25.9
N/A
N/A
N/A
N/A
1.6
Natural disasters
Type
Fort Worth
Stockton
Tornado activity compared to U.S. average
249.6%
10.1%
Earthquake activity compared to U.S. average
562.8%
8,060.1%
Natural disasters compared to U.S. average
23%
20%
Transportation
Both cities have public transportation systems, but Fort Worth has a more developed network that includes buses, a commuter rail, and bike-sharing programs. Stockton also has a public transportation network, primarily consisting of buses.
Transport
Type
Fort Worth
Stockton
Amtrak stations
1
2
Amtrak stations nearby
1
3
FAA registered aircraft
2
146
FAA registered aircraft manufacturers and dealers
19
9
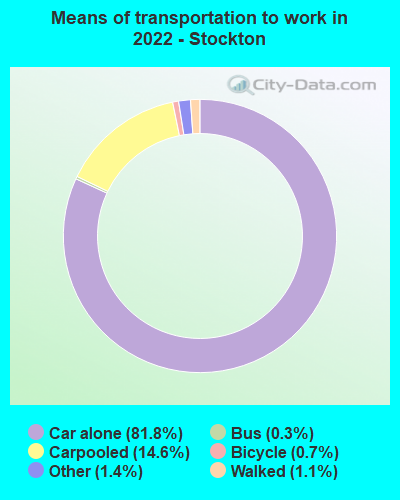
Means of transportation to work
Type
Fort Worth
Stockton
Bicycle
0.1%
0.2%
Bus
0.4%
0.6%
Carpooled
11%
13.3%
Car alone
85.8%
83.6%
Ferryboat
0%
0.1%
Motorcycle
0.1%
0.1%
Railroad
0%
0.1%
Walked
1.3%
1%
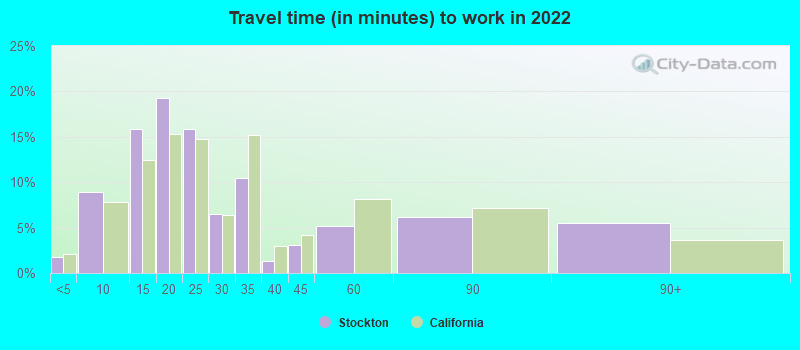
Average travel time to work
Type
Fort Worth
Stockton
Average
28.5 min
29.9 min
Other means
25.3 min
26.4 min
Public transportation
41.8 min
44.5 min
Private vehicle occupancy
Type
Fort Worth
Stockton
Average
1.2
1.2
Drove alone
87.6%
86.7%
In 2 person carpool
8.5%
8.9%
In 3 person carpool
2.5%
2.5%
In 4 person carpool
1.1%
0.7%
In 5-6 person carpool
0.3%
1%
In 7+ person carpool
0.1%
0.3%
How many people usually rode to work in the car, truck or van.
Real Estate
Homes in Fort Worth generally carry a lower price tag than those in Stockton. The median home cost in Fort Worth is significantly less than in Stockton, which could make it more attractive for potential homeowners.
Neighborhoods
Both cities boast diverse neighborhoods ranging from lively downtown areas to quieter suburban enclaves. Fort Worth’s Sundance Square and Cultural District are particularly popular, while in Stockton, the Miracle Mile and Brookside neighborhoods are favorites among locals and visitors.
Houses and residents
Type
Fort Worth
Stockton
Houses
361,341
102,642
Average household size (people)
2.8
3.2
Median year apartment built
1991
1977
Median year house/condo built
1995
1983
Length of stay in the house since moving in
11.2 years
13.2 years
Houses occupied
334,286 (92.5%)
97,447 (94.9%)
Houses occupied by owners
185,197 (55.4%)
53,081 (54.5%)
Houses occupied by renters
149,089 (44.6%)
44,366 (45.5%)
Median rent asked for vacant for-rent units
$1,068
$586.05
Median monthly housing costs
$1,328
$1,381
Median price asked for vacant for-sale houses and condos
$288,576
$363,278
Estimated median house or condo value
$249,000
$382,900
Median numbers of rooms
5.3
5.3
Median number of rooms in apartments
4.2
4.4
Median number of rooms in houses and condos
6.3
6.2
Median house price - detached houses
$279,885
$374,875
Median house price - in 2-unit structures
Over $1,000,000
$434,326
Median house price - in 3-to-4-unit structures
$337,081
$234,826
Median house price - in 5 or more unit structures
$298,062
$243,924
Median house price - mobile homes
$58,470
$146,499
Median house price - Townhouses or other attached units
$279,957
$256,924
Median house price - All housing units
$279,281
$367,426
Median house age
29
42
Renting percentage
40.8%
48.4%
Housing density (houses/condos per square mile)
1,235.2
1,876.1
House value disparities
31.8%
23.2%
Household income disparities
43.6%
42.3%
Median household income for houses/condes with a mortgage
$106,170
$102,856
Median household income for apartments without a mortgage
$72,147
$70,897
Housing units without a mortgage
2,986 (2.4%)
338 (0.9%)
Housing units with both a second mortgage and home equity loan
3,696 (3%)
2,064 (5.6%)
Housing units with a mortgage
121,099 (97.6%)
36,674 (99.1%)
Housing units with a home equity loan
66 (0.1%)
329 (0.9%)
Housing units with a second mortgage
5,171 (4.2%)
2,814 (7.6%)
House/condo owner moved in on average (years ago)
8
11
House/condo renter moved in on average (years ago)
1
4
Housing units lacking complete kitchen facilities
1.8%
2.3%
Housing units lacking complete plumbing facilities
0.7%
1%
Housing units in structures
Housing units in structures
Fort Worth
Stockton
One, detached
65.4%
68.0%
One, attached
2.9%
6.7%
Two
1.6%
2.6%
3 or 4
4.1%
5.0%
5 to 9
5.8%
4.2%
10 to 19
6.5%
4.3%
20 to 49
4.6%
3.3%
50 or more
7.0%
4.6%
Mobile homes
2.1%
1.3%
Boats, RVs, vans, etc.
0.0%
0.1%
Median real estate property taxes paid for housing units
Self-employed workers in own not incorporated business
27,257
7,637
State government workers
8,587
6,210
Unpaid family workers
392
95
Industries and Occupations
In Fort Worth, the most popular occupations are in management, sales, and administrative roles. In Stockton, farming, fishing, and forestry occupations are more common, along with office and administrative support roles.
Both cities have numerous quality healthcare facilities. However, Fort Worth has more nationally recognized hospitals and medical centers which make it a hub for healthcare in the South.
Both cities have established infrastructure systems, with Fort Worth's highway system being particularly praised. Stockton also boasts a strong infrastructure, particularly notable for its ports and railways which are essential to its economy.
Infrastructure
Type
Fort Worth
Stockton
Hospitals
76
17
TV stations
25
14
Arenas or stadiums
7
2
Bank branches located here
175
54
Bank institutions located here
42
19
Main business address for public companies
24
2
Drinking water stations with no reported violations in the past
3
14
Drinking water stations with reported violations in the past
HMDA - Conventional home purchase loans - Applications denied
Year
Fort Worth
Stockton
1999
3,575
548
2000
2,473
606
2001
2,109
597
2002
1,701
622
2003
2,183
1,557
2004
3,202
2,481
2005
4,261
3,201
2006
4,161
3,075
2007
2,871
1,611
2008
1,256
744
2009
585
362
Culture and Food
Fort Worth offers a unique blend of cowboy culture coupled with a burgeoning arts scene. The city is also renowned for its barbecue and Tex-Mex cuisine. On the other hand, Stockton offers a cultural mix of its agricultural heritage combined with its location in the Pacific Rim. Its food reflects its diverse population with Mexican, Asian, and farm-to-table cuisines being prevalent.
Sports Teams
Sports enthusiasts have plenty to cheer for in both cities. Fort Worth shares teams with Dallas in the NFL, NBA, and MLB. Stockton has minor league baseball and hockey teams and is just an hour from San Francisco and Oakland's major professional sporting teams.


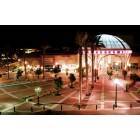
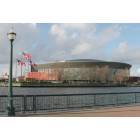

 Fort Worth, TX
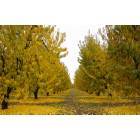
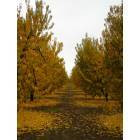
 Stockton, CA