Moving from one city to another requires a good understanding of the differences and potential trade-offs. Both Memphis, TN, and Corpus Christi, TX, have unique features that might appeal to different individuals. The two cities diverge significantly in aspects like crime and safety, weather, cost of living, education, and overall economic environment. While Memphis is well recognized for its cultural influence, Corpus Christi stands out for its favorable weather and access to beachfront.
Distance between
Memphis, TN and
Corpus Christi, TX : 671.5 miles
Memphis's population is larger by 98%. Its population has decreased by 21,973 people (3.4%) since 2000. The population of Corpus Christi has grown by 40,319 people (14.5%) during that time.
Memphis, TN, has a relatively high crime rate compared to the national average. Some areas of the city have higher crime rates than others, but strides are being made by local authorities to improve safety. On the other hand, Corpus Christi, TX, has a crime rate that's lower than the national average. Safety is a strong point for Corpus Christi, making it a more appealing option for those concerned about crime rates.
City-data.com crime index counts serious crimes and violent crime more heavily. It adjusts for the number of visitors and daily workers commuting into cities. (higher means more crime, U.S. average = 301.1)
City-data.com crime index counts serious crimes and violent crime more heavily. It adjusts for the number of visitors and daily workers commuting into cities. (higher means more crime, U.S. average = 301.1)
Sex Offenders
According to our data, there are 2,628 registered sex offenders living in Memphis and 1,068 registered sex offenders living in . The ratio of residents to sex offenders in Memphis is 248 to 1; the ratio in Corpus Christi is 305 to 1. The number of registered sex offenders compared to the number of residents in Memphis is near to than in Corpus Christi.
Cost of Living
The cost of living in Memphis is relatively low compared to the national average, making it a cost-effective option for relocation. Corpus Christi also boasts a lower-than-average cost of living, but it is slightly more expensive than Memphis. Both cities offer affordable living options, although the actual cost can vary substantially depending on the specific neighborhood and lifestyle preferences.
Income Tax
There's a significant advantage for Corpus Christi residents in this regard, as Texas doesn't impose a state income tax. Tennessee, however, does have a state income tax.
Property Tax
Property taxes in Memphis are quite high, with the city having one of the highest rates in Tennessee. On the other hand, Texas also has high property tax rates, making Corpus Christi comparable to Memphis in this regard.
Sales Tax
Tennessee, including Memphis, has a relatively high sales tax rate, which can impact the overall cost of living. Texas is also known for its high-sales tax, making the rates in Corpus Christi comparable to those in Memphis.
Income
Type
Memphis
Corpus Christi
Estimated median household income
$44,317
$59,812
Estimated per capita income
$28,571
$29,969
Cost of living index (U.S. average is 100)
85.5
86.6
If you make $50,000 in Memphis, you will have to make $50,643 in Corpus Christi to maintain the same standard of living.
Geographical Conditions
Memphis, located along the Mississippi River, is landlocked and has a flat topography. Conversely, Corpus Christi is a coastal city with beautiful beaches and islands near the Gulf of Mexico.
Memphis offers a range of education options, including several renowned universities like the University of Memphis and Rhodes College. Corpus Christi also has commendable educational institutions, including Texas A&M University-Corpus Christi. However, the education system in Memphis is generally considered more robust due to the availability of both private and public school options.
The economy of Memphis is diverse, with significant sectors being transportation, healthcare, manufacturing, and professional services. Conversely, the economy of Corpus Christi is more focused around energy, defense, and tourism. Job seekers could find better prospects in either city depending on their professional specialization and industry preference.
Biggest Employers
In Memphis, some of the biggest employers include FedEx, Methodist Le Bonheur Healthcare, and AutoZone. In Corpus Christi, top employers include the Corpus Christi Independent School District, CHRISTUS Spohn Health System, and the Naval Air Station Corpus Christi.
In Memphis (Shelby County), 62.9% voted for Democrats and 36.7% for Republicans in 2012 Presidential Election. In Corpus Christi (Nueces County), 47.6% voted for Democrats and 51.0% for Republicans.
Elections
Type
Democrats
Republicans
Other
Year
Memphis
Corpus Christi
Memphis
Corpus Christi
Memphis
Corpus Christi
2020
64.8%
47.9%
34.2%
50.8%
1.1%
1.4%
2016
62.3%
47.2%
34.7%
48.8%
3.1%
4.0%
2012
62.9%
47.6%
36.7%
51.0%
0.4%
1.4%
2008
63.8%
47.4%
36.2%
51.8%
0.0%
0.8%
2004
57.7%
42.6%
42.0%
56.9%
0.3%
0.4%
2000
56.8%
46.7%
42.3%
51.4%
0.9%
1.9%
1996
78.9%
53.7%
19.6%
40.2%
1.5%
6.1%
Breakdown of population affiliated with a religious congregation
Type
Adherents
Congregations
Religion
Memphis
Corpus Christi
Memphis
Corpus Christi
SOUTHERN BAPTIST CONVENTION
14.8%
10.6%
15.1%
28.6%
CATHOLIC CHURCH
6.5%
32.8%
2.7%
10.8%
EVANGELICAL PRESBYTERIAN CHURCH
1.5%
0.0%
0.7%
0.0%
EPISCOPAL CHURCH
0.8%
0.8%
1.8%
2.0%
MUSLIM ESTIMATE
0.5%
0.7%
0.8%
0.3%
LUTHERAN CHURCH
0.4%
0.5%
1.0%
1.7%
PRESBYTERIAN CHURCH IN AMERICA
0.4%
0.0%
0.6%
0.6%
SEVENTH DAY ADVENTIST CHURCH
0.4%
0.2%
0.9%
0.9%
SALVATION ARMY
0.0%
0.5%
0.2%
0.3%
Weather
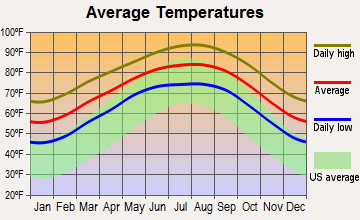
Weather is another area where the two cities contrast significantly. Memphis experiences hot, humid summers and mild, wet winters. Corpus Christi, situated on the Texas Gulf Coast, boasts a humid, subtropical climate, with hot summers and mild to warm winters. Corpus Christi offers more beach-friendly weather year-round, which could be especially attractive for tourists and individuals with an affinity for outdoor activities.
Weather and climate
Type
Memphis
Corpus Christi
Temperature - Average
61.9°F
71.5°F
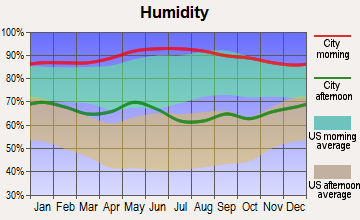
Humidity - Average morning or afternoon humidity
74%
81.5%
Humidity - Differences between morning and afternoon humidity
33%
37%
Humidity - Maximum monthly morning or afternoon humidity
85%
93%
Humidity - Minimum monthly morning or afternoon humidity
52%
56%
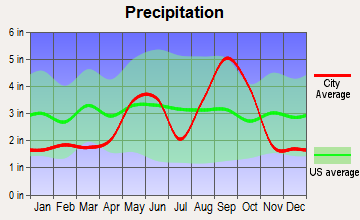
Precipitation - Yearly average
54.3 in
32.6 in
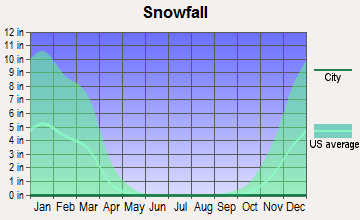
Snowfall - Yearly average
8.6 in
0.2 in
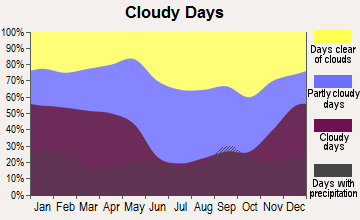
Clouds - Number of days clear of clouds
19.7%
17%
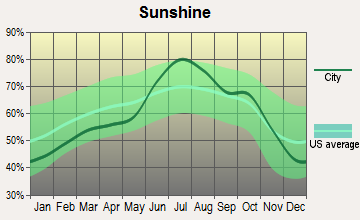
Sunshine amount - Average
68.7%
64.5%
Sunshine amount - Differences during a year
24%
36%
Sunshine amount - Maximum monthly
74%
79%
Sunshine amount - Minimum monthly
50%
43%
Wind speed - Average
8.8 mph
12.7 mph
Average climate in Memphis, Tennessee
Average climate in Corpus Christi, Texas
Air pollution
Type
AQI
CO
NO2
OZONE
PM10
PM25
SO2
Year
Memphis
Corpus Christi
Memphis
Memphis
Memphis
Corpus Christi
Memphis
Memphis
Corpus Christi
Memphis
Corpus Christi
2018
81
89
0.24
N/A
10.4
N/A
27.1
23.9
19.0
N/A
8.1
9.2
0.4
0.4
2017
74
70
0.24
N/A
10.2
N/A
28.1
27.3
17.5
N/A
7.9
8.7
0.3
0.4
2016
76
59
0.24
N/A
10.2
N/A
28.8
26.9
19.6
N/A
8.5
8.1
0.9
0.5
2015
77
75
0.26
N/A
11.1
N/A
26.9
25.9
N/A
N/A
9.2
9.3
1.0
0.3
2014
75
75
0.27
N/A
10.1
N/A
26.5
26.1
N/A
N/A
9.9
9.3
1.3
0.2
2013
74
80
0.31
N/A
8.3
N/A
26.6
27.3
N/A
N/A
10.2
8.6
1.0
0.2
2012
94
78
0.32
N/A
9.3
N/A
29.7
28.6
N/A
N/A
10.7
8.9
0.6
0.2
2011
93
80
0.34
N/A
10.0
N/A
29.0
29.3
N/A
N/A
11.1
10.0
0.5
0.3
2010
95
85
0.43
N/A
10.3
N/A
27.9
27.9
N/A
N/A
12.9
9.7
N/A
0.5
2009
86
72
0.35
N/A
8.7
N/A
24.9
26.3
N/A
N/A
11.8
9.9
N/A
0.4
2008
94
82
0.36
N/A
10.3
N/A
26.3
26.4
N/A
N/A
13.2
10.0
N/A
0.6
2007
106
85
0.47
N/A
11.2
N/A
26.7
25.3
N/A
N/A
14.8
10.3
5.6
0.5
2006
108
88
0.43
N/A
13.0
N/A
26.8
27.0
N/A
N/A
14.7
10.3
6.3
0.7
2005
110
81
0.46
N/A
10.1
N/A
26.9
24.8
N/A
N/A
17.9
10.3
4.9
1.1
2004
98
74
0.51
N/A
N/A
N/A
24.9
26.8
N/A
N/A
14.5
N/A
5.9
1.3
2003
110
88
0.57
N/A
20.1
N/A
25.3
27.0
N/A
N/A
15.0
N/A
5.8
1.0
2002
110
88
0.58
N/A
20.4
N/A
25.1
27.6
15.6
N/A
N/A
N/A
4.5
0.9
2001
111
85
0.66
N/A
24.7
N/A
26.0
26.5
22.7
N/A
N/A
N/A
6.1
1.2
2000
103
78
0.63
N/A
25.2
N/A
26.2
25.8
24.9
N/A
N/A
N/A
6.4
1.3
Natural disasters
Type
Memphis
Corpus Christi
Tornado activity compared to U.S. average
198.6%
68.2%
Earthquake activity compared to U.S. average
474%
52%
Natural disasters compared to U.S. average
18%
24%
Transportation
Memphis has public transportation, but it's somewhat limited, causing most residents to drive for commuting. Corpus Christi has a more developed public transportation system with the RTA providing bus service throughout the city. However, both cities are relatively car-dependent.
Transport
Type
Memphis
Corpus Christi
Amtrak stations
1
0
Amtrak stations nearby
1
0
FAA registered aircraft
1
298
FAA registered aircraft manufacturers and dealers
52
1
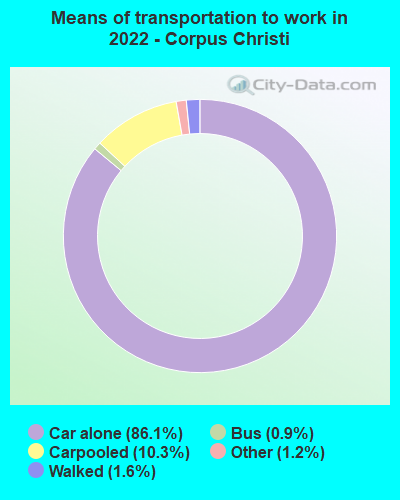
Means of transportation to work
Type
Memphis
Corpus Christi
Bicycle
0%
0.2%
Bus
0.4%
1.1%
Carpooled
7.5%
9.9%
Car alone
88.8%
86.5%
Motorcycle
0.1%
0.2%
Taxicab
0.1%
0.1%
Walked
1.2%
1.4%
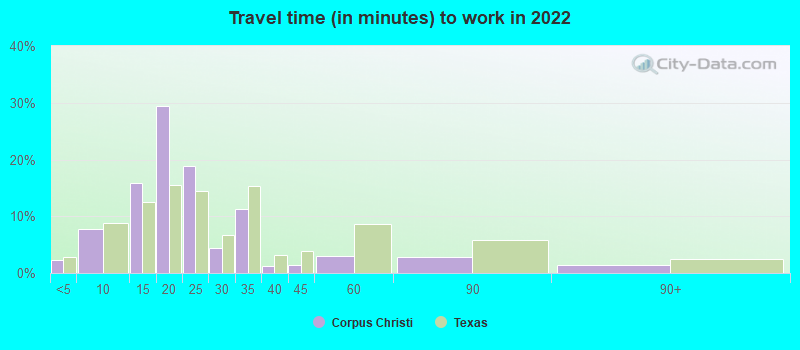
Average travel time to work
Type
Memphis
Corpus Christi
Average
27 min
21.4 min
Other means
22.5 min
20.1 min
Public transportation
43.5 min
37.6 min
Private vehicle occupancy
Type
Memphis
Corpus Christi
Average
1.1
1.1
Drove alone
89.9%
90.4%
In 2 person carpool
7.9%
7.6%
In 3 person carpool
1.6%
1.2%
In 4 person carpool
0.4%
0.4%
In 5-6 person carpool
0.2%
0.3%
How many people usually rode to work in the car, truck or van.
Real Estate
Real estate in Memphis is quite affordable, with prices often falling below the national average. Corpus Christi's real estate is also reasonably priced, although slightly higher than Memphis. Corpus Christi also offers several waterfront properties, a feature lacking in Memphis.
Neighborhoods
Memphis provides a variety of neighborhoods, each with a distinctive character, from the vibrant downtown area to the historic charm of East Memphis. Corpus Christi has neighborhoods that offer coastal living, great for families who enjoy outdoor activities and beach life, like the Corpus Christi Bay Area.
Houses and residents
Type
Memphis
Corpus Christi
Houses
288,491
137,431
Average household size (people)
2.5
2.7
Median year apartment built
1972
1984
Median year house/condo built
1967
1981
Length of stay in the house since moving in
16.2 years
13.3 years
Houses occupied
256,968 (89.1%)
117,366 (85.4%)
Houses occupied by owners
119,622 (46.6%)
67,874 (57.8%)
Houses occupied by renters
137,346 (53.4%)
49,492 (42.2%)
Median rent asked for vacant for-rent units
$760.83
$1,470
Median monthly housing costs
$967
$1,102
Median price asked for vacant for-sale houses and condos
$201,932
$329,579
Estimated median house or condo value
$142,800
$171,500
Median numbers of rooms
5.5
4.9
Median number of rooms in apartments
4.8
4.1
Median number of rooms in houses and condos
6.6
5.6
Median house price - detached houses
$205,904
$212,792
Median house price - in 2-unit structures
Over $1,000,000
$219,111
Median house price - in 3-to-4-unit structures
$145,165
$270,664
Median house price - in 5 or more unit structures
$201,411
$270,817
Median house price - mobile homes
$93,577
$33,205
Median house price - occupied boats, rvs, vans etc.
$39,582
$66,701
Median house price - Townhouses or other attached units
$170,154
$168,101
Median house price - All housing units
$204,886
$210,115
Median house age
52
40
Renting percentage
48.1%
40.7%
Housing density (houses/condos per square mile)
1,032.8
888.7
House value disparities
44.1%
37.5%
Household income disparities
48.2%
45%
Median household income for houses/condes with a mortgage
$72,611
$84,755
Median household income for apartments without a mortgage
$53,615
$55,283
Housing units without a mortgage
1,461 (2%)
190 (0.5%)
Housing units with both a second mortgage and home equity loan
3,970 (5.4%)
1,163 (3.1%)
Housing units with a mortgage
71,386 (98%)
37,907 (99.5%)
Housing units with a home equity loan
322 (0.4%)
0 (0%)
Housing units with a second mortgage
5,907 (8.1%)
1,292 (3.4%)
House/condo owner moved in on average (years ago)
16
11
House/condo renter moved in on average (years ago)
1
1
Housing units lacking complete kitchen facilities
5.7%
2.9%
Housing units lacking complete plumbing facilities
4.6%
2.8%
Housing units in structures
Housing units in structures
Memphis
Corpus Christi
One, detached
61.0%
65.0%
One, attached
5.8%
1.6%
Two
2.1%
3.0%
3 or 4
7.4%
6.5%
5 to 9
9.1%
8.7%
10 to 19
5.6%
5.7%
20 to 49
1.8%
2.3%
50 or more
6.2%
4.1%
Mobile homes
0.8%
2.8%
Boats, RVs, vans, etc.
0.1%
0.3%
Median real estate property taxes paid for housing units
Self-employed workers in own not incorporated business
16,111
10,817
State government workers
7,650
6,884
Unpaid family workers
668
230
Industries and Occupations
In Memphis, transportation and warehousing are significant industries, largely due to the presence of FedEx's global hub. Corpus Christi, being a coastal city, has a strong presence in the oil and gas industry, plus a thriving tourism sector. The choice between the two cities would largely depend on one's career aspirations and industry preference.
Memphis has several top-rated hospitals, including the renowned St. Jude Children's Research Hospital. Corpus Christi also offers reliable healthcare, with the CHRISTUS Spohn Health System and Corpus Christi Medical Center being top healthcare providers.
Health (county statistics)
Type
Memphis
Corpus Christi
General health status score of residents in this county from 1 (poor) to 5 (excellent)
Memphis has a rich history, and this is reflected in its distinctive architectural and infrastructural styles, plus the older parts of the city can sometimes struggle with infrastructure challenges. On the other hand, Corpus Christi has seen significant infrastructural development in recent years, making the city more modern and convenient to navigate.
Infrastructure
Type
Memphis
Corpus Christi
Hospitals
35
34
TV stations
14
21
Arenas or stadiums
2
1
Bank branches located here
160
83
Bank institutions located here
33
17
Main business address for public companies
17
1
Drinking water stations with no reported violations in the past
0
1
Drinking water stations with reported violations in the past
HMDA - Conventional home purchase loans - Applications denied
Year
Memphis
Corpus Christi
1999
2,195
1,534
2000
2,406
814
2001
1,775
738
2002
1,444
631
2003
2,116
737
2004
3,266
1,013
2005
4,730
1,275
2006
5,833
1,217
2007
3,559
942
2008
1,174
546
2009
345
413
Culture and Food
Memphis boasts a rich cultural scene, known as the birthplace of soul and the home of blues, with many music festivals taking place throughout the year. The city also offers a renowned food scene, with a focus on barbecued cuisine. Corpus Christi's culture is influenced by its coastal location, with seafood being a staple, and its robust Hispanic population adds wonderful depth and diversity to its culinary and cultural offerings.
Sports Teams
From a sports perspective, Memphis has the Grizzlies NBA team and the Redbirds minor-league baseball team. Corpus Christi features the Hooks minor-league baseball team and the Ice Rays minor league hockey team.


 Memphis, TN
 Corpus Christi, TX