Comparing Mesa and Gilbert, we notice that both cities in Arizona possess distinctive experiences for residents and tourists alike. Mesa being the more populous and older city is widely recognized for its cultural heritage, art scene, elevated recreational facilities, and its higher cost of living. Gilbert, though smaller, boasts higher safety ratings, excellent school systems, and a dynamic food scene. It's considered an excellent place for families. Below, we will dive into the detailed comparison of these two cities focusing on various aspects.
Distance between
Mesa, AZ and
Gilbert, AZ : 4.7 miles
Mesa's population is larger by 87%. Its population has grown by 113,100 people (28.5%) since 2000. The population of Gilbert has grown by 163,439 people (149.0%) during that time.
Mesa's crime rates are marginally higher than the national average, skewing towards property crimes rather than violent crimes. On the other hand, Gilbert holds a reputation as one of the safest cities in Arizona, with crime rates notably below the national average, offering a safer environment for both residents and tourists.
City-data.com crime index counts serious crimes and violent crime more heavily. It adjusts for the number of visitors and daily workers commuting into cities. (higher means more crime, U.S. average = 301.1)
City-data.com crime index counts serious crimes and violent crime more heavily. It adjusts for the number of visitors and daily workers commuting into cities. (higher means more crime, U.S. average = 301.1)
Sex Offenders
According to our data, there are 635 registered sex offenders living in Mesa and 57 registered sex offenders living in . The ratio of residents to sex offenders in Mesa is 763 to 1; the ratio in Gilbert is 4,160 to 1. The number of registered sex offenders compared to the number of residents is much larger in Mesa than that in Gilbert.
Cost of Living
Both Mesa and Gilbert are more affordable when compared to the national average. However, the cost of living in Gilbert is slightly higher than in Mesa. This is indicative in areas like healthcare, housing, and groceries. The difference, though, is not overly drastic.
Income Tax
Arizona has a flat income tax rate, so residents of both Mesa and Gilbert pay the same rate of 4.5%.
Property Tax
Property tax rates are also comparable in both cities; however, due to higher property values in Gilbert, homeowners tend to pay more in property taxes.
Sales Tax
Both cities have similar sales tax rates with Mesa at 8.3% and Gilbert at 7.8%. These rates include the Arizona state sales tax of 5.6%.
Income
Type
Mesa
Gilbert
Estimated median household income
$69,266
$104,802
Estimated per capita income
$35,439
$44,911
Cost of living index (U.S. average is 100)
101
101.3
If you make $50,000 in Mesa, you will have to make $50,149 in Gilbert to maintain the same standard of living.
Geographical Conditions
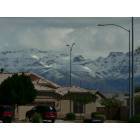
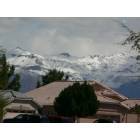
The geographical conditions in Mesa and Gilbert are similar, with both cities located within the Greater Phoenix region. However, Gilbert's closer location to the SanTan Mountains makes for somewhat richer scenery.
Gilbert’s school district consistently ranks amongst the best in the state, with many schools achieving high ratings. In contrast, Mesa, having a larger population, has a mixed range of school ratings, but there are still plenty of high-achieving schools within the district.
Mesa, being bigger, has a more diverse economy with job opportunities in education, healthcare, and aviation. Conversely, Gilbert has a lower unemployment rate, with healthcare, educational services, and retail trade being the most common industries.
Biggest Employers
In Mesa, the largest employers are Banner Health System, Mesa Public Schools, and the City of Mesa. For Gilbert, the most significant employers are Gilbert Public Schools, Banner Health, and the town of Gilbert.
There were 2,046 building permits issued in Mesa in 2012 (1543 more than in 2011) compared to 1,470 building permits issued in Gilbert in 2012 (71 less than in 2011).
Weather
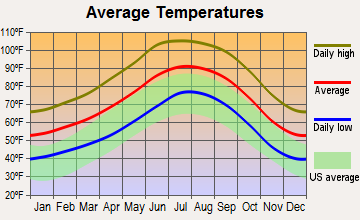
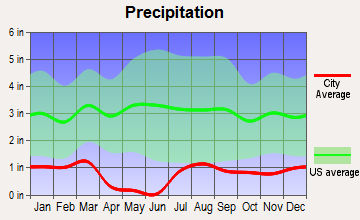
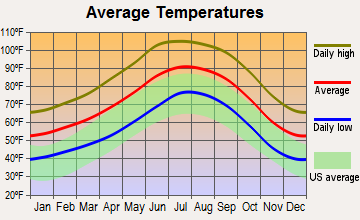
Both cities share an Arizona climate, suggesting hot summers, mild winters, and very little rainfall. However, Gilbert's proximity to the SanTan Mountains can mean slightly cooler temperatures than Mesa. Nonetheless, both cities enjoy more than 300 sunny days a year, and the climate is friendly to outdoor activities year-round.
Weather and climate
Type
Mesa
Gilbert
Temperature - Average
71.7°F
71.5°F
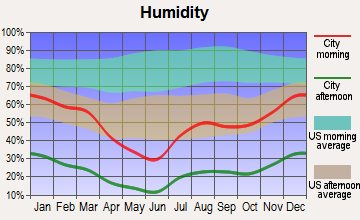
Humidity - Average morning or afternoon humidity
37.5%
37.5%
Humidity - Differences between morning and afternoon humidity
48%
48%
Humidity - Maximum monthly morning or afternoon humidity
60%
60%
Humidity - Minimum monthly morning or afternoon humidity
12%
12%
Precipitation - Yearly average
9.5 in
9.3 in
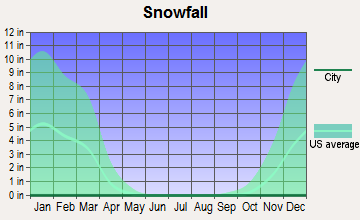
Snowfall - Yearly average
0 in
0 in
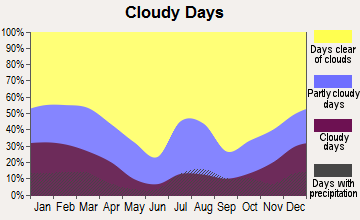
Clouds - Number of days clear of clouds
35.2%
35.2%
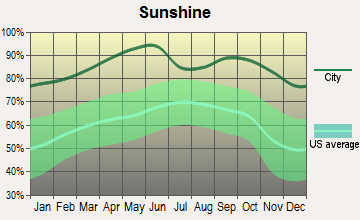
Sunshine amount - Average
92.8%
92.8%
Sunshine amount - Differences during a year
16%
16%
Sunshine amount - Maximum monthly
95%
95%
Sunshine amount - Minimum monthly
79%
79%
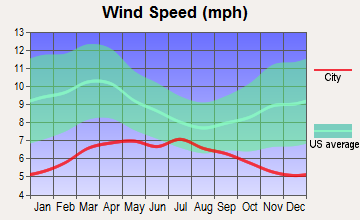
Wind speed - Average
6.6 mph
6.6 mph
Average climate in Mesa, Arizona
Average climate in Gilbert, Arizona
Air pollution
Type
AQI
CO
NO2
OZONE
PM10
PM25
SO2
Year
Mesa
Gilbert
Mesa
Gilbert
Mesa
Gilbert
Mesa
Gilbert
Mesa
Gilbert
Mesa
Gilbert
Mesa
Gilbert
2018
200
201
0.28
0.30
15.1
15.2
34.8
32.8
28.1
38.7
7.5
7.7
0.6
0.6
2017
128
131
0.28
0.33
15.8
15.9
35.1
33.0
24.5
37.2
8.2
7.9
1.4
1.4
2016
121
124
0.31
0.34
15.7
15.8
34.6
32.4
21.5
29.8
6.8
7.0
0.4
0.4
2015
104
104
0.34
0.38
17.6
17.6
33.4
31.3
17.7
25.1
6.8
7.1
0.9
0.9
2014
135
135
0.33
0.40
19.6
19.7
34.0
31.0
30.8
35.1
8.4
8.5
1.1
1.1
2013
141
142
0.31
0.35
19.9
20.0
34.8
32.1
29.3
35.0
5.8
7.1
0.9
0.9
2012
159
159
0.38
0.39
21.2
21.3
33.7
31.5
37.9
38.5
8.1
8.7
1.3
1.3
2011
205
205
0.31
0.36
18.5
18.8
34.1
31.7
40.4
39.6
9.5
9.5
0.9
0.9
2010
100
100
0.31
0.39
16.4
16.8
32.9
31.2
29.5
30.6
8.3
8.3
1.2
1.2
2009
109
109
0.33
0.42
16.6
17.0
32.3
31.1
37.8
38.4
N/A
N/A
1.0
1.1
2008
106
106
0.29
0.37
17.5
18.0
34.2
32.1
39.9
40.2
N/A
N/A
1.1
1.2
2007
134
135
0.43
0.43
19.3
19.9
31.0
30.0
50.6
53.0
N/A
N/A
1.9
1.9
2006
138
138
0.44
0.51
22.1
22.5
30.9
30.2
57.5
61.9
N/A
N/A
1.8
1.8
2005
109
109
0.49
0.57
22.6
23.0
30.0
28.2
49.1
51.2
N/A
N/A
1.7
1.8
2004
97
97
0.51
0.58
22.4
22.8
30.4
28.0
33.4
33.5
N/A
N/A
1.4
1.4
2003
99
99
0.56
0.65
24.0
24.3
31.7
29.1
42.6
42.6
N/A
N/A
1.4
1.4
2002
110
110
0.69
0.75
24.9
25.2
28.0
28.0
41.8
41.8
N/A
N/A
1.6
1.6
2001
105
105
0.65
0.73
23.8
24.1
27.2
26.7
37.8
37.8
N/A
N/A
1.5
1.5
2000
117
117
0.76
0.73
29.8
29.7
27.1
27.3
45.6
45.6
N/A
N/A
1.7
1.7
Natural disasters
Type
Mesa
Gilbert
Tornado activity compared to U.S. average
18.1%
18.3%
Earthquake activity compared to U.S. average
2,348.6%
2,340.4%
Natural disasters compared to U.S. average
16%
16%
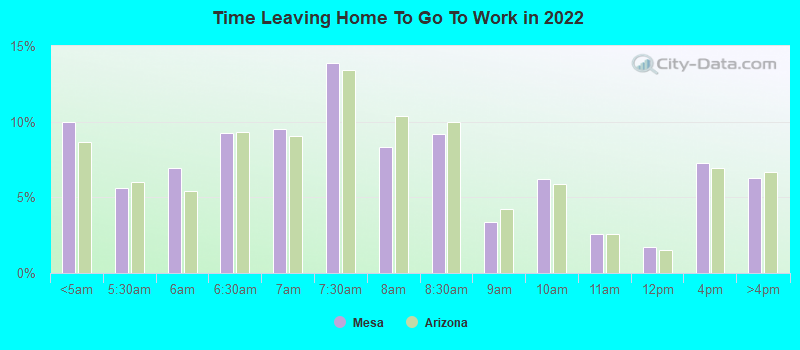
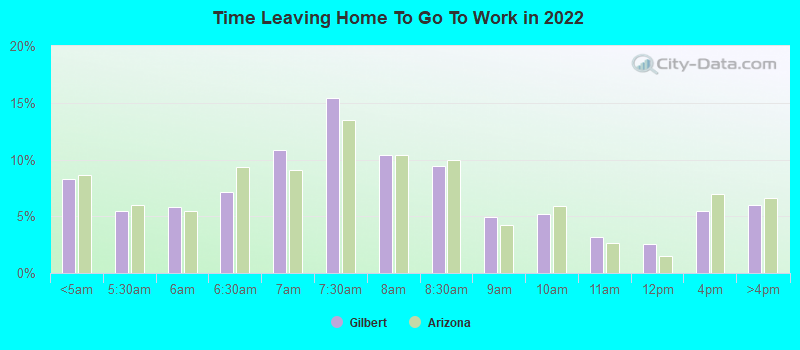
Transportation
Both cities have well-developed public transit systems. While Mesa has a light rail system, Gilbert residents often rely on buses and cars. Commuting times are comparable in both cities although the average commute time in Gilbert is somewhat less than in Mesa.
Transport
Type
Mesa
Gilbert
Amtrak stations nearby
2
2
FAA registered aircraft
828
235
FAA registered aircraft manufacturers and dealers
20
5
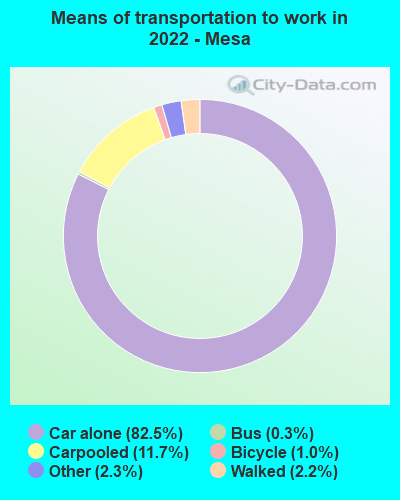
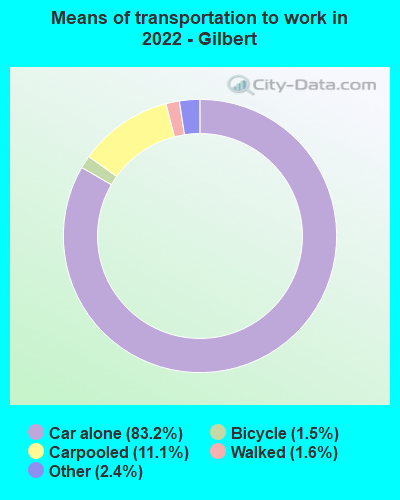
Means of transportation to work
Type
Mesa
Gilbert
Bicycle
0.6%
0.9%
Bus
0.3%
0.4%
Carpooled
14.4%
11.3%
Car alone
79.9%
84.2%
Motorcycle
0.5%
0.5%
Walked
2.5%
1.6%
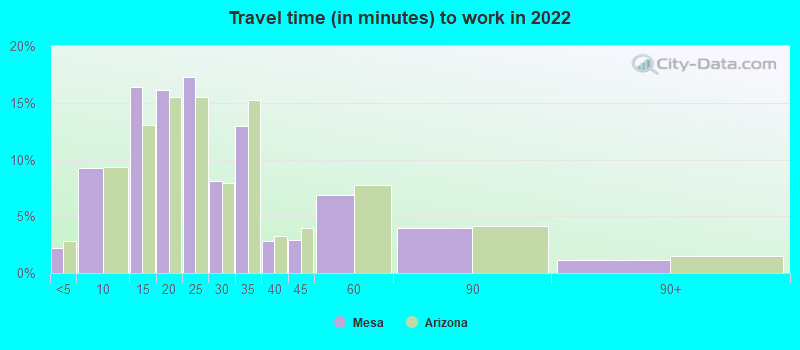
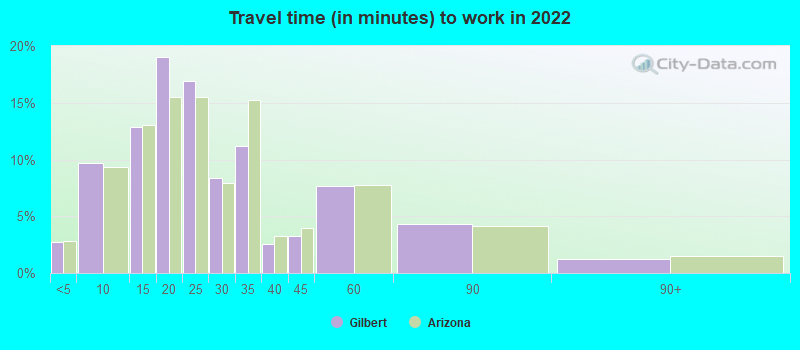
Average travel time to work
Type
Mesa
Gilbert
Average
25 min
24.4 min
Other means
26.9 min
29.5 min
Public transportation
45.9 min
54.2 min
Private vehicle occupancy
Type
Mesa
Gilbert
Average
1.2
1.1
Drove alone
85.8%
90.7%
In 2 person carpool
11.1%
7%
In 3 person carpool
2.1%
1.3%
In 4 person carpool
0.5%
0.5%
In 5-6 person carpool
0.5%
0.5%
How many people usually rode to work in the car, truck or van.
Real Estate
Property values in Gilbert are higher than in Mesa, indicative of the faster growth rate in Gilbert. Despite this, both cities offer diverse housing options from single-family homes to luxury estates.
Neighborhoods
Mesa boasts culturally rich and diverse neighborhoods. Downtown Mesa is popular for its arts and culture vibe. Gilbert also offers a variety of neighborhoods, with the East Valley neighborhood being very family-friendly and known for its high-quality amenities and parks.
Houses and residents
Type
Mesa
Gilbert
Houses
221,995
95,508
Average household size (people)
2.6
3
Median year apartment built
1987
2004
Median year house/condo built
1989
2002
Length of stay in the house since moving in
11.2 years
8.9 years
Houses occupied
199,112 (89.7%)
93,472 (97.9%)
Houses occupied by owners
126,146 (63.4%)
69,983 (74.9%)
Houses occupied by renters
72,966 (36.6%)
23,489 (25.1%)
Median rent asked for vacant for-rent units
$1,890
$2,843
Median monthly housing costs
$1,220
$1,709
Median price asked for vacant for-sale houses and condos
$262,297
$332,809
Estimated median house or condo value
$350,100
$484,600
Median numbers of rooms
5.2
6.3
Median number of rooms in apartments
4
4.5
Median number of rooms in houses and condos
5.9
6.8
Median house age
33
18
Renting percentage
36.8%
24.7%
Housing density (houses/condos per square mile)
1,776.1
2,223.4
House value disparities
31.1%
22.3%
Household income disparities
42.1%
36.9%
Median household income for houses/condes with a mortgage
$97,987
$122,725
Median household income for apartments without a mortgage
$63,218
$97,218
Housing units without a mortgage
1,338 (1.6%)
1,076 (1.9%)
Housing units with both a second mortgage and home equity loan
5,628 (6.9%)
2,828 (5%)
Housing units with a mortgage
80,572 (98.4%)
55,398 (98.1%)
Housing units with a home equity loan
48 (0.1%)
175 (0.3%)
Housing units with a second mortgage
7,236 (8.8%)
3,491 (6.2%)
House/condo owner moved in on average (years ago)
8
6
House/condo renter moved in on average (years ago)
1
1
Housing units lacking complete kitchen facilities
0.9%
0.7%
Housing units lacking complete plumbing facilities
0.4%
0.2%
Housing units in structures
Housing units in structures
Mesa
Gilbert
One, detached
55.9%
82.5%
One, attached
6.6%
2.6%
Two
1.0%
0.5%
3 or 4
5.1%
1.3%
5 to 9
6.0%
2.5%
10 to 19
5.0%
3.4%
20 to 49
2.8%
1.6%
50 or more
5.3%
5.3%
Mobile homes
11.8%
0.2%
Boats, RVs, vans, etc.
0.6%
0.0%
Median real estate property taxes paid for housing units
Self-employed workers in own not incorporated business
10,562
5,669
State government workers
6,039
5,211
Unpaid family workers
830
101
Industries and Occupations
In Mesa, the healthcare, education, and aviation sectors are significant employers. Meanwhile, in Gilbert, healthcare and retail are significant, and there's also a notable presence of professionals in technical services.
Health diagnosing and treating practitioners and other technical occupations
6.7%
9.2%
Food preparation and serving related occupations
6.0%
3.5%
Healthcare support occupations
5.7%
3.2%
Health technologists and technicians
3.7%
2.5%
Personal care and service occupations
3.6%
3.7%
Production occupations
3.0%
1.6%
Building and grounds cleaning and maintenance occupations
2.6%
1.4%
Material moving occupations
2.3%
1.4%
Transportation occupations
1.9%
2.9%
Community and social service occupations
1.8%
1.3%
Computer and mathematical occupations
1.6%
2.7%
Arts, design, entertainment, sports, and media occupations
1.3%
2.4%
Architecture and engineering occupations
0.9%
1.1%
Legal occupations
0.7%
1.4%
Health Care
Mesa has more hospitals and healthcare facilities, including the Banner Heart Hospital and Mountain Vista Medical Center. Gilbert also has top-rated hospitals, like the Mercy Gilbert Medical Center, but fewer in number. Health care quality, though, is excellent in both cities.
Gilbert is newer with more recent developments, and as a result, its infrastructure is more modern. Mesa, being older, has a blend of new developments interspersed with historic landmarks, offering a unique mix of old and new.
Infrastructure
Type
Mesa
Gilbert
Hospitals
13
4
TV stations
18
20
Bank branches located here
97
52
Bank institutions located here
22
16
Drinking water stations with no reported violations in the past
1
0
Drinking water stations with reported violations in the past
HMDA - Conventional home purchase loans - Applications denied
Year
Mesa
Gilbert
1999
2,532
501
2000
2,428
296
2001
1,854
209
2002
1,520
235
2003
1,991
625
2004
2,897
931
2005
3,857
1,315
2006
3,727
1,236
2007
1,896
873
2008
765
335
2009
440
178
Culture and Food
Mesa offers a more culturally diverse food scene attributed to its multicultural population. It also boasts robust arts and music scenes. Gilbert is not far behind, with a booming food scene, especially in its downtown area offering a variety of eateries and unique food experiences.
Sports Teams
Mesa is home to the Chicago Cubs' spring training facility and has several minor league teams. Gilbert doesn’t have any major sports teams but remains close enough to Phoenix for residents and visitors to enjoy the NBA, NFL, and MLB.


 Mesa, AZ
 Gilbert, AZ