Phoenix, Arizona and Miami, Florida have unique qualities that attract tourists and potential residents alike. Phoenix, renowned for its breathtaking desert landscapes and warm climate, is a major hub for industry and entrepreneurship. Miami, on the other hand, is well known for its vibrant multicultural scene, tropical climate, and bustling nightlife. A comparison of these two cities in terms of crime/safety, weather, cost of living, education, work and economy, infrastructure, industries and occupations, biggest employers, real-estate, neighborhoods, and other factors can provide a more comprehensive snapshot of life in these cities.
Distance between
Phoenix, AZ and
Miami, FL : 1,977.0 miles
Phoenix's population is larger by 269%. Its population has grown by 303,524 people (23.0%) since 2000. The population of Miami has grown by 77,420 people (21.4%) during that time.
Phoenix has seen a steady decrease in crime rates over the past decade, although it's statistically higher than the national average. Significant investments in law enforcement have helped curtail crime in the area, making it largely safe for both residents and tourists. Miami's crime rates, on the other hand, are considerably higher compared to Phoenix and the national average, albeit concentrated in specific areas. As such, understanding neighborhoods becomes paramount for safety when relocating to Miami.
City-data.com crime index counts serious crimes and violent crime more heavily. It adjusts for the number of visitors and daily workers commuting into cities. (higher means more crime, U.S. average = 301.1)
City-data.com crime index counts serious crimes and violent crime more heavily. It adjusts for the number of visitors and daily workers commuting into cities. (higher means more crime, U.S. average = 301.1)
Sex Offenders
According to our data, there are 3,583 registered sex offenders living in Phoenix and 1,379 registered sex offenders living in . The ratio of residents to sex offenders in Phoenix is 451 to 1; the ratio in Miami is 329 to 1. The number of registered sex offenders compared to the number of residents is a smaller in Phoenix than in Miami.
Cost of Living
The cost of living in Phoenix is less than the national average, with a more affordable housing market and lower overall expenses. Miami, on the contrary, has a higher cost of living, mainly due to its expensive real estate market and higher costs of basic necessities.
Income Tax
Arizona, where Phoenix is located, has a progressive state income tax that ranks among the highest in the U.S. Florida, home to Miami, does not have a state income tax.
Property Tax
Property taxes in Phoenix are lower with a rate of 0.802%. Miami, however, has a slightly higher property tax rate at 1.04%.
Sales Tax
Phoenix has a relatively high combined city and state sales tax rate at 8.6%. Miami has a lower rate, with the combined city and state sales tax being 7%.
Income
Type
Phoenix
Miami
Estimated median household income
$68,435
$48,789
Estimated per capita income
$35,073
$37,223
Cost of living index (U.S. average is 100)
101.2
110.1
If you make $50,000 in Phoenix, you will have to make $54,397 in Miami to maintain the same standard of living.
Geographical Conditions
Phoenix, located in the Sonoran Desert, offers unique desert landscapes and mountainous surroundings. Miami, located on the southeastern tip of Florida, enjoys coastal geography with numerous beaches and is close to the Florida Everglades.
Phoenix has a diverse range of educational options with respected universities such as Arizona State University. The city's public school system also benefits from substantial funding. Miami also supports a wide variety of educational opportunities, boasting renowned schools like the University of Miami. The city's vibrant multicultural environment provides rich resources for language study and cultural exchanges.
Phoenix's economy is thriving, spurred by growth in the healthcare, manufacturing, and retail sectors, with a lower unemployment rate compared to the national average. Miami has a diverse economy heavily influenced by the trade and tourism industries. The city has a slightly higher unemployment rate than the national average, and income levels can vary considerably.
Biggest Employers
In Phoenix, the top employers include Banner Health, Walmart, and Wells Fargo. In Miami, the University of Miami, Baptist Health South Florida, and American Airlines top the list.
There were 4,922 building permits issued in Phoenix in 2012 (3970 more than in 2011) compared to 102 building permits issued in Miami in 2012 (81 more than in 2011).
In Phoenix (Maricopa County), 43.6% voted for Democrats and 54.3% for Republicans in 2012 Presidential Election. In Miami (Miami-Dade County), 61.8% voted for Democrats and 38.0% for Republicans.
Elections
Type
Democrats
Republicans
Other
Year
Phoenix
Miami
Phoenix
Miami
Phoenix
Miami
2020
50.2%
53.5%
48.0%
46.2%
1.8%
0.3%
2016
44.9%
63.4%
47.7%
33.9%
7.5%
2.7%
2012
43.6%
61.8%
54.3%
38.0%
2.1%
0.3%
2008
44.0%
58.1%
54.5%
41.9%
1.5%
0.0%
2004
42.4%
53.0%
57.0%
46.7%
0.6%
0.3%
2000
43.0%
52.7%
53.4%
46.4%
3.6%
0.9%
1996
44.5%
57.3%
47.2%
37.9%
8.2%
4.8%
Breakdown of population affiliated with a religious congregation
Type
Adherents
Congregations
Religion
Phoenix
Miami
Phoenix
Miami
CATHOLIC CHURCH
13.6%
21.8%
4.3%
4.5%
SOUTHERN BAPTIST CONVENTION
1.9%
3.2%
6.5%
21.8%
EVANGELICAL LUTHERAN CHURCH IN AMERICA
0.8%
0.2%
2.0%
1.3%
LUTHERAN CHURCH
0.5%
0.1%
1.5%
0.8%
SEVENTH DAY ADVENTIST CHURCH
0.4%
1.1%
2.0%
4.3%
EPISCOPAL CHURCH
0.3%
0.5%
1.3%
2.1%
VINEYARD USA
0.3%
0.2%
0.6%
0.1%
MUSLIM ESTIMATE
0.2%
0.9%
1.0%
1.0%
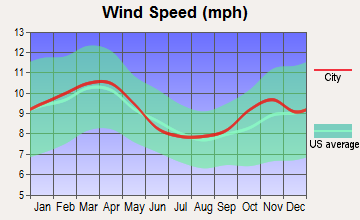
Weather
Phoenix offers a hot desert climate with incredibly high summer temperatures that many find difficult to bear. However, its winters make for an attractive climate, with mild temperatures and little to no snowfall. Miami has a tropical monsoon climate, marked by wet and dry seasons. The city is known for its high humidity and heat levels, with mild winters and occasional hurricanes, which can impact both residents and tourists.
Weather and climate
Type
Phoenix
Miami
Temperature - Average
71.5°F
77.3°F
Humidity - Average morning or afternoon humidity
37.5%
77.3%
Humidity - Differences between morning and afternoon humidity
48%
31%
Humidity - Maximum monthly morning or afternoon humidity
60%
86%
Humidity - Minimum monthly morning or afternoon humidity
12%
55%
Precipitation - Yearly average
8.7 in
60 in
Snowfall - Yearly average
0 in
0 in
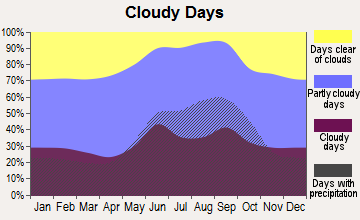
Clouds - Number of days clear of clouds
35.3%
12.3%
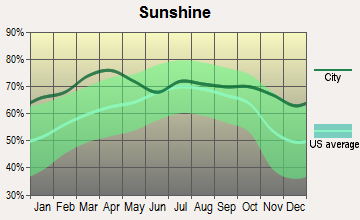
Sunshine amount - Average
92.8%
76.8%
Sunshine amount - Differences during a year
16%
16%
Sunshine amount - Maximum monthly
95%
79%
Sunshine amount - Minimum monthly
79%
63%
Wind speed - Average
6.6 mph
9.1 mph
Average climate in Phoenix, Arizona
Average climate in Miami, Florida
Air pollution
Type
AQI
CO
NO2
OZONE
PM10
PM25
SO2
Year
Phoenix
Miami
Phoenix
Miami
Phoenix
Miami
Phoenix
Miami
Phoenix
Miami
Phoenix
Miami
Phoenix
Miami
2018
156
72
0.38
0.24
15.2
2.7
28.5
31.8
34.8
15.5
8.6
8.6
0.6
0.3
2017
120
80
0.41
0.27
15.9
3.0
28.6
30.9
34.9
N/A
7.6
8.5
1.4
0.4
2016
114
68
0.44
0.30
15.8
2.9
27.3
32.6
30.6
N/A
7.7
7.2
0.4
0.0
2015
102
62
0.46
0.23
17.6
2.4
27.1
29.0
26.2
N/A
7.9
8.2
0.9
0.0
2014
117
71
0.46
0.21
19.6
3.8
27.6
30.7
37.0
N/A
8.5
8.0
1.1
0.0
2013
130
64
0.43
0.22
19.9
3.1
27.9
30.8
35.3
N/A
8.4
7.9
0.9
0.0
2012
157
71
0.44
0.19
21.2
2.9
28.1
32.1
41.9
N/A
8.8
8.7
1.3
0.0
2011
203
72
0.47
0.16
20.0
3.0
28.3
32.3
41.3
N/A
9.6
8.7
0.9
0.0
2010
100
77
0.48
0.31
19.9
4.2
26.9
32.3
31.2
N/A
8.3
9.1
0.9
0.0
2009
108
67
0.52
0.53
20.1
3.3
25.6
31.9
38.2
N/A
N/A
9.1
1.8
0.0
2008
106
95
0.48
0.55
21.4
3.8
26.6
31.0
39.6
18.0
N/A
10.5
2.4
0.0
2007
129
94
0.54
0.59
23.5
5.0
25.2
33.5
47.6
21.9
N/A
10.5
2.4
0.0
2006
131
87
0.66
0.48
25.3
5.8
24.4
34.6
50.8
22.3
N/A
10.2
2.3
0.0
2005
109
75
0.74
0.55
25.9
6.0
22.2
31.8
44.6
18.8
N/A
8.7
2.5
0.0
2004
98
69
0.77
1.02
25.5
5.9
23.4
31.3
32.8
19.5
N/A
8.5
1.4
0.3
2003
101
70
0.90
0.99
26.8
6.5
23.7
29.5
42.6
N/A
N/A
8.4
1.4
0.4
2002
111
75
0.98
0.71
28.7
6.3
23.6
30.2
41.8
N/A
N/A
8.4
1.6
2.1
2001
106
84
1.00
0.80
28.6
5.9
22.3
30.2
37.8
N/A
N/A
9.1
1.5
1.5
2000
117
66
1.14
0.89
29.9
6.7
24.6
31.1
45.6
N/A
N/A
N/A
1.7
1.3
Natural disasters
Type
Phoenix
Miami
Tornado activity compared to U.S. average
18.3%
63%
Earthquake activity compared to U.S. average
2,597.6%
1.1%
Natural disasters compared to U.S. average
16%
10%
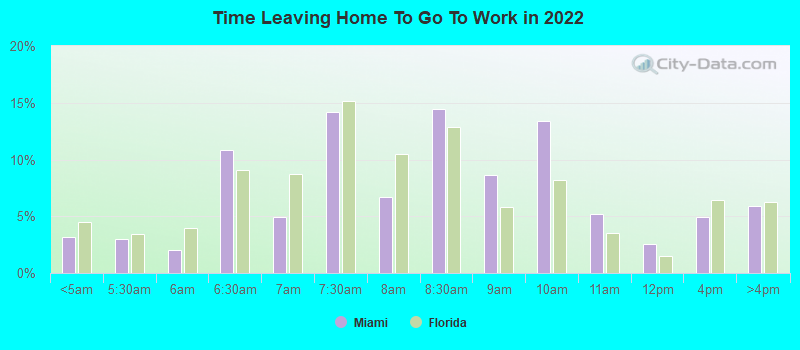
Transportation
Phoenix offers various public transportation options such as light rail, buses, and rental bikes. Commuting in Phoenix is generally more manageable due to less traffic. Miami also has public transportation systems, including Metrorail and bus services, but commuting times can be longer due to heavy traffic congestion.
Transport
Type
Phoenix
Miami
Amtrak stations
3
2
Amtrak stations nearby
3
3
FAA registered aircraft
1
1
FAA registered aircraft manufacturers and dealers
15
159
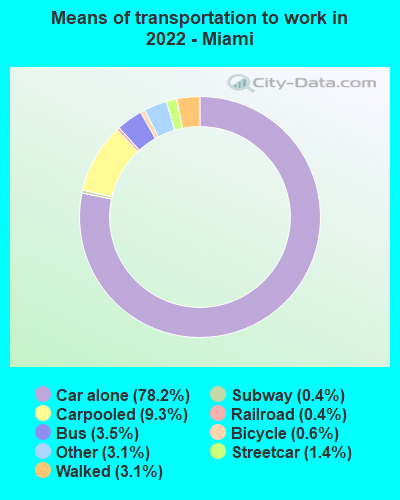
Means of transportation to work
Type
Phoenix
Miami
Bicycle
0.4%
0.8%
Bus
1.8%
3.8%
Carpooled
12.2%
8.5%
Car alone
81.8%
81.1%
Motorcycle
0.4%
0.1%
Railroad
0.2%
0.2%
Streetcar
0%
0.5%
Subway
0%
0.3%
Taxicab
0.1%
0.2%
Walked
1.4%
2.6%
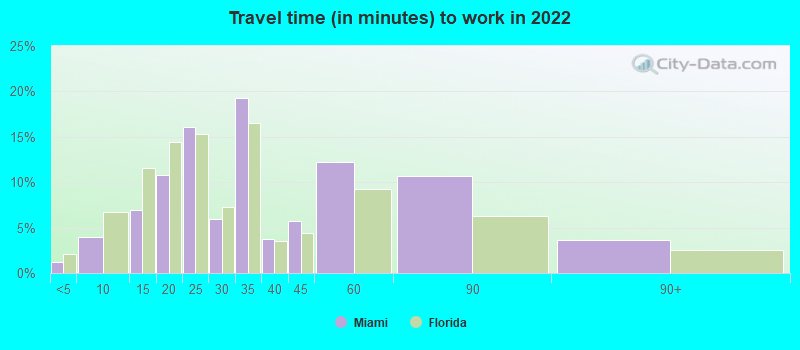
Average travel time to work
Type
Phoenix
Miami
Average
28.6 min
33.7 min
Other means
26.4 min
26.1 min
Public transportation
45.1 min
48.5 min
Private vehicle occupancy
Type
Phoenix
Miami
Average
1.2
1.1
Drove alone
86.4%
89%
In 2 person carpool
9.6%
9.2%
In 3 person carpool
2%
0.9%
In 4 person carpool
1.5%
0.4%
In 5-6 person carpool
0.3%
0.3%
In 7+ person carpool
0.3%
0.2%
How many people usually rode to work in the car, truck or van.
Real Estate
The real estate market in Phoenix is competitive but relatively affordable, making it an attractive option for newcomers. Miami's real estate is much more expensive, particularly in premium coastal locations, with high demand from domestic and international buyers.
Neighborhoods
Both cities boast diverse neighborhoods. Phoenix has areas like Ahwatukee with great education options or downtown Phoenix for a more vibrant, urban lifestyle. Miami's neighborhoods range from the upscale Coconut Grove and Coral Gables to the artistic enclave of Wynwood.
Houses and residents
Type
Phoenix
Miami
Houses
644,625
219,775
Average household size (people)
2.8
2.5
Median year apartment built
1987
1981
Median year house/condo built
1983
1968
Length of stay in the house since moving in
11.1 years
13.8 years
Houses occupied
602,039 (93.4%)
192,219 (87.5%)
Houses occupied by owners
354,237 (58.8%)
58,463 (30.4%)
Houses occupied by renters
247,802 (41.2%)
133,756 (69.6%)
Median rent asked for vacant for-rent units
$1,605
$2,006
Median monthly housing costs
$1,284
$1,456
Median price asked for vacant for-sale houses and condos
$375,817
$1,201,540
Estimated median house or condo value
$352,600
$411,300
Median numbers of rooms
5.2
3.8
Median number of rooms in apartments
4
3.4
Median number of rooms in houses and condos
6.1
5
Median house price - detached houses
$452,968
$499,839
Median house price - in 2-unit structures
Over $1,000,000
$427,603
Median house price - in 3-to-4-unit structures
$229,335
$107,725
Median house price - in 5 or more unit structures
$299,875
$570,126
Median house price - mobile homes
$159,046
$238,353
Median house price - Townhouses or other attached units
$300,398
$768,446
Median house price - All housing units
$429,075
$550,392
Median house age
36
43
Renting percentage
42.4%
67.7%
Housing density (houses/condos per square mile)
1,357.5
6,160.8
House value disparities
30.8%
31.5%
Household income disparities
43.9%
51.3%
Median household income for houses/condes with a mortgage
$96,609
$92,897
Median household income for apartments without a mortgage
$63,626
$52,201
Housing units without a mortgage
3,634 (1.5%)
686 (2.1%)
Housing units with both a second mortgage and home equity loan
12,949 (5.2%)
1,692 (5.1%)
Housing units with a mortgage
246,434 (98.5%)
32,656 (97.9%)
Housing units with a home equity loan
624 (0.2%)
36 (0.1%)
Housing units with a second mortgage
16,890 (6.8%)
2,892 (8.7%)
House/condo owner moved in on average (years ago)
8
10
House/condo renter moved in on average (years ago)
1
2
Housing units lacking complete kitchen facilities
1.2%
1.6%
Housing units lacking complete plumbing facilities
0.7%
0.8%
Housing units in structures
Housing units in structures
Phoenix
Miami
One, detached
60.3%
22.6%
One, attached
4.9%
9.7%
Two
1.4%
3.3%
3 or 4
4.4%
4.0%
5 to 9
5.0%
5.8%
10 to 19
5.3%
6.9%
20 to 49
4.1%
8.3%
50 or more
11.3%
39.2%
Mobile homes
3.1%
0.2%
Boats, RVs, vans, etc.
0.2%
0.0%
Median real estate property taxes paid for housing units
Self-employed workers in own not incorporated business
48,122
26,340
State government workers
30,385
3,509
Unpaid family workers
1,048
695
Industries and Occupations
The predominant industries in Phoenix are healthcare, retail, and manufacturing, with a growing tech sector. In Miami, the leading sectors include trade, tourism, and finance, along with media and entertainment, reflecting the city's orientation towards global commerce and culture.
Phoenix offers high-quality health care, with notable institutions such as Mayo Clinic and Banner Health. Miami is also known for excellent healthcare facilities, with Baptist Health South Florida and University of Miami Health System among the top providers.
Health (county statistics)
Type
Phoenix
Miami
General health status score of residents in this county from 1 (poor) to 5 (excellent)
Phoenix is well planned with modern infrastructure and amenities, accommodative of its growing population. It has made significant gains in renewable energy usage and boasts a robust public transport system. Miami's infrastructure is also commendable with modern public facilities, although it faces challenges related to climate resilience and traffic congestion.
Infrastructure
Type
Phoenix
Miami
Hospitals
48
47
TV stations
22
26
Arenas or stadiums
2
3
Bank branches located here
263
346
Bank institutions located here
41
53
Main business address for public companies
41
29
Drinking water stations with no reported violations in the past
2
9
Drinking water stations with reported violations in the past
HMDA - Conventional home purchase loans - Applications denied
Year
Phoenix
Miami
1999
5,846
0
2000
4,847
1,368
2001
3,823
1,354
2002
3,472
1,274
2003
5,750
1,618
2004
9,848
2,862
2005
15,879
4,991
2006
18,392
7,400
2007
9,797
5,318
2008
3,130
3,212
2009
1,614
888
Culture and Food
Phoenix has a rich cultural blend of Native American, Mexican, and Western influences, reflected in its unique food scene with famous Mexican and southwestern cuisine. Miami's culture is heavily influenced by its large Hispanic population, offering a multicultural mix of Latin American and Caribbean food scenes.
Sports Teams
Phoenix boasts several professional sports teams, including the Arizona Cardinals (NFL), Phoenix Suns (NBA), and Arizona Diamondbacks (MLB). Miami also has a strong sports presence with teams like the Miami Heat (NBA), Miami Dolphins (NFL), and Miami Marlins (MLB).


 Phoenix, AZ
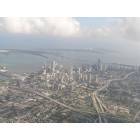
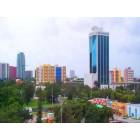
 Miami, FL