Queens and the Bronx, two of the five boroughs of New York City, each offer unique living experiences. While they share a lot in common as part of the larger New York City metropolis, each presents its own unique cultural flavors. Comparisons differ in terms of crime and safety, cost of living, education, weather, work and economy, infrastructure, industries and occupations, biggest employers, real estate, neighborhoods, transportation, taxes, culture, sports, geography, and healthcare.
Queens tends to have a lower crime rate compared to the Bronx. Neighborhoods in Queens such as Bayside, Douglaston, and Little Neck are among the safest in all of New York City. In contrast, some neighborhoods in the Bronx experience higher crime rates, but it's essential to note that like most urban areas, crime is localized to certain areas. The NYPD continues to work diligently on crime reduction throughout all five boroughs.
Cost of Living
The cost of living is typically lower in the Bronx compared to Queens. Housing, in particular, tends to be less expensive in the Bronx. However, the cost of services, groceries, and transportation in both boroughs is the same as they are part of the same city, and overall, the cost of living in both is higher than the US average due to the nature of New York City.
Income Tax
The income tax rates for both Queens and the Bronx, as set by the state of New York, range from 4% to 8.82% depending on income level. Additionally, New York City imposes its own income tax, which ranges from 3.078% to 3.876%.
Property Tax
Property tax rates in both Queens and the Bronx are determined by the city of New York, with the rates varying based on the type of property. On average, property tax rates tend to be higher in the Bronx than in Queens, although this can vary significantly depending on the specific location within the boroughs.
Sales Tax
As elements of New York City, Queens and the Bronx share the same city and state sales tax rates. The combined city and state sales tax rate is currently 8.875%. This tax applies to most goods and services, with exceptions for things like groceries and medicine.
Income
Type
Queens
Bronx
Estimated median household income
$73,262
$43,011
Estimated per capita income
$34,969
$23,354
Cost of living index (U.S. average is 100)
173.2
172.8
If you make $50,000 in Bronx, you will have to make $50,116 in Queens to maintain the same standard of living.
Geographical Conditions
Geographically, Queens is located on Long Island and thus has a geography characterized by suburban residential areas and commercial zones. It also boasts two airports: LaGuardia and JFK. The Bronx, the Northmost borough, is known for its wide green spaces, including the Bronx Park. It's the only borough of New York City that's mostly on the mainland.
Geographical information
Type
Queens
Bronx
Land area
109.2 sq. miles
42 sq. miles
Population density
20,847 people per sq. mile
32,928 people per sq. mile
Relative area comparison
Queens, NY Bronx, NY
Education
Both boroughs host excellent educational institutions. Queens is home to notable institutions such as St. John's University and City University of New York - Queens College. The Bronx is the site of highly respected schools like Fordham University and City University of New York - Lehman College. Both boroughs offer a multitude of public and private school choices for K-12 education.
Queens has a diverse economy with sectors like healthcare, education, retail, and manufacturing driving growth. Tourism, thanks to attractions like Flushing Meadows-Corona Park and the Rockaway Beaches, also plays a role. On the other hand, the Bronx's economy is led by healthcare, social assistance, and retail trade. It's also worth noting the Bronx has undergone considerable redevelopment, attracting new businesses and investments.
Biggest Employers
In Queens, some of the biggest employers are JetBlue Airways, Queens Hospital Center, and Silvercup Studios. The Bronx, home to many city government offices, has major employers like Montefiore Medical Center, Bronx-Lebanon Hospital Center, and Fordham University.
In Queens (Queens County), 79.2% voted for Democrats and 20.0% for Republicans in 2012 Presidential Election. In Bronx (Bronx County), 91.9% voted for Democrats and 8.1% for Republicans.
Elections
Type
Democrats
Republicans
Other
Year
Queens
Bronx
Queens
Bronx
Queens
Bronx
2020
72.3%
83.7%
27.0%
16.0%
0.7%
0.3%
2016
75.4%
88.6%
21.8%
9.5%
2.8%
2.0%
2012
79.2%
91.9%
20.0%
8.1%
0.8%
0.0%
2008
75.4%
89.0%
24.3%
11.0%
0.3%
0.0%
2004
71.8%
82.9%
27.5%
16.5%
0.8%
0.6%
2000
75.2%
86.5%
22.0%
11.8%
2.8%
1.7%
1996
72.9%
85.8%
21.1%
10.5%
6.0%
3.7%
Breakdown of population affiliated with a religious congregation
Type
Adherents
Congregations
Religion
Queens
Bronx
Queens
Bronx
CATHOLIC CHURCH
30.4%
25.5%
7.7%
11.5%
MUSLIM ESTIMATE
3.7%
2.8%
4.4%
3.9%
SEVENTH DAY ADVENTIST CHURCH
0.6%
0.7%
3.4%
6.5%
AMERICAN BAPTIST CHURCHES IN THE USA
0.5%
0.7%
2.5%
4.4%
EPISCOPAL CHURCH
0.4%
0.4%
2.1%
3.7%
EVANGELICAL LUTHERAN CHURCH IN AMERICA
0.3%
0.2%
2.6%
2.6%
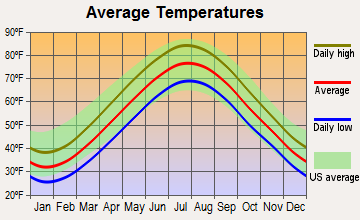
Weather
The weather in both Queens and the Bronx is typical of northeastern cities in the US, with cold, often snowy winters, and hot, humid summers. Both boroughs experience the beauty of all four seasons, including lovely spring blossoms and fabulous autumn foliage. Since both boroughs are nearby, there are no significant climatic differences.
Weather and climate
Type
Queens
Bronx
Temperature - Average
54.6°F
54.7°F
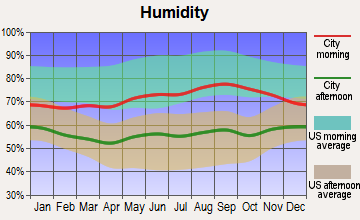
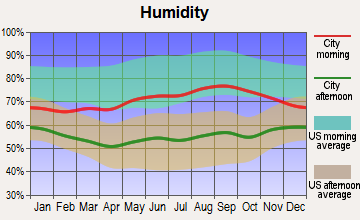
Humidity - Average morning or afternoon humidity
68.5%
67.2%
Humidity - Differences between morning and afternoon humidity
25.1%
26.4%
Humidity - Maximum monthly morning or afternoon humidity
76.3%
75.6%
Humidity - Minimum monthly morning or afternoon humidity
51.1%
49.2%
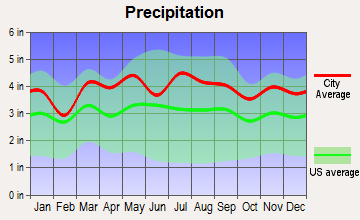
Precipitation - Yearly average
44.5 in
47 in
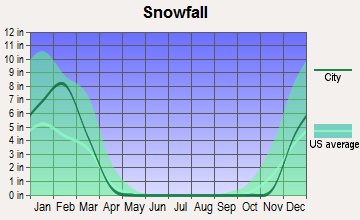
Snowfall - Yearly average
52.7 in
54.5 in
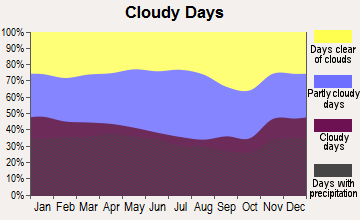
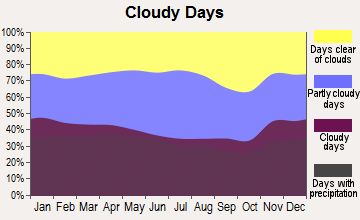
Clouds - Number of days clear of clouds
16.3%
16.5%
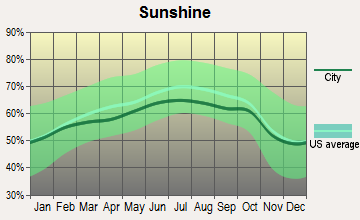
Sunshine amount - Average
60.2%
60.2%
Sunshine amount - Differences during a year
20%
20%
Sunshine amount - Maximum monthly
64%
64%
Sunshine amount - Minimum monthly
44%
44%
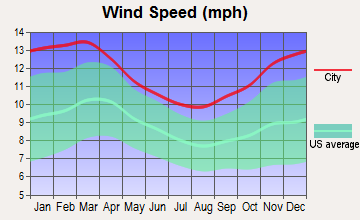
Wind speed - Average
11.6 mph
10.7 mph
Average climate in Queens, New York
Average climate in Bronx, New York
Air pollution
Type
AQI
CO
NO2
OZONE
PB
PM10
PM25
SO2
Year
Queens
Bronx
Queens
Bronx
Queens
Bronx
Queens
Bronx
Queens
Bronx
Queens
Bronx
Queens
Bronx
Queens
Bronx
2018
97
102
0.26
0.31
14.7
15.8
25.4
24.4
N/A
N/A
N/A
N/A
6.4
7.4
0.4
0.6
2017
98
100
0.23
0.04
15.4
15.7
25.8
24.6
N/A
N/A
N/A
N/A
6.4
7.0
0.5
0.6
2016
97
98
0.24
0.30
16.0
16.4
25.5
24.6
N/A
N/A
N/A
N/A
6.7
7.2
0.6
0.8
2015
104
105
0.26
0.28
17.4
18.0
24.1
23.6
N/A
N/A
N/A
N/A
7.9
8.6
0.8
1.4
2014
99
99
0.25
0.32
17.0
18.0
24.3
23.6
N/A
N/A
N/A
N/A
7.8
8.4
1.1
1.7
2013
101
103
0.23
0.39
17.7
18.9
25.8
23.5
N/A
N/A
N/A
N/A
8.7
9.3
1.2
2.1
2012
105
104
0.26
0.44
17.6
18.8
25.8
23.9
N/A
N/A
N/A
N/A
9.1
9.7
1.8
3.1
2011
112
113
0.27
0.46
20.4
20.9
24.2
22.1
N/A
N/A
N/A
N/A
10.6
11.6
2.7
4.5
2010
112
113
0.35
0.53
19.4
20.2
23.6
23.7
N/A
N/A
N/A
N/A
10.3
10.8
2.9
4.7
2009
107
107
0.24
0.53
21.0
22.3
21.0
19.5
N/A
N/A
N/A
N/A
9.7
10.8
3.4
5.4
2008
113
114
0.44
0.53
22.6
23.3
22.0
19.9
0.013
0.013
N/A
N/A
11.0
12.1
4.1
5.9
2007
121
122
0.46
0.60
22.9
24.6
20.2
19.1
0.016
0.016
N/A
N/A
11.6
13.2
4.9
7.0
2006
120
120
0.46
0.50
23.5
25.0
20.3
18.9
0.018
0.018
N/A
N/A
12.7
12.8
5.3
7.0
2005
110
115
0.54
0.60
25.5
27.0
19.7
17.8
N/A
N/A
N/A
N/A
N/A
N/A
6.7
9.3
2004
107
109
0.55
0.62
25.1
25.6
18.2
16.7
0.030
0.030
N/A
N/A
N/A
N/A
5.8
8.8
2003
110
110
0.63
0.75
26.9
27.4
18.9
17.1
0.022
0.022
26.9
26.9
N/A
N/A
7.0
8.9
2002
124
124
0.58
0.67
27.9
27.9
19.2
17.4
0.008
0.008
25.7
25.0
N/A
N/A
6.5
8.6
2001
124
126
0.60
0.66
28.8
30.0
19.3
17.8
0.020
0.020
24.5
22.8
N/A
N/A
7.8
10.0
2000
115
115
0.67
0.68
28.4
29.4
17.6
16.0
0.022
0.022
22.2
22.2
N/A
N/A
7.3
10.2
Natural disasters
Type
Queens
Bronx
Tornado activity compared to U.S. average
54%
58.3%
Earthquake activity compared to U.S. average
30.6%
31%
Natural disasters compared to U.S. average
19%
14%
Transportation
Queens and the Bronx both offer multiple public transportation options making commuting relatively straightforward. Queens is serviced by the MTA subway, Long Island Rail Road, and multiple bus routes. The Bronx, while also serviced by the MTA subway and bus routes, has Metro-North Railroad service. Both boroughs provide easy access to Manhattan and other NYC boroughs.
Transport
Type
Queens
Bronx
Amtrak stations
2
0
Amtrak stations nearby
3
3
FAA registered aircraft
4
39
Means of transportation to work
Type
Queens
Bronx
Bicycle
0.3%
0.2%
Bus
10%
15.6%
Carpooled
10.2%
9.3%
Car alone
34.3%
27%
Railroad
2.2%
2%
Streetcar
0.2%
0.2%
Subway
34.3%
34.6%
Taxicab
0.7%
1.3%
Walked
5.7%
7.2%
Average travel time to work
Type
Queens
Bronx
Average
44 min
44.2 min
Real Estate
Real estate in Queens is generally more expensive, with a median home value much higher than the Bronx. However, recent developments in the Bronx are leading to a rise in property valuations. Both boroughs offer a mix of single-family homes, condominiums, and apartments, with architectural styles varying from neighborhood to neighborhood.
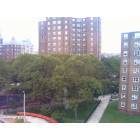
Neighborhoods
Queens boasts diverse neighborhoods like vibrant Astoria known for its Greek community, trendy Long Island City with its waterfront parks, or family-friendly Bayside. The Bronx is known for the historic Grand Concourse district, the diverse Melrose neighborhood, and City Island with a small-town vibe.
Houses and residents
Type
Queens
Bronx
Houses
817,250
490,659
Average household size (people)
2.8
2.8
Houses occupied
782,664 (95.8%)
463,212 (94.4%)
Houses occupied by owners
334,894 (42.8%)
90,522 (19.5%)
Houses occupied by renters
447,770 (57.2%)
372,690 (80.5%)
Median rent asked for vacant for-rent units
$1,666
$1,273
Median price asked for vacant for-sale houses and condos
$615,765
$708,992
Estimated median house or condo value
$642,000
$465,000
Median number of rooms in apartments
3.7
3.7
Median number of rooms in houses and condos
5.4
5.1
Renting percentage
57%
80.7%
Housing density (houses/condos per square mile)
7,481.6
11,675
Household income disparities
44.9%
50.2%
Housing units without a mortgage
64,617 (34.6%)
12,021 (34%)
Housing units with both a second mortgage and home equity loan
311 (0.2%)
105 (0.3%)
Housing units with a mortgage
122,366 (65.4%)
23,339 (66%)
Housing units with a home equity loan
9,927 (5.3%)
2,053 (5.8%)
Housing units with a second mortgage
10,707 (5.7%)
2,159 (6.1%)
Housing units lacking complete kitchen facilities
1%
1.4%
Housing units lacking complete plumbing facilities
1.1%
1.7%
Housing units in structures
Housing units in structures
Queens
Bronx
One, detached
21.1%
5.8%
One, attached
9.8%
5.4%
Two
19.2%
8.4%
3 or 4
10.5%
7.4%
5 to 9
5.6%
3.9%
10 to 19
3.4%
6.3%
20 to 49
9.4%
25.4%
50 or more
20.9%
37.2%
Mobile homes
0.1%
0.1%
Median real estate property taxes paid for housing units
Self-employed workers in own not incorporated business
48,383
16,572
State government workers
21,536
14,515
Unpaid family workers
2,382
1,000
Industries and Occupations
Healthcare and social assistance are dominant sectors in both boroughs. Other significant sectors in Queens include retail trade, construction, and educational services, while in the Bronx, retail trade and educational services follow health care. The occupations adopt a similar pattern, with Queens showing diversity with sales, management roles, whereas the Bronx leans more towards healthcare-related occupations.
Both boroughs offer excellent healthcare facilities. Queens houses several renowned hospitals like New York-Presbyterian Queens and Long Island Jewish Medical Center. The Bronx is home to top-rated healthcare providers like Montefiore Medical Center and Bronx-Lebanon Hospital Center.
Health (county statistics)
Type
Queens
Bronx
General health status score of residents in this county from 1 (poor) to 5 (excellent)
Queens, being larger, has a more developed infrastructure with a network of roads, a variety of public transportation options, and substantial utilities. The Bronx, while smaller, also boasts comprehensive infrastructure. Notable is the Yankee Stadium area where significant redevelopment has occurred. Both are relatively well-connected to other parts of New York City.
Infrastructure
Type
Queens
Bronx
Hospitals
1
57
TV stations
30
30
Schools
School facilities
Type
Queens
Bronx
Private elementary/middle schools
8
54
Private high schools
1
20
Public elementary/middle schools
6
285
Public high schools
2
155
Colleges/Universities
1
9
Culture and Food
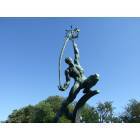
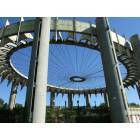
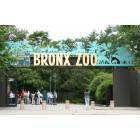
Queens is celebrated for its cultural and culinary diversity, with influences from Latin America, Asia, and Europe. The Bronx is famous for its thriving arts scene, the New York Botanical Garden, and the Bronx Zoo. Both boroughs offer great food, with the Bronx known for its Italian food in Arthur Avenue and Queens for its international cuisine.
Sports Teams
Queens is home to the New York Mets, who play at Citi Field, while the Bronx is home to the world-renowned New York Yankees, who play at Yankee Stadium. Both boroughs boast a vast fan base and a rich history of competition, making them attractive destinations for sports lovers.


 Queens, NY
 Bronx, NY