Staten Island, the least populated of New York's five boroughs, offers a suburban environment with access to the hustle and bustle of Manhattan. In comparison, Bridgeport, Connecticut's largest city, has a more industrial atmosphere, but is surrounded by picturesque New England nature. When considering a move or visit, factors like cost of living, education, economy, infrastructure, crime rates, weather, culture, and tax burdens can play a significant role. This detailed comparison of the two cities aims at helping people make informed decisions.
Both Staten Island and Bridgeport face crime issues common to urban environments. However, Staten Island's crime rate is lower than Bridgeport's, closer to the national average. Both locales have made significant strides in recent years towards improving safety and reducing crime. Bridgeport faces more challenges due to socio-economic factors, but initiatives are in place to continue improving safety for residents and tourists.
Cost of Living
New York City’s high cost of living extends to Staten Island, with housing being the major factor. Bridgeport's cost of living is lower, although higher than the national average. However, as both are part of expensive regions, residents require higher-than-average incomes to maintain a comfortable lifestyle.
Income Tax
New York's state income tax is progressive, with rates between 4% and 8.82%. Similarly, Connecticut's income tax is progressive, with rates from 3% to 6.99%.
Property Tax
Property taxes are high in both locales. Staten Island, though it has the lowest rate in NYC, is higher than the national average. Bridgeport has one of the highest property tax rates in Connecticut due to its high reliance on property taxes for revenue.
Sales Tax
NYC, including Staten Island, has a higher sales tax rate than Bridgeport. When combined with the NY state tax, Staten Island's total sales tax is 8.875%, while Bridgeport's combined rate is 6.35%.
Income
Type
Staten Island
Bridgeport
Estimated median household income
$86,054
$46,445
Estimated per capita income
$38,678
$28,975
Cost of living index (U.S. average is 100)
164.1
130.9
If you make $50,000 in Bridgeport, you will have to make $62,681 in Staten Island to maintain the same standard of living.
Geographical Conditions
Staten Island, surrounded by water, offers beautiful coastal views and hilly terrain, with green spaces like the Staten Island Greenbelt. Bridgeport, located on the coast of the Long Island Sound, also offers water views, with a mixture of urban and outdoor spaces.
Geographical information
Type
Staten Island
Bridgeport
Land area
58.5 sq. miles
16 sq. miles
Population density
8,225.7 people per sq. mile
9,271.1 people per sq. mile
Relative area comparison
Staten Island, NY Bridgeport, CT
Education
Both Staten Island and Bridgeport offer a range of educational opportunities, from high-quality public schools to private institutions. Staten Island, part of the NYC Department of Education, boasts several top-rated schools. Bridgeport's school system faces some challenges but offers select high-performing schools and is constantly improving.
Staten Island's economy benefits from being part of NYC, with opportunities in diverse sectors like finance, healthcare, and retail. Bridgeport's economy is more industrial, with manufacturing jobs plentiful, but it's diversifying into sectors like healthcare and professional services.
Biggest Employers
Staten Island University Hospital, Richmond University Medical Center, and the City of New York are some of the top employers in Staten Island. In Bridgeport, St. Vincent's Medical Center, Bridgeport Hospital, and the city's school district are large employers.
In Staten Island (Richmond County), 50.8% voted for Democrats and 48.3% for Republicans in 2012 Presidential Election. In Bridgeport (Fairfield County), 54.9% voted for Democrats and 44.2% for Republicans.
Elections
Type
Democrats
Republicans
Other
Year
Staten Island
Bridgeport
Staten Island
Bridgeport
Staten Island
Bridgeport
2020
42.2%
62.9%
57.1%
35.8%
0.7%
1.3%
2016
41.0%
58.0%
56.1%
38.1%
2.9%
3.9%
2012
50.8%
54.9%
48.3%
44.2%
0.9%
0.9%
2008
47.8%
58.7%
51.9%
40.5%
0.4%
0.7%
2004
42.8%
51.5%
56.5%
47.4%
0.7%
1.1%
2000
52.1%
52.3%
45.1%
43.1%
2.9%
4.5%
1996
50.5%
48.9%
40.8%
41.1%
8.7%
10.0%
Breakdown of population affiliated with a religious congregation
Type
Adherents
Congregations
Religion
Staten Island
Bridgeport
Staten Island
Bridgeport
CATHOLIC CHURCH
54.2%
44.1%
20.6%
14.2%
MUSLIM ESTIMATE
1.7%
0.6%
3.0%
2.0%
AMERICAN BAPTIST CHURCHES IN THE USA
0.6%
1.4%
1.0%
3.8%
EVANGELICAL LUTHERAN CHURCH IN AMERICA
0.6%
0.5%
4.0%
2.4%
COPTIC ORTHODOX CHURCH
0.5%
0.0%
1.0%
0.0%
EPISCOPAL CHURCH
0.4%
2.5%
5.0%
6.6%
LUTHERAN CHURCH
0.2%
0.3%
1.5%
1.5%
SOUTHERN BAPTIST CONVENTION
0.2%
0.3%
3.5%
2.6%
SEVENTH DAY ADVENTIST CHURCH
0.1%
0.3%
2.5%
2.6%
Weather
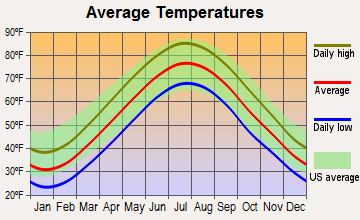
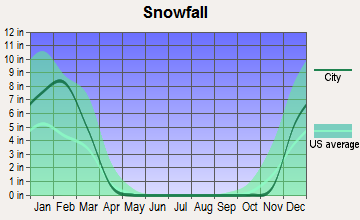
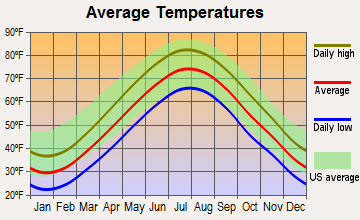
Staten Island experiences moderate climate, with hot summers, crisp falls, and cold winters. Bridgeport, located on the Long Island Sound coast, also has a temperate climate, but can receive intense snowfalls in winter and occasional hurricanes in late summer. Both locations offer opportunities for seasonal activities and tourism.
Weather and climate
Type
Staten Island
Bridgeport
Temperature - Average
54.1°F
52.1°F
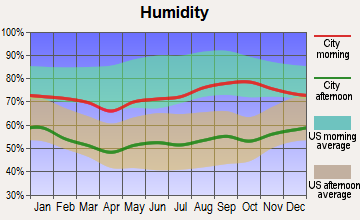
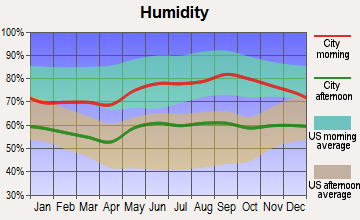
Humidity - Average morning or afternoon humidity
67.4%
72.5%
Humidity - Differences between morning and afternoon humidity
29.9%
26%
Humidity - Maximum monthly morning or afternoon humidity
77%
80%
Humidity - Minimum monthly morning or afternoon humidity
47.2%
54%
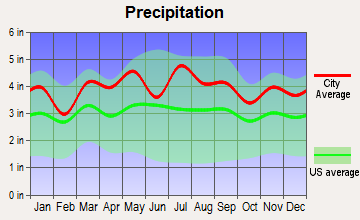
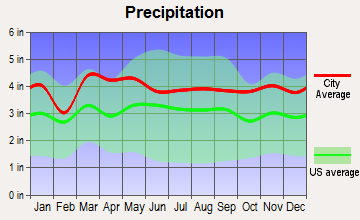
Precipitation - Yearly average
47.4 in
47.2 in
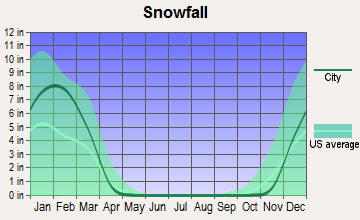
Snowfall - Yearly average
60 in
59.6 in
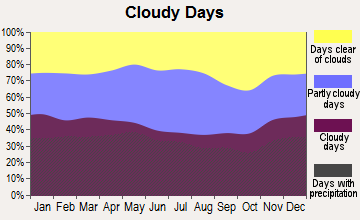
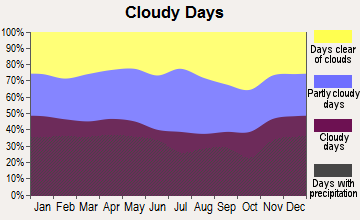
Clouds - Number of days clear of clouds
15.8%
16.5%
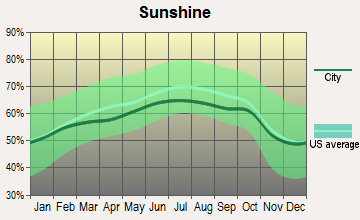
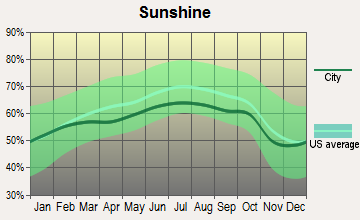
Sunshine amount - Average
60.2%
61%
Sunshine amount - Differences during a year
20%
17.6%
Sunshine amount - Maximum monthly
64%
63.6%
Sunshine amount - Minimum monthly
44%
46%
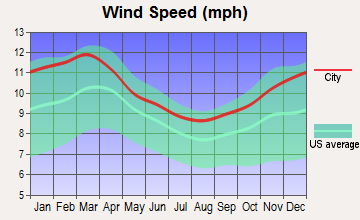
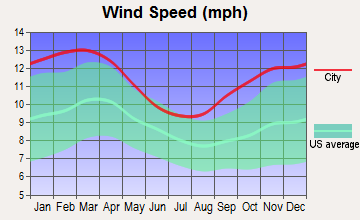
Wind speed - Average
10.5 mph
10.4 mph
Average climate in Staten Island, New York
Average climate in Bridgeport, Connecticut
Air pollution
Type
AQI
CO
NO2
OZONE
PB
PM10
PM25
SO2
Year
Staten Island
Bridgeport
Staten Island
Bridgeport
Staten Island
Bridgeport
Staten Island
Bridgeport
Staten Island
Staten Island
Bridgeport
Staten Island
Bridgeport
Staten Island
Bridgeport
2018
94
94
0.35
0.34
17.1
9.4
24.1
26.3
N/A
N/A
N/A
N/A
7.9
8.0
0.4
0.3
2017
98
92
0.32
0.34
17.0
12.0
27.0
26.4
N/A
N/A
N/A
N/A
7.6
7.0
0.2
0.3
2016
94
107
0.37
0.36
17.9
13.4
28.5
26.8
N/A
N/A
N/A
N/A
7.7
9.5
0.2
0.5
2015
102
106
0.39
0.39
18.9
13.9
27.3
26.4
N/A
N/A
N/A
N/A
8.6
9.9
0.4
0.5
2014
97
102
0.38
0.36
19.2
9.9
25.6
25.8
N/A
N/A
N/A
N/A
8.3
10.0
0.7
0.9
2013
99
114
0.39
0.36
19.6
10.1
27.8
27.1
N/A
N/A
N/A
N/A
8.5
11.4
0.8
0.8
2012
102
104
0.42
0.36
19.3
9.6
26.9
25.5
N/A
N/A
N/A
N/A
9.2
7.8
1.4
1.0
2011
108
83
0.42
0.39
21.4
12.7
28.1
24.2
N/A
N/A
N/A
N/A
10.2
N/A
2.0
1.6
2010
114
88
0.40
0.45
19.9
10.8
28.7
25.6
N/A
N/A
N/A
N/A
9.4
N/A
1.8
1.3
2009
105
80
0.39
0.46
22.5
10.9
25.3
22.8
N/A
N/A
N/A
N/A
9.5
N/A
2.4
2.0
2008
111
94
0.39
0.47
23.0
12.7
24.3
25.0
0.013
N/A
N/A
N/A
11.3
N/A
3.4
2.2
2007
123
98
0.44
0.55
24.2
14.8
23.3
N/A
0.016
N/A
N/A
N/A
12.0
N/A
4.3
2.6
2006
117
100
0.55
0.60
25.6
15.4
24.7
N/A
0.018
N/A
N/A
N/A
13.1
N/A
5.3
3.1
2005
112
104
0.69
0.76
27.3
16.7
23.3
N/A
N/A
N/A
N/A
N/A
N/A
N/A
7.3
4.1
2004
109
96
0.68
0.61
26.4
15.7
22.2
N/A
0.030
N/A
N/A
41.5
N/A
N/A
6.9
3.6
2003
112
106
0.76
0.66
28.0
18.0
22.1
N/A
0.006
N/A
26.9
41.0
N/A
N/A
7.1
3.4
2002
125
115
0.74
0.70
30.6
19.8
24.7
N/A
0.008
N/A
26.1
33.7
N/A
N/A
6.6
3.2
2001
124
117
0.81
0.73
32.4
21.6
24.9
N/A
0.020
N/A
26.9
37.6
N/A
N/A
7.2
3.7
2000
116
95
0.93
0.80
33.0
18.8
23.1
25.8
0.022
N/A
22.2
31.9
N/A
N/A
7.2
3.7
Natural disasters
Type
Staten Island
Bridgeport
Tornado activity compared to U.S. average
61.3%
59%
Earthquake activity compared to U.S. average
31.2%
29.8%
Natural disasters compared to U.S. average
19%
24%
Transportation
As part of NYC, Staten Island enjoys extensive public transit, though it's somewhat isolated from other boroughs. Bridgeport has good highway access and is served by an Amtrak station and ferry service, making commuting relatively easy.
Transport
Type
Staten Island
Bridgeport
Amtrak stations
0
1
Amtrak stations nearby
3
2
FAA registered aircraft
39
14
FAA registered aircraft manufacturers and dealers
2
0
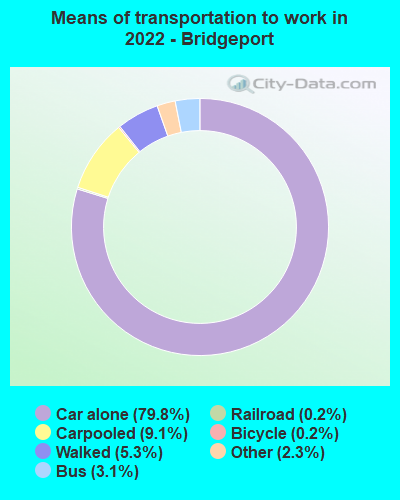
Means of transportation to work
Type
Staten Island
Bridgeport
Bicycle
0.2%
0.4%
Bus
19.2%
2.9%
Carpooled
12.1%
10.5%
Car alone
54.3%
79.5%
Ferryboat
5.3%
0%
Railroad
0.9%
1.4%
Streetcar
0%
0.2%
Subway
2.6%
1.3%
Taxicab
0.4%
0.2%
Walked
2.9%
3.9%
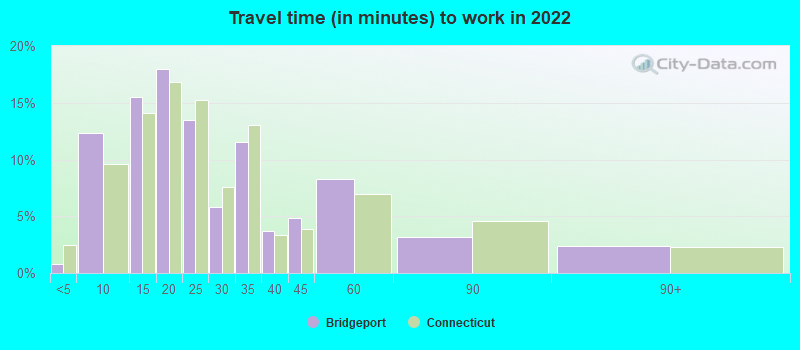
Average travel time to work
Type
Staten Island
Bridgeport
Average
45.3 min
25.5 min
Real Estate
Real estate is expensive in Staten Island but still cheaper compared to most of NYC. Bridgeport offers more affordable housing, but prices are variable, depending on the neighborhood.
Neighborhoods
Staten Island neighborhoods are famed for their quiet, suburban feel and family-friendly ambiance. On the other hand, Bridgeport ranges from urban to suburban settings, with diverse, eclectic neighborhoods.
Houses and residents
Type
Staten Island
Bridgeport
Houses
163,993
61,494
Average household size (people)
2.8
2.7
Houses occupied
156,341 (95.3%)
57,732 (93.9%)
Houses occupied by owners
99,732 (63.8%)
24,938 (43.2%)
Houses occupied by renters
56,609 (36.2%)
32,794 (56.8%)
Median rent asked for vacant for-rent units
$1,320
$753.26
Median price asked for vacant for-sale houses and condos
$369,853
$495,508
Estimated median house or condo value
$605,500
$222,800
Median number of rooms in apartments
3.9
4.2
Median number of rooms in houses and condos
6.1
5.4
Renting percentage
35.9%
57.4%
Housing density (houses/condos per square mile)
2,804.3
3,843.5
Household income disparities
43.8%
48.7%
Housing units without a mortgage
19,289 (25%)
385 (2.2%)
Housing units with both a second mortgage and home equity loan
160 (0.2%)
1,010 (5.7%)
Housing units with a mortgage
57,986 (75%)
17,302 (97.8%)
Housing units with a home equity loan
5,623 (7.3%)
78 (0.4%)
Housing units with a second mortgage
4,499 (5.8%)
1,742 (9.8%)
Housing units lacking complete kitchen facilities
0.6%
2.5%
Housing units lacking complete plumbing facilities
Self-employed workers in own not incorporated business
7,611
3,777
State government workers
6,285
2,493
Unpaid family workers
394
0
Industries and Occupations
In Staten Island, industries like healthcare, education, and retail dominate, with a rising tech sector. Bridgeport is historically an industrial city, with many residents working in manufacturing, but healthcare and professional services are growing.
Staten Island residents have access to top-notch healthcare provided by New York City hospitals and clinics. Bridgeport's residents are served by two major hospitals and have access to healthcare facilities throughout Fairfield County.
Staten Island offers more open spaces and less crowded infrastructure, owing to its residential nature. Bridgeport, being an industrial city, has less open space but excellent road connectivity and public infrastructure.
Infrastructure
Type
Staten Island
Bridgeport
Hospitals
25
3
TV stations
30
29
Bank branches located here
104
30
Bank institutions located here
19
8
Drinking water stations with no reported violations in the past
1
28
Drinking water stations with reported violations in the past
3
46
Schools
School facilities
Type
Staten Island
Bridgeport
Private elementary/middle schools
22
9
Private high schools
13
3
Public elementary/middle schools
63
30
Public high schools
16
13
Colleges/Universities
5
7
Culture and Food
Culturally diverse Staten Island offers a variety of cuisines and houses the only traditional Sri Lankan restaurant in NYC. Bridgeport's culture is vibrant and diverse, with a memorable food scene that includes everything from seafood to Latin American specialties.
Sports Teams
Both regions are rich in professional sports. While Staten Island doesn’t directly host major pro teams, residents are minutes away from New York’s vast sports scene. Meanwhile, Bridgeport doesn't host major professional teams, but is close to New Haven and Hartford’s pro sports.


 Staten Island, NY
 Bridgeport, CT