Hollywood: Fire Incidents, Florida (FL)
Where are fire incidents reported in Hollywood, FL
Something went wrong! Please refresh the page.
| Fire incidents reported | |
|---|---|
| Sreet name | Count |
| HOLLYWOOD BLVD | 474 |
| SHERIDAN ST | 470 |
| OCEAN DR | 434 |
| SR 7 | 366 |
| TAFT ST | 304 |
| JOHNSON ST | 290 |
| WASHINGTON ST | 244 |
| PARK RD | 186 |
| SEMINOLE WAY | 176 |
| FEDERAL HWY | 154 |
| STIRLING RD | 154 |
| I95 | 152 |
| POLK ST | 150 |
| FILLMORE ST | 142 |
| PEMBROKE RD | 134 |
| ARTHUR ST | 116 |
| HILLCREST DR | 114 |
| PIERCE ST | 114 |
| LINCOLN ST | 110 |
| I-95 | 108 |
| FLORIDA TURNPIKE | 100 |
| ELLER DR | 96 |
| MCKINLEY ST | 96 |
| 56TH AVE | 92 |
| DIXIE HWY | 92 |
| THOMAS ST | 88 |
| 26TH AVE | 84 |
| JACKSON ST | 84 |
| OAKWOOD BLVD | 84 |
| 24TH AVE | 82 |
| Other | 2 |
2003 - 2018 National Fire Incident Reporting System (NFIRS) incidents
- Incident types reported to NFIRS in Hollywood, FL
- 94,37670.4%Rescue & EMS
- 15,08911.3%Good Intent Call
- 7,3155.5%False Alarm
- 6,1944.6%Hazardous Condition
- 5,7354.3%Service Call
- 5,2923.9%Fire
- Fire incident types reported to NFIRS in Hollywood, FL
- 2,24242.4%Structure Fires
- 1,37426.0%Outside Fires
- 1,27324.1%Mobile Property/Vehicle Fires
- 4037.6%Other
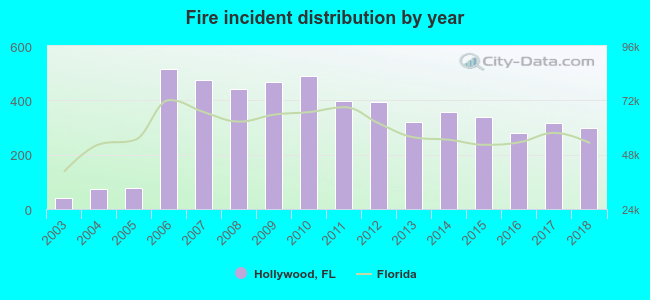 According to the data from the years 2003 - 2018 the average number of fire incidents per year is 330. The highest number of fires - 516 took place in 2006, and the least - 40 in 2003. The data has a growing trend.
The average number of yearly fire incidents per 10k residents in Hollywood, FL compared to nearest cities:
(Note: Based on data for the last 3 years, including only cities with population 5,000 and above)
| Hollywood: | 20.1 |
| Pembroke Park: | 42.9 |
| Dania Beach: | 0.5 |
| West Park: | 27.7 |
| Hallandale: | 24.5 |
| Hallandale Beach: | 0.3 |
| Aventura: | 9.7 |
| North Miami Beach: | 12.4 |
| Sunny Isles Beach: | 12.6 |
 The median response time based on all reported fire incidents is 6 minutes. This is about the same as the Florida median value.
The median response time in Hollywood, FL compared to nearest cities:
(Note: Based on data for all years, including only cities with at least 500 fire incidents)
| Hollywood: | 6 minutes |
| West Park: | 5 minutes |
| Hallandale: | 5 minutes |
| Miami Gardens: | 6 minutes |
| North Miami Beach: | 6 minutes |
| Cooper City: | 6 minutes |
| Miramar: | 6 minutes |
| Davie: | 7 minutes |
| Fort Lauderdale: | 5 minutes |
 According to the data from the years 2003 - 2018 the average number of fire-related fatalities per year is 0. The highest number of deaths - 2 took place in 2013, and the lowest - 0 in 2003. The data has a constant trend.
The average number of fatalities per 1,000 fires is 1. This indicator was the highest - 6 in 2013, and the lowest 0 in 2003. The trend for fatalities per 1,000 fires is constant. Compared to the state value the number of fatalities per 1,000 incidents is lower.
According to the data from the years 2003 - 2018 the average number of fire-related fatalities per year is 0. The highest number of deaths - 2 took place in 2013, and the lowest - 0 in 2003. The data has a constant trend.
The average number of fatalities per 1,000 fires is 1. This indicator was the highest - 6 in 2013, and the lowest 0 in 2003. The trend for fatalities per 1,000 fires is constant. Compared to the state value the number of fatalities per 1,000 incidents is lower.Deaths per 1,000 incidents in Hollywood, FL compared to nearest cities:
(Note: Based on data for all years, including only cities with at least 2,500 fire incidents)
| Hollywood: | 1.1 |
| Miami Gardens: | 0.0 |
| Miramar: | 1.5 |
| Davie: | 0.8 |
| Fort Lauderdale: | 0.8 |
| Plantation: | 0.4 |
| Pembroke Pines: | 1.4 |
| Lauderhill: | 2.3 |
 Based on the data from the years 2003 - 2018 the average number of fire-related casualties per year is 6. The highest number of casualties - 16 took place in 2007, and the lowest - 0 in 2003. The data has an increasing trend.
The average number of injuries per 1,000 fires is 14. This indicator was the highest - 34 in 2007, and the lowest 0 in 2003. The trend for injuries per 1,000 fires is rising. Compared to the state value the number of injuries per 1,000 incidents is higher.
Based on the data from the years 2003 - 2018 the average number of fire-related casualties per year is 6. The highest number of casualties - 16 took place in 2007, and the lowest - 0 in 2003. The data has an increasing trend.
The average number of injuries per 1,000 fires is 14. This indicator was the highest - 34 in 2007, and the lowest 0 in 2003. The trend for injuries per 1,000 fires is rising. Compared to the state value the number of injuries per 1,000 incidents is higher.Casualties per 1,000 incidents in Hollywood, FL compared to nearest cities:
(Note: Based on data for all years, including only cities with at least 500 fire incidents)
| Hollywood: | 17.4 |
| West Park: | 18.9 |
| Hallandale: | 12.9 |
| Miami Gardens: | 0.0 |
| North Miami Beach: | 0.0 |
| Cooper City: | 28.6 |
| Miramar: | 17.8 |
| Davie: | 14.2 |
| Fort Lauderdale: | 9.8 |
 32.4% incidents where reported in the morning and 67.6% in the evening. The most fires (16.0%) took place on Sunday, and the least (13.2%) on Thursday.
 Based on the 5,292 incident reports from years 2003 - 2018 most fires (9.8%) took place during January, and the least (7.2%) in June.
 Out of all 134,086 cases reported during the years 2003 - 2018, the most belonged to the categories: Rescue & EMS (70.4%), Good Intent Call (11.3%), and False Alarm (5.5%).
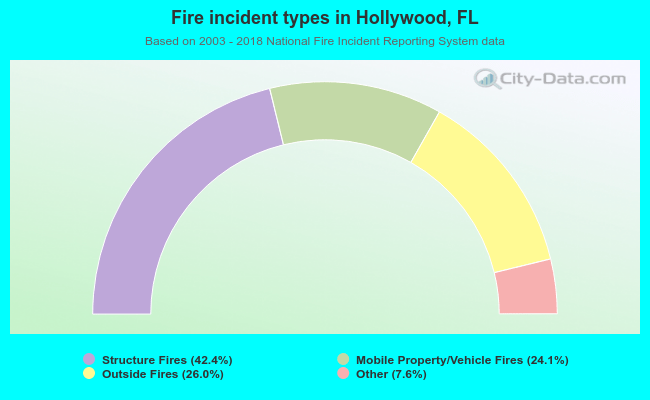 When looking into fire subcategories, the most incidents belonged to: Structure Fires (42.4%), and Outside Fires (26.0%).