Hughson: Fire Incidents, California (CA)
Where are fire incidents reported in Hughson, CA
Something went wrong! Please refresh the page.
|
| |||||||||||||||||||||||||||||||||||||||||||||||||||||||||||||||||||||||||||||||||||||||||||||||||||||||||||||
2005 - 2018 National Fire Incident Reporting System (NFIRS) incidents
- Incident types reported to NFIRS in Hughson, CA
- 1,61963.1%Rescue & EMS
- 39515.4%Fire
- 1927.5%Good Intent Call
- 1626.3%Service Call
- 943.7%Hazardous Condition
- 913.5%False Alarm
- 100.4%Special Incident
- 30.1%Overpressure Rupture
- Fire incident types reported to NFIRS in Hughson, CA
- 13333.7%Structure Fires
- 11228.4%Outside Fires
- 7719.5%Other
- 7318.5%Mobile Property/Vehicle Fires
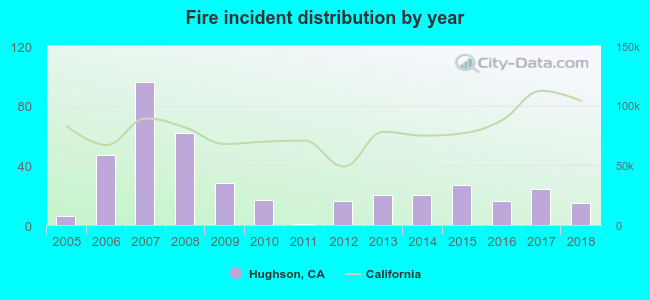 According to the data from the years 2005 - 2018 the average number of fires per year is 28. The highest number of fire incidents - 96 took place in 2007, and the least - 1 in 2011. The data has an increasing trend.
The average number of yearly fire incidents per 10k residents in Hughson, CA compared to nearest cities:
(Note: Based on data for the last 3 years, including only cities with population 5,000 and above)
| Hughson: | 25.4 |
| Keyes: | 22.3 |
| Ceres: | 36.3 |
| Waterford: | 54.2 |
| Turlock: | 16.4 |
| Modesto: | 68.9 |
| Riverbank: | 32.8 |
| Oakdale: | 39.2 |
| Delhi: | 81.2 |

 33.7% incidents where reported in the morning and 66.3% in the evening. The most fires (18.7%) took place on Monday, and the least (11.4%) on Wednesday.
 Based on the 395 reports from years 2005 - 2018 most fires (14.4%) took place during July, and the least (4.6%) in December.
 Out of all 2,566 cases reported during the years 2005 - 2018, the most belonged to the categories: Rescue & EMS (63.1%), Fire (15.4%), and Good Intent Call (7.5%).
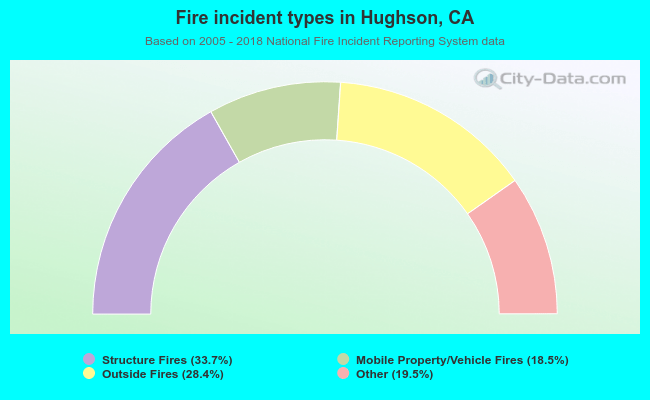 When looking into fire subcategories, the most reports belonged to: Structure Fires (33.7%), and Outside Fires (28.4%).