Oakdale: Fire Incidents, California (CA)
Where are fire incidents reported in Oakdale, CA
Something went wrong! Please refresh the page.
|
| |||||||||||||||||||||||||||||||||||||||||||||||||||||||||||||||||||||||||||||||||||||||||||||||||||||||||||||
2005 - 2018 National Fire Incident Reporting System (NFIRS) incidents
- Incident types reported to NFIRS in Oakdale, CA
- 4,37551.4%Rescue & EMS
- 1,20714.2%Good Intent Call
- 1,08912.8%Fire
- 8349.8%Service Call
- 6287.4%Hazardous Condition
- 3494.1%False Alarm
- 260.3%Special Incident
- Fire incident types reported to NFIRS in Oakdale, CA
- 58653.8%Outside Fires
- 33530.8%Structure Fires
- 14913.7%Mobile Property/Vehicle Fires
- 191.7%Other
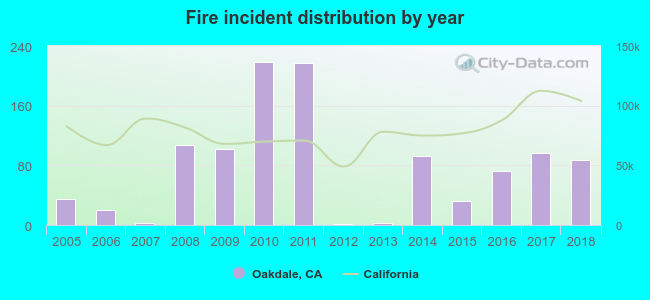 Based on the data from the years 2005 - 2018 the average number of fire incidents per year is 78. The highest number of reported fire incidents - 219 took place in 2010, and the least - 1 in 2012. The data has a rising trend.
The average number of yearly fire incidents per 10k residents in Oakdale, CA compared to nearest cities:
(Note: Based on data for the last 3 years, including only cities with population 5,000 and above)
| Oakdale: | 39.2 |
| Riverbank: | 32.8 |
| Escalon: | 70.4 |
| Waterford: | 54.2 |
| Modesto: | 68.9 |
| Hughson: | 25.4 |
| Ceres: | 36.3 |
| Salida: | 6.6 |
| Keyes: | 22.3 |
 The median response time based on all reported fire incidents is 6 minutes. This is comparable to the California median value.
The median response time in Oakdale, CA compared to nearest cities:
(Note: Based on data for all years, including only cities with at least 500 fire incidents)
| Oakdale: | 6 minutes |
| Riverbank: | 6 minutes |
| Modesto: | 5 minutes |
| Ceres: | 5 minutes |
| Ripon: | 6 minutes |
| Turlock: | 5 minutes |
| Manteca: | 5 minutes |
| Linden: | 8 minutes |
| Delhi: | 7 minutes |
 33.4% incidents where reported in the morning and 66.6% in the evening. The most fires (17.0%) took place on Wednesday, and the least (12.8%) on Saturday.
 Based on the 1,089 reports from years 2005 - 2018 most fires (15.2%) took place during June, and the least (4.5%) in February.
 Out of all 8,517 cases reported during the years 2005 - 2018, the most belonged to the categories: Rescue & EMS (51.4%), Good Intent Call (14.2%), and Fire (12.8%).
 When looking into fire subcategories, the most incidents belonged to: Outside Fires (53.8%), and Structure Fires (30.8%).