Turlock: Fire Incidents, California (CA)
Where are fire incidents reported in Turlock, CA
Something went wrong! Please refresh the page.
| Fire incidents reported | |
|---|---|
| Sreet name | Count |
| US 99 | 392 |
| MAIN ST | 230 |
| GOLDEN STATE BLVD | 220 |
| GEER RD | 218 |
| LANDER AVE | 198 |
| MONTE VISTA AVE | 132 |
| OLIVE AVE | 104 |
| ANGELUS ST | 100 |
| WALNUT RD | 92 |
| COUNTRYSIDE DR | 86 |
| CANAL DR | 82 |
| PEDRAS RD | 80 |
| SODERQUIST RD | 76 |
| SOUTH AVE | 72 |
| TULLY RD | 72 |
| FIRST ST | 68 |
| FULKERTH RD | 66 |
| HAWKEYE AVE | 64 |
| LINWOOD AVE | 64 |
| VERMONT AVE | 64 |
| BROADWAY | 60 |
| D ST | 60 |
| PIONEER AVE | 54 |
| PALM ST | 52 |
| TEGNER RD | 48 |
| TUOLUMNE RD | 46 |
| LOCUST ST | 42 |
| BERKELEY AVE | 40 |
| EAST AVE | 40 |
| LAUREL ST | 40 |
2004 - 2018 National Fire Incident Reporting System (NFIRS) incidents
- Incident types reported to NFIRS in Turlock, CA
- 8,50351.8%Rescue & EMS
- 2,74216.7%Fire
- 2,14613.1%Good Intent Call
- 1,3958.5%Service Call
- 9015.5%Hazardous Condition
- 6794.1%False Alarm
- 320.2%Overpressure Rupture
- Fire incident types reported to NFIRS in Turlock, CA
- 1,34649.1%Outside Fires
- 74027.0%Structure Fires
- 51918.9%Mobile Property/Vehicle Fires
- 1375.0%Other
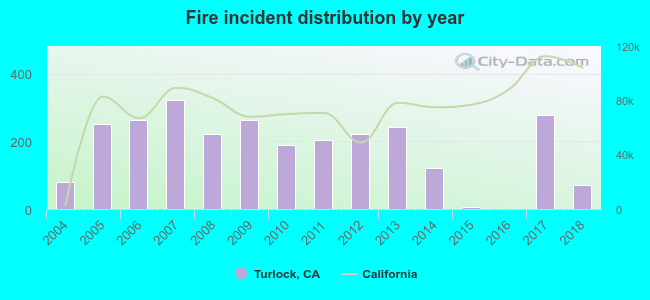 Based on the data from the years 2004 - 2018 the average number of fires per year is 182. The highest number of fire incidents - 321 took place in 2007, and the least - 1 in 2016. The data has a declining trend.
The average number of yearly fire incidents per 10k residents in Turlock, CA compared to nearest cities:
(Note: Based on data for the last 3 years, including only cities with population 5,000 and above)
| Turlock: | 16.4 |
| Keyes: | 22.3 |
| Delhi: | 81.2 |
| Hughson: | 25.4 |
| Ceres: | 36.3 |
| Waterford: | 54.2 |
| Livingston: | 21.0 |
| Modesto: | 68.9 |
| Winton: | 48.1 |
 The median response time based on all reported fire incidents is 5 minutes. This is lower compared to the California median value.
The median response time in Turlock, CA compared to nearest cities:
(Note: Based on data for all years, including only cities with at least 500 fire incidents)
| Turlock: | 5 minutes |
| Delhi: | 7 minutes |
| Ceres: | 5 minutes |
| Modesto: | 5 minutes |
| Winton: | 6 minutes |
| Patterson: | 5 minutes |
| Riverbank: | 6 minutes |
| Atwater: | 9 minutes |
| Oakdale: | 6 minutes |
 According to the reports from the years 2004 - 2018 the average number of fire-related casualties per year is 3. The highest number of reported injuries - 8 took place in 2006, and the lowest - 0 in 2004. The data has an increasing trend.
The average number of casualties per 1,000 fires is 15. This indicator was the highest - 31 in 2006, and the lowest 0 in 2004. The trend for injuries per 1,000 incidents is increasing. Compared to the state value the number of casualties per 1,000 fire incidents is much higher.
According to the reports from the years 2004 - 2018 the average number of fire-related casualties per year is 3. The highest number of reported injuries - 8 took place in 2006, and the lowest - 0 in 2004. The data has an increasing trend.
The average number of casualties per 1,000 fires is 15. This indicator was the highest - 31 in 2006, and the lowest 0 in 2004. The trend for injuries per 1,000 incidents is increasing. Compared to the state value the number of casualties per 1,000 fire incidents is much higher.
 32.7% incidents where reported in the morning and 67.3% in the evening. The most fires (15.1%) took place on Monday, and the least (13.0%) on Friday.
 According to the 2,742 fire incidents from years 2004 - 2018 most fires (13.3%) took place during June, and the least (5.1%) in November.
 Out of all 16,400 cases reported during the years 2004 - 2018, the most belonged to the categories: Rescue & EMS (51.8%), Fire (16.7%), and Good Intent Call (13.1%).
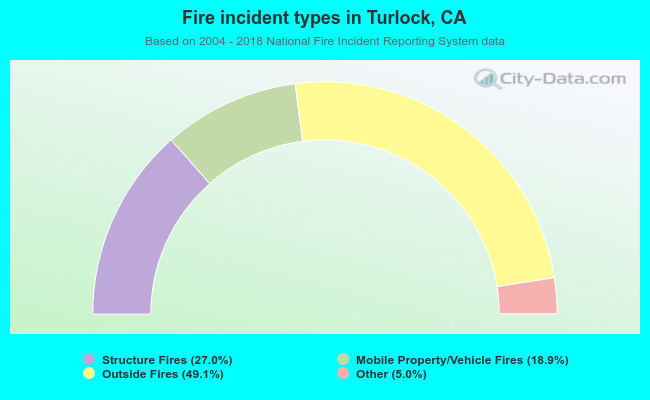 When looking into fire subcategories, the most reports belonged to: Outside Fires (49.1%), and Structure Fires (27.0%).