Please register to participate in our discussions with 2 million other members - it's free and quick! Some forums can only be seen by registered members. After you create your account, you'll be able to customize options and access all our 15,000 new posts/day with fewer ads.
This says a LOT more about income distribution inequality and the fraud that is the American dream than what it days about rich people paying taxes.
The largest concentration of AGI is incomes between $50,000 - $500,000. That's 63.5% of all AGI for a total of (*drum-roll please*) $4.85 trillion dollars. The largest single bracket is those making between $100,000 - $200,000 which makes up 23.6% of all returns.
So maybe it's time to get off your ass and go figure out how to earn some more money or you could just sit here and keep complaining that the money hasn't fallen into your lap dropped off by a magic Obama unicorn.
$50k to $500k is a pretty wide range there pal, it is easy to hide the true income inequality picture behind such a data set.
I'm guessing that the ppl at the higher end, say $250k to $500k, of your data set are earning a much bigger piece of the pie and that the number of income units is much smaller.
You seem to like playing with numbers, throwing out bits and pieces without putting them in proper context. We all know you can make data say anything when you pull numbers out of your butt without showing them in context, you remind us of that with every one of your posts.
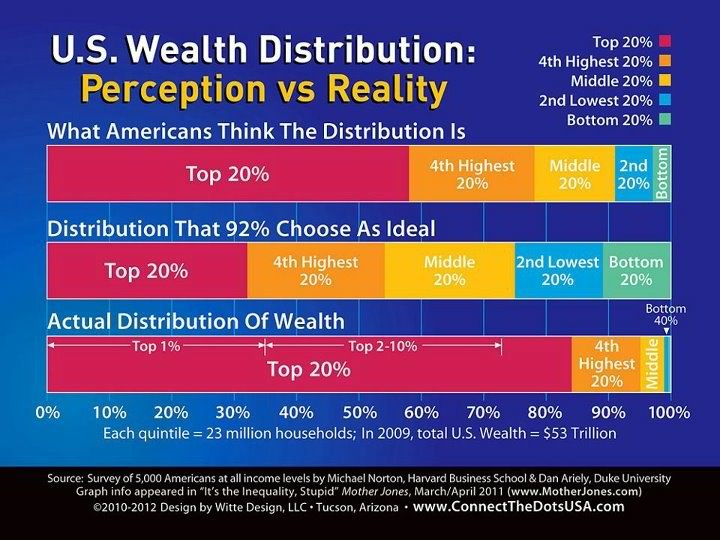
Below, you will find three graphics. The middle is where Americans think the breakdown of income SHOULD be. The top is where they think it is and the bottom is where it actually is.
Below is the same thing from the Harvard Business School:
This illustration is important when conservatives crow about 'broadening the base' and 'skin in the game.' Basically, they are talking about taxing that sliver of wealth on the far right, the poor people. The top 20% have 85% of the wealth. So when we discuss taxes, we have to discuss that group, since that's where the money is.
...and from the Time's we see why there is so much room between $50K and $500K. Basically, BigJohn is saying most of the income comes from below the top 0.9%. Duh.
The largest concentration of AGI is incomes between $50,000 - $500,000. That's 63.5% of all AGI for a total of (*drum-roll please*) $4.85 trillion dollars. The largest single bracket is those making between $100,000 - $200,000 which makes up 23.6% of all returns.
So maybe it's time to get off your ass and go figure out how to earn some more money or you could just sit here and keep complaining that the money hasn't fallen into your lap dropped off by a magic Obama unicorn.
Income over $100K generally comes from sources other than wages, so a relevant question here is, how the heck are wage slaves supposed to get non-wage income?
Income over $100K generally comes from sources other than wages, so a relevant question here is, how the heck are wage slaves supposed to get non-wage income?
What ? Engineers, Accountants, Physical therapists; most degreed professionals can easily earn over 100K a year with some experience and time on the job. So can middle managers.
Heck, even automotive fleet managers make over $100K per year.
What ? Engineers, Accountants, Physical therapists; most degreed professionals can easily earn over 100K a year with some experience and time on the job. So can middle managers.
Heck, even automotive fleet managers make over $100K per year.
I dunno if it makes any difference but are'nt all of those positions salaried and not hourly?
Please register to post and access all features of our very popular forum. It is free and quick. Over $68,000 in prizes has already been given out to active posters on our forum. Additional giveaways are planned.
Detailed information about all U.S. cities, counties, and zip codes on our site: City-data.com.

 Please register to participate in our discussions with 2 million other members - it's free and quick! Some forums can only be seen by registered members. After you create your account, you'll be able to customize options and access all our 15,000 new posts/day with fewer ads.