Please register to participate in our discussions with 2 million other members - it's free and quick! Some forums can only be seen by registered members. After you create your account, you'll be able to customize options and access all our 15,000 new posts/day with fewer ads.
Hmm. I thought part of the reason for Mt. Washington's erratic and windy weather was because it lay on a storm convergence track. Or maybe because the jet stream is especially fast?
I'll repeat what I said earlier; much of the cloudiness I noticed in upstate NY seemed to be unconnected to any storm system and hanged there, staying gray without much weather except for some sporadically drizzle (in both the liquid and frozen forms). We were often getting the tail of lake effect precipitation, so it was in the form of lake effect cloud rather than lake effect snow/rain.
I think one of the biggest reasons for Mt. Washington’s erratic and windy weather is its near 7000 foot elevation. Highlands are notorious for quick changing weather conditions. The jet stream is at 30,000 feet, so it would have zero impact on Mt. Washington in that regard. If you mean jet max (in terms of storm directions)...the path much of the year is west of MTW.
Quote:
Originally Posted by nei
Perhaps those photos are from the winter.
Very few places in the US are as sunny as Sydney in the winter. That sunshine distribution looks very odd to me.
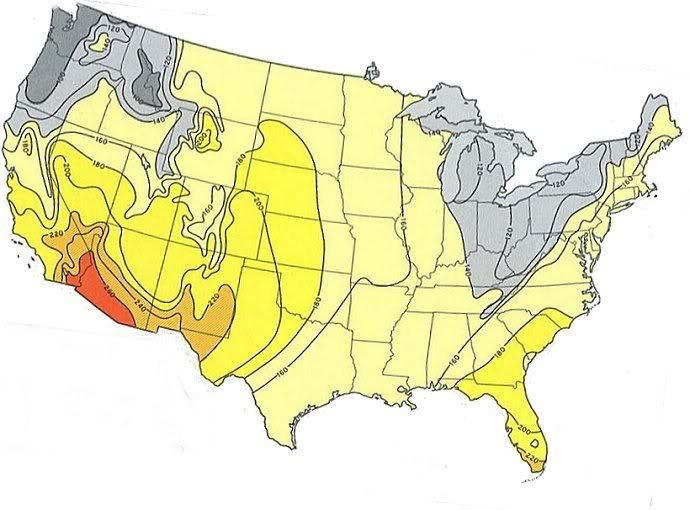
One other note…the above is not really accurate – if you mean comparing winter sun hrs in Sydney to winter sun hrs in the USA. In June/July/Aug - Sydney has a three month average of 194 hrs of sunshine (165/198/220):
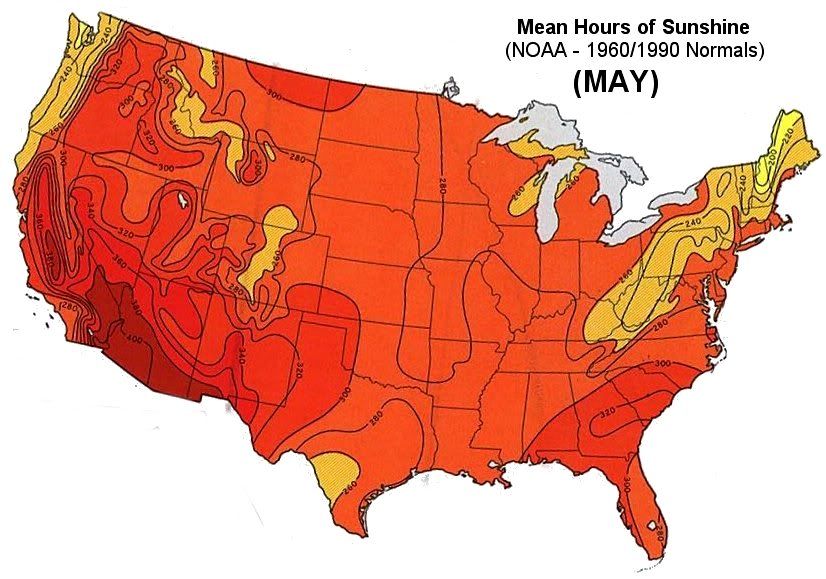
Even in mid winter (Feb)... vast areas of the western USA and most of Florida receive just as much, and in many case much more than 194 hrs of sunshine. Of course, much the rest of the year (April – Nov) many areas of the USA get as much or more sun hrs than Sydney. By even May - most areas of the USA blow the doors of Sydney in terms of sunshine hrs.
The comment above about the pics of the Opera House and blue skies in Sydney is not a new one amoung travelers ...
It wasn't easy. The data was for 1967-68, so the "chain of information" may be different now. As I recall I enquired (about 2 years ago) at some NOAA/NCDC website and then got shunted though several places before finally being able to purchase the data (full monthly summaries of various climate elements for Midway Airport). The page footers refer to the US Dept. of Commerce, Environmental Sciences Services Administration.
I am inclined to use a mental adjustment of about 200-300 hours until and if someone can finally give me some technical notion of how the methods of measurement relate.
It seems difficult to find out what type of method the US uses. I wonder if it is just an observer jotting down whether or not the sun is shining throughout the day? Seems like a rather inadequate or very inconsistent means of measuring an element of daily weather.
Based on what you are saying it appears that cities in Australia and NZ would actually be gaining hundreds of sun hours, or the US losing, to compare "apples and apples" so to speak. If that is the case then, Sydney is much sunnier, as well as Melbourne. Sydney for example would rank about 2800 hours compared to a US city. Sydney would then be as sunny as say Jacksonville, FL, at around 63% possible.
One other note…the above is not really accurate – if you mean comparing winter sun hrs in Sydney to winter sun hrs in the USA. In June/July/Aug - Sydney has a three month average of 194 hrs of sunshine (165/198/220):
Even in mid winter (Feb)... vast areas of the western USA and most of Florida receive just as much, and in many case much more than 194 hrs of sunshine. Of course, much the rest of the year (April – Nov) many areas of the USA get as much or more sun hrs than Sydney. By even May - most areas of the USA blow the doors of Sydney in terms of sunshine hrs.
The comment above about the pics of the Opera House and blue skies in Sydney is not a new one amoung travelers ...
Sydney Aero averages for those months are actually 179/205/242, a 3-month average of 209 hours. And I will, as per posted already, continue to have my reservations about direct comparisons between US sunshine measurements and those in UK, Canada, Australia and New Zealand.
It seems difficult to find out what type of method the US uses. I wonder if it is just an observer jotting down whether or not the sun is shining throughout the day? Seems like a rather inadequate or very inconsistent means of measuring an element of daily weather.
Based on what you are saying it appears that cities in Australia and NZ would actually be gaining hundreds of sun hours, or the US losing, to compare "apples and apples" so to speak. If that is the case then, Sydney is much sunnier, as well as Melbourne. Sydney for example would rank about 2800 hours compared to a US city. Sydney would then be as sunny as say Jacksonville, FL, at around 63% possible.
Yes, I think that's perfectly feasible. The description of sunshine as measured on the CS equipment always refers to bright sunshine (increments are in tenths of an hour). This may not be easy to maintain consistently over seasons of course, but overall I think it tries to adhere to a narrower standard than the US minute-by-minute (a Chicago weather site always refers to individual minutes of sunshine) version, however that is assessed.
Apart from northern and eastern parts of Australia, there is a large hinterland of South Africa that is relatively sunnier in winter than in summer, and a significant part of Brazil as well. And then of course there are the remaining monsoonal zones.
Still surprised; I expect maritime climates to have a strong winter sunshine minimum, similar to the US west coast and the UK.
Care to explain what your maps mean? I gather that there's high pressure in the winter and lower pressure in the summer. So the lower pressure is leading to more cloudiness?
Do the pressure maps mean the prevailing wind direction is from the S/SW in July and W in January?
To simplify somewhat (I am certainly not claiming this as authoritative, just an indicator):
In Sydney in January, the wind roses at 9am and 3pm, particularly the latter, show far more easterly onshore flow than westerly directions. The highest pressure belt is further south and west and so the gradient flow (anticlockwise around anticyclones!) helps to favour easterly directions. Sea breeze effects add to this and are quite major near the coasts because of the large hot landmass inland. "Southerly buster" phases also help reduce summer sunshine. In July however, the highest pressures are further north and this favours either lighter breezes or more westerlies, as pressures are lower further south.
Inland at Canberra seasonal changes are less marked, with a small dip from May-July but otherwise near-uniform percentages.
Adelaide's cloudiness profile is the opposite of Sydney's because it is further south and on the coast - into the higher pressures in summer, and in westerly flow south of them in winter.
In NZ's case the more coastal parts of North Otago and South Canterbury have a complete cloudiness reversal because the summer easterly seabreeze effect is quite strong, while the same areas get some sheltering from winter southwesterlies and southerlies because of topography - curvature of the coast.
About 80% of NZ's South Island runs counter to your maritime model, with prevailing windflows and topography producing several different flavours.
Incidentally, on the list I have for the US, San Diego has almost 7% more of the possible sun in DJF than in JJA.
Sydney Aero averages for those months are actually 179/205/242, a 3-month average of 209 hours. And I will, as per posted already, continue to have my reservations about direct comparisons between US sunshine measurements and those in UK, Canada, Australia and New Zealand.
Just looking at sun hours for Toronto & Windsor, Ontario vs, Detroit and Buffalo it appears something is awry. Detroit, right across the river from Windsor has listed in Wiki 170 more sun hours per year, and Buffalo has 166 hours more than Toronto. Toronto would seem to have more being north of the lake. Yes, def US numbers seem "liberal" compared to Canada and I guess Aus, NZ, UK. We should all keep that in mind when comparing sunshine hours and slagging places off (for those who like sun).
Melbourne, Aus isn't that cloudy afterall. And Sydney may just eke out more sun than Charleston, SC if we add 300 hours to Sydney (if we take your 200-300 hour correction)
Last edited by nei; 11-22-2011 at 02:30 PM..
Reason: fixed quote display
Just looking at sun hours for Toronto & Windsor, Ontario vs, Detroit and Buffalo it appears something is awry. Detroit, right across the river from Windsor has listed in Wiki 170 more sun hours per year, and Buffalo has 166 hours more than Toronto. Toronto would seem to have more being north of the lake. Yes, def US numbers seem "liberal" compared to Canada and I guess Aus, NZ, UK. We should all keep that in mind when comparing sunshine hours and slagging places off (for those who like sun).
Melbourne, Aus isn't that cloudy afterall. And Sydney may just eke out more sun than Charleston, SC if we add 300 hours to Sydney (if we take your 200-300 hour correction)
Yep. I suspect that if I'm right a proportional adjustment might be roughly best, say for example 200 per 2000, 300 per 3000 etc.
Yep. I suspect that if I'm right a proportional adjustment might be roughly best, say for example 200 per 2000, 300 per 3000 etc.
This got me thinking that the sunniest areas of the UK, which average around 1900 hours, maybe be sunnier than Seattle at 43%.
I emailed my local weather office about sun hours and how they are measured (whether by machine or observation) and they directed me to the National NCDC office. So I emailed them. I also asked about how our measurements may compare to say Canada or the UK. They ignored that bit. I got this reply:
"The measurement is made by a recording device. NCDC does not have records of which types were used at each station during each year.
The % of possible is determined by dividing the actual number of minutes of sunshine by the known total possible minutes."
I also asked if a S-C device (NZ, etc) is used and they reiterated that they don't keep records of the machines at each location.
It seems they don't even have a standard method used nationally, and I guess is up to each individual location. But when you ask your local NWS office they refer you to NCDC. I'm not sure you can equally compare loctions in the US as they don't even know what location is using what method.
Bottom line is that sun hours in the US don't seem to be taken as serious as other weather elements and really can't be compared to anywhere else for an exact "apples to apples" comparison.
Thanks, very interesting. It rather confirms my suspicions I think.
Please register to post and access all features of our very popular forum. It is free and quick. Over $68,000 in prizes has already been given out to active posters on our forum. Additional giveaways are planned.
Detailed information about all U.S. cities, counties, and zip codes on our site: City-data.com.

 Please register to participate in our discussions with 2 million other members - it's free and quick! Some forums can only be seen by registered members. After you create your account, you'll be able to customize options and access all our 15,000 new posts/day with fewer ads.