Apex, NC (North Carolina) Houses and Residents
| Apex: | $564,400 |
| North Carolina: | $280,600 |
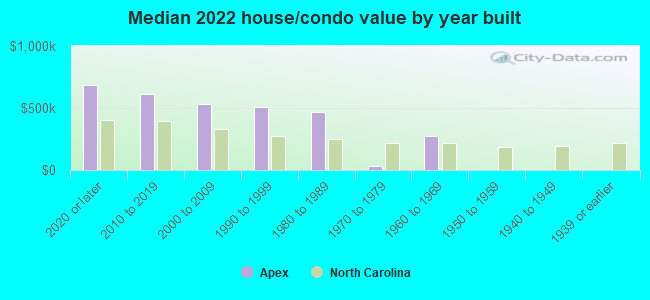
Mean price in 2022:
Detached houses: $401,092
Here: $401,092 State: $375,326 Townhouses or other attached units: $249,304
Here: $249,304 State: $317,935 In 3-to-4-unit structures: $298,218
Here: $298,218 State: $254,939 In 5-or-more-unit structures: $208,939
Here: $208,939 State: $329,290 Mobile homes: $136,505
Here: $136,505 State: $124,933
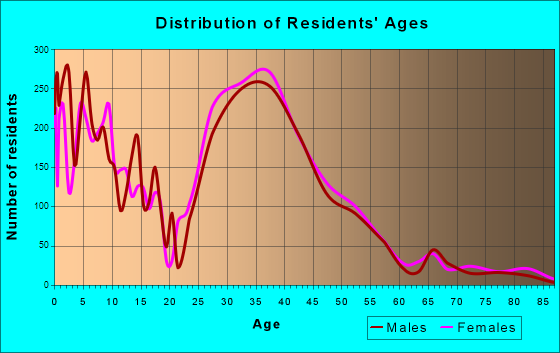
Total population: 43,907 (Urban population: 20,023, Rural population: 49 (all nonfarm))
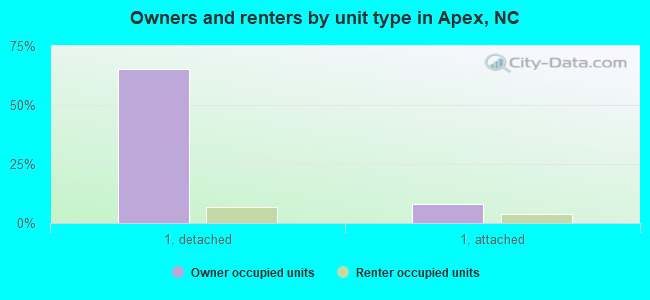
Houses: 26,040 (25,158 occupied: 20,035 owner occupied, 5,123 renter occupied)
| % of renters here: | 20% |
| State: | 33% |
Housing density: 2,471 houses/condos per square mile
Median price asked for vacant for-sale houses and condos in 2022: $1,062,839.
Median contract rent in 2022: $1,596 (lower quartile is $1,313, upper quartile is $1,989)
Median rent asked for vacant for-rent units in 2022: $1,338
Median gross rent in Apex, NC in 2022: $1,853
Housing units in Apex with a mortgage: 14,957 (1,719 second mortgage, 0 home equity loan, 1,511 both second mortgage and home equity loan)
Houses without a mortgage: 189
Median household income for houses/condos with a mortgage: $163,645
Median household income for apartments without a mortgage: $110,789
Median monthly housing costs: $1,752
Compare current foreclosures in Apex, NC:
| Photo | Address | Area | Beds / Baths | Price | Details |
|---|---|---|---|---|---|

|
#1
Center St
Apex, NC 27502
|
1,053 sq. feet
|
2 baths - beds |
show details | |

|
#2
John Horton Rd
Apex, NC 27523
|
1,741 sq. feet
|
1 baths 3 beds |
show details | |

|
#3
Brasstown Ln
Apex, NC 27502
|
3,466 sq. feet
|
2 baths - beds |
show details | |

|
#4
Eastleigh Ct
Apex, NC 27502
|
2,976 sq. feet
|
2 baths - beds |
show details | |

|
#5
Thorncrest Dr
Apex, NC 27539
|
1,060 sq. feet
|
2 baths - beds |
show details | |

|
#6
Rushden Way, C O Gleb Makhailov
Apex, NC 27502
|
2,979 sq. feet
|
3 baths - beds |
show details | |

|
#7
Piney Woods Ln
Apex, NC 27502
|
2,338 sq. feet
|
2 baths - beds |
show details | |

|
#8
Patterson Grove Rd
Apex, NC 27502
|
2,201 sq. feet
|
2 baths - beds |
show details | |

|
#9
Haywards Heath Ln
Apex, NC 27502
|
2,246 sq. feet
|
2 baths - beds |
show details | |

|
#10
Thorncrest Dr
Apex, NC 27539
|
1,239 sq. feet
|
2 baths - beds |
show details |
| Photo | Address | Area | Beds / Baths | Price | Details |
|---|---|---|---|---|---|

|
#11
High Lonesome Ln
Apex, NC 27539
|
3,555 sq. feet
|
3 baths - beds |
show details | |

|
#12
Churchwood Dr
Apex, NC 27502
|
2,338 sq. feet
|
2 baths - beds |
show details | |

|
#13
Briarfield Dr
Apex, NC 27502
|
4,328 sq. feet
|
3 baths - beds |
show details | |

|
#14
Pilot Mountain Ct
Apex, NC 27502
|
3,556 sq. feet
|
2 baths - beds |
show details | |

|
#15
Wirks Worth Cir
Apex, NC 27502
|
2,456 sq. feet
|
3 baths - beds |
show details | |

|
#16
Coppercoin Ct
Apex, NC 27502
|
2,994 sq. feet
|
2 baths - beds |
show details | |

|
#17
Brantley Dr
Apex, NC 27539
|
1,560 sq. feet
|
1 baths - beds |
show details | |

|
#18
Horsham Way
Apex, NC 27502
|
3,186 sq. feet
|
2 baths - beds |
show details | |

|
#19
Bungalow Park Dr
Apex, NC 27502
|
1,368 sq. feet
|
2 baths - beds |
show details | |

|
#20
Chaumont Dr
Apex, NC 27539
|
- sq. feet
|
- baths - beds |
show details |
| Photo | Address | Area | Beds / Baths | Price | Details |
|---|---|---|---|---|---|

|
#21
Macbeth Ln
Apex, NC 27502
|
- sq. feet
|
- baths - beds |
show details | |

|
#22
Carradonna Way
Apex, NC 27502
|
- sq. feet
|
- baths - beds |
show details | |

|
#23
Apex Peakway # 147
Apex, NC 27502
|
- sq. feet
|
- baths - beds |
show details | |

|
#24
Toad Hollow Trl
Apex, NC 27502
|
- sq. feet
|
- baths - beds |
show details | |

|
#25
Nasturtium Way
Apex, NC 27539
|
- sq. feet
|
- baths - beds |
show details | |

|
#26
Summit Lake Dr
Apex, NC 27523
|
- sq. feet
|
- baths - beds |
show details | |

|
#27
Creek Glen Way
Apex, NC 27502
|
- sq. feet
|
- baths - beds |
show details | |

|
#28
Cameron Woods Dr
Apex, NC 27523
|
- sq. feet
|
- baths - beds |
show details | |

|
#29
Olive St
Apex, NC 27502
|
- sq. feet
|
- baths - beds |
show details | |

|
#30
Alsace Dr
Apex, NC 27502
|
- sq. feet
|
- baths - beds |
show details |
| Photo | Address | Area | Beds / Baths | Price | Details |
|---|---|---|---|---|---|

|
#31
Johnson Pond Rd
Apex, NC 27539
|
- sq. feet
|
- baths - beds |
show details | |

|
#32
Evening Star Dr
Apex, NC 27502
|
- sq. feet
|
- baths - beds |
show details | |

|
#33
Cameron Woods Dr
Apex, NC 27523
|
- sq. feet
|
- baths - beds |
show details | |

|
#34
Cross Timber Ln
Apex, NC 27539
|
- sq. feet
|
- baths - beds |
show details | |

|
#35
Baberton Dr
Apex, NC 27502
|
- sq. feet
|
- baths - beds |
show details | |

|
#36
Bullhead Rd
Apex, NC 27502
|
- sq. feet
|
- baths - beds |
show details | |

|
#37
Lookout Ridge Rd
Apex, NC 27502
|
- sq. feet
|
- baths - beds |
show details | |

|
#38
Straywhite Ave
Apex, NC 27539
|
- sq. feet
|
- baths - beds |
show details | |

|
#39
Willow Green Dr
Apex, NC 27502
|
- sq. feet
|
- baths - beds |
show details | |

|
#40
Bellwynd Dr
Apex, NC 27539
|
- sq. feet
|
- baths - beds |
show details |
| Photo | Address | Area | Beds / Baths | Price | Details |
|---|---|---|---|---|---|

|
#41
Tiemouse Ln
Apex, NC 27523
|
- sq. feet
|
- baths - beds |
show details | |

|
#42
Broadstone Way
Apex, NC 27502
|
- sq. feet
|
- baths - beds |
show details | |

|
#43
Mill Hopper Ln
Apex, NC 27502
|
- sq. feet
|
- baths - beds |
show details | |

|
#44
Goldenview Acres Ct
Apex, NC 27502
|
- sq. feet
|
- baths - beds |
show details | |

|
#45
Nasturtium Way
Apex, NC 27539
|
- sq. feet
|
- baths - beds |
show details | |

|
#46
Red Rock Dr
Apex, NC 27539
|
- sq. feet
|
- baths - beds |
show details | |

|
#47
Cedar Hedge Ct
Apex, NC 27523
|
- sq. feet
|
- baths - beds |
show details | |

|
#48
Cameron Woods Dr
Apex, NC 27523
|
- sq. feet
|
- baths - beds |
show details | |

|
#49
Branch Line Ln
Apex, NC 27502
|
- sq. feet
|
- baths - beds |
show details | |

|
Check over 1 million property listings on Foreclosure.com!
|
browse all offers | |||

Latest news about housing in Apex, NC collected exclusively by city-data.com from local newspapers, TV, and radio stations

 | Apartments/Townhomes for rent that don't allow pets? (7 replies) |
| Apex homes robbed during open houses (19 replies) |
| New build rentals or homes recommendations in the Triangle (13 replies) |
| Quality of condos/townhomes in the < 175K range (9 replies) |
| Short term rentals(condo/townhouse) around Apex? (0 replies) |
| Colvin Park, Apex, NC Taylor Morrison Homes (2 replies) |
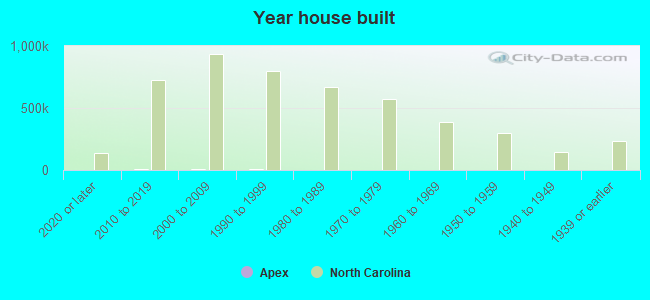
Median year apartment built: 2009
Household type by relationship:
Households: 71,064- Male householders: 14,764 (2,346 living alone), Female householders: 10,394 (2,521 living alone)
16,052 spouses (15,837 opposite-sex spouses), 601 unmarried partners, (555 opposite-sex unmarried partners), 24,883 children (24,198 natural, 70 adopted, 615 stepchildren), 67 grandchildren, 71 brothers or sisters, 1,247 parents, 0 foster children, 590 other relatives, 2,245 non-relatives
- In group quarters: 150
Size of family households: 6,290 2-persons, 5,398 3-persons, 5,447 4-persons, 1,284 5-persons, 541 6-persons, 218 7-or-more-persons.
Size of nonfamily households: 4,867 1-person, 662 2-persons, 273 3-persons, 178 4-persons.
18,005 married couples with children.
2,763 single-parent households (96 men, 2,667 women).
79.0% of residents of Apex speak English at home.
4.3% of residents speak Spanish at home (79% speak English very well, 17% speak English well, 2% speak English not well, 2% don't speak English at all).
6.7% of residents speak other Indo-European language at home (84% speak English very well, 12% speak English well, 4% speak English not well).
10.1% of residents speak Asian or Pacific Island language at home (75% speak English very well, 18% speak English well, 5% speak English not well, 2% don't speak English at all).
0.7% of residents speak other language at home (92% speak English very well, 8% speak English well).
Foreign born population: 16,110 (22.7%)
(47.8% of them are naturalized citizens)
| Here: | 7.6 |
| State: | 6.4 |
| Here: | 5.2 |
| State: | 4.4 |
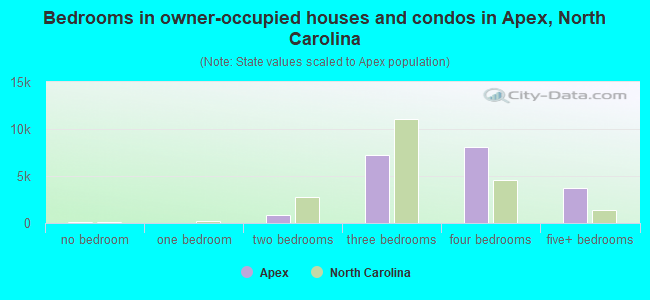
- Bedrooms in owner-occupied houses and condos in Apex, North Carolina
- 129no bedroom
- 01 bedroom
- 8942 bedrooms
- 7,2353 bedrooms
- 8,0994 bedrooms
- 3,6785+ bedrooms
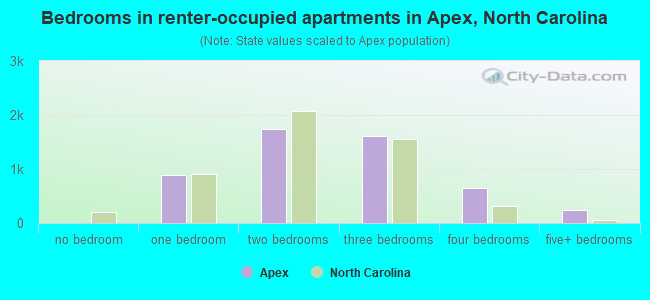
- Bedrooms in renter-occupied apartments in Apex, North Carolina
- 0no bedroom
- 8801 bedroom
- 1,7362 bedrooms
- 1,6133 bedrooms
- 6464 bedrooms
- 2485+ bedrooms
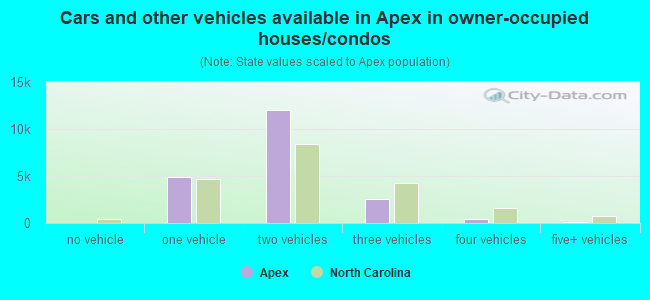
- Cars and other vehicles available in Apex in owner-occupied houses/condos
- 33no vehicle
- 4,8991 vehicle
- 11,9822 vehicles
- 2,5753 vehicles
- 3884 vehicles
- 1585+ vehicles
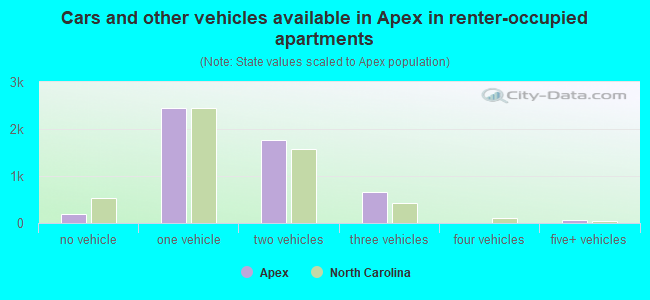
- Cars and other vehicles available in Apex in renter-occupied apartments
- 189no vehicle
- 2,4381 vehicle
- 1,7622 vehicles
- 6663 vehicles
- 04 vehicles
- 685+ vehicles
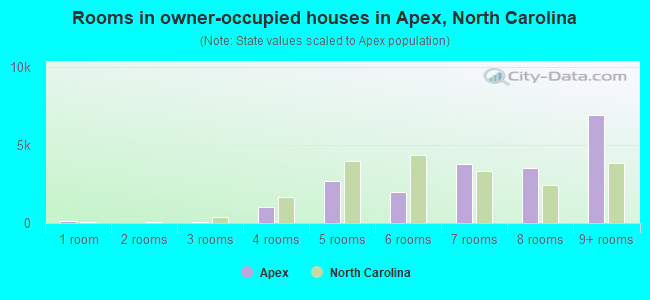
- Rooms in owner-occupied houses in Apex, North Carolina
- 1291 room
- 02 rooms
- 393 rooms
- 1,0254 rooms
- 2,7035 rooms
- 1,9696 rooms
- 3,7497 rooms
- 3,5098 rooms
- 6,9129+ rooms
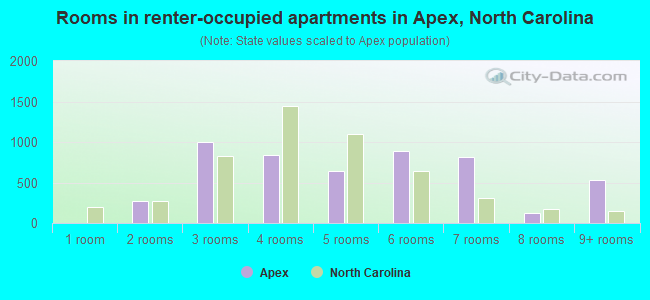
- Rooms in renter-occupied apartments in Apex, North Carolina
- 01 room
- 2752 rooms
- 1,0033 rooms
- 8344 rooms
- 6435 rooms
- 8936 rooms
- 8127 rooms
- 1288 rooms
- 5359+ rooms
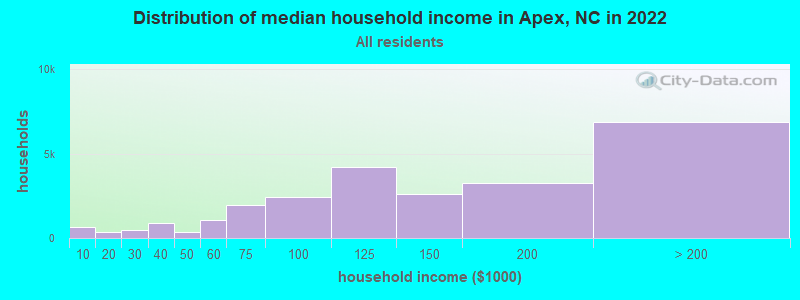
Apex, NC household income distribution

- 670Less than $10,000
- 334$10,000 to $19,999
- 451$20,000 to $29,999
- 908$30,000 to $39,999
- 372$40,000 to $49,999
- 1,074$50,000 to $59,999
- 1,961$60,000 to $74,999
- 2,423$75,000 to $99,999
- 4,222$100,000 to $124,999
- 2,620$125,000 to $149,999
- 3,259$150,000 to $199,999
- 6,864$200,000 or more
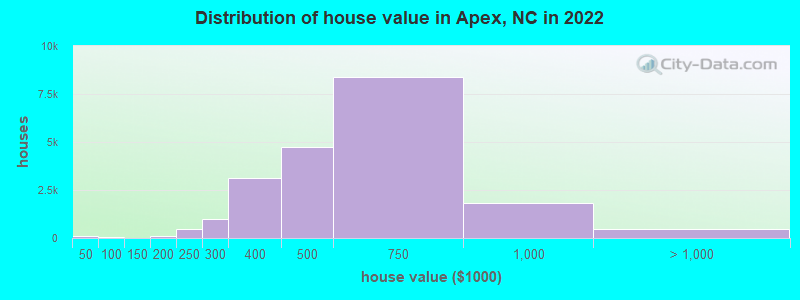
Home value of owner - occupied houses in 2022 in Apex, NC
-
- 39Less than $10,000
- 16$10,000 to $14,999
- 2$15,000 to $19,999
- 1$25,000 to $29,999
- 36$30,000 to $34,999
- 34$50,000 to $59,999
- 29$60,000 to $69,999
- 2$80,000 to $89,999
- 4$90,000 to $99,999
- 14$100,000 to $124,999
- 46$150,000 to $174,999
- 72$175,000 to $199,999
- 467$200,000 to $249,999
- 994$250,000 to $299,999
- 3,149$300,000 to $399,999
- 4,729$400,000 to $499,999
- 8,391$500,000 to $749,999
- 1,829$750,000 to $999,999
- 424$1,000,000 to $1,499,999
- 26$1,500,000 to $1,999,999
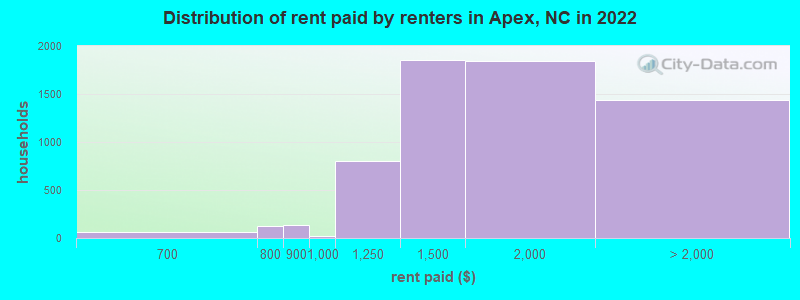
Rent paid by renters in 2022 in Apex, NC
-
- 40$600 to $649
- 17$650 to $699
- 59$700 to $749
- 62$750 to $799
- 133$800 to $899
- 21$900 to $999
- 805$1,000 to $1,249
- 1,851$1,250 to $1,499
- 1,848$1,500 to $1,999
- 812$2,000 to $2,499
- 394$2,500 to $2,999
- 54$3,000 to $3,499
- 95$3,500 or more
- 81No cash rent
Percentage of workers working in this county: 86.1%
Number of people working at home: 12,919 (36.0% of all workers)
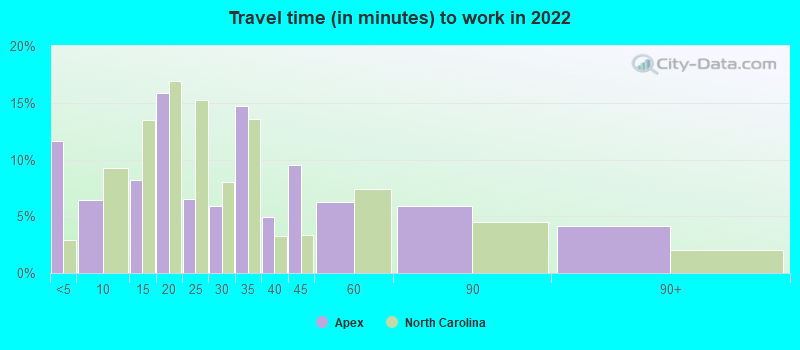
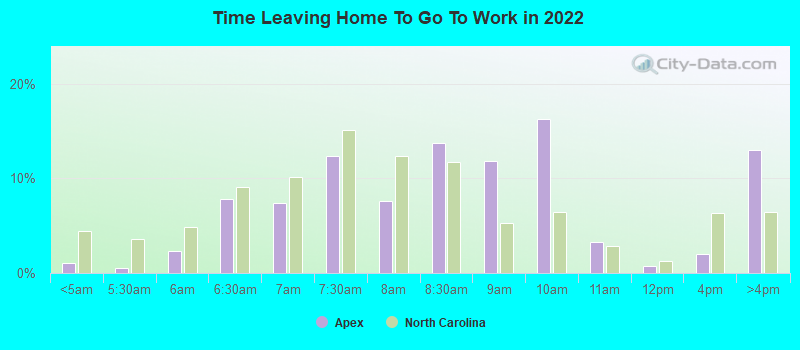
Travel time to work (commute)
- Less than 5 minutes: 2,276
- 5 to 9 minutes: 1,573
- 10 to 14 minutes: 2,974
- 15 to 19 minutes: 2,527
- 20 to 24 minutes: 5,441
- 25 to 29 minutes: 3,333
- 30 to 34 minutes: 3,958
- 35 to 39 minutes: 629
- 40 to 44 minutes: 436
- 45 to 59 minutes: 1,169
- 60 to 89 minutes: 582
- 90 or more minutes: 307
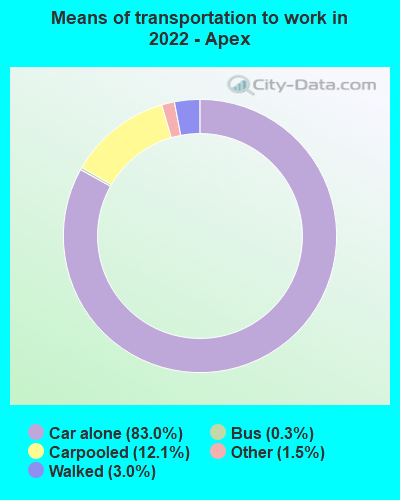
Means of transportation to work:
- Drove a car alone: 16,129 (51.4%)
- Carpooled: 2,517 (8.0%)
- Bus: 49 (0.2%)
- Long-distance train or commuter rail: 16 (0.1%)
- Taxi: 420 (1.3%)
- Bicycle: 3 (0.0%)
- Walked: 798 (2.5%)
- Worked at home: 12,919 (41.2%)
- Unemployment by race in 2022
- Unemployment rate for White non-Hispanic residents
- 3.3%Males
- 0.4%Females
- Unemployment rate for Black residents
- 1.9%Males
- Unemployment rate for Asian residents
- 1.5%Males
- 2.2%Females
- Unemployment rate for two or more race residents
- 4.2%Females
- Unemployment rate for Hispanic or Latino residents
- 3.1%Males
- 5.6%Females
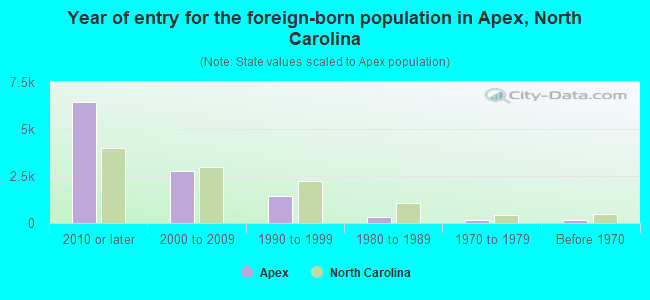
- Year of entry for the foreign-born population in Apex, North Carolina
- 6,4262010 or later
- 2,7412000 to 2009
- 1,4411990 to 1999
- 2961980 to 1989
- 1781970 to 1979
- 143Before 1970
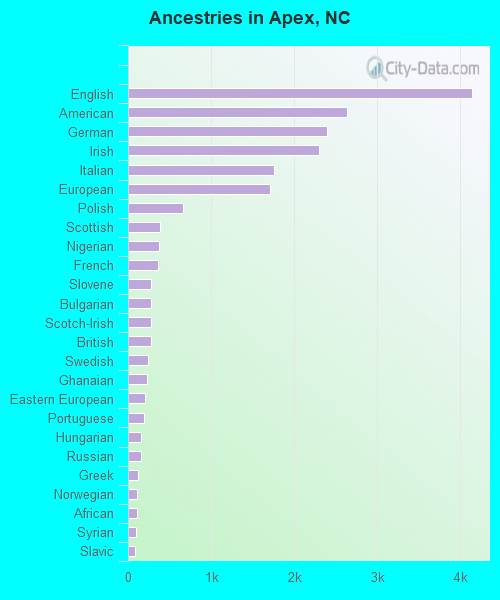
First ancestries reported:
- English: 4,137 (11.7%)
- American: 2,637 (7.4%)
- German: 2,398 (6.8%)
- Irish: 2,300 (6.5%)
- Italian: 1,752 (4.9%)
- European: 1,714 (4.8%)
- Polish: 665 (1.9%)
- Scottish: 387 (1.1%)
- Nigerian: 373 (1.1%)
- French: 367 (1.0%)
- Slovene: 281 (0.8%)
- Bulgarian: 278 (0.8%)
- Scotch-Irish: 277 (0.8%)
- British: 273 (0.8%)
- Swedish: 237 (0.7%)
- Ghanaian: 232 (0.7%)
- Eastern European: 202 (0.6%)
- Portuguese: 196 (0.6%)
- Hungarian: 161 (0.5%)
- Russian: 157 (0.4%)
- Greek: 119 (0.3%)
- Norwegian: 113 (0.3%)
- African: 107 (0.3%)
- Syrian: 95 (0.3%)
- Slavic: 85 (0.2%)
- Estonian: 84 (0.2%)
- Turkish: 83 (0.2%)
- Dutch: 76 (0.2%)
- Scandinavian: 75 (0.2%)
- Iranian: 62 (0.2%)
- Albanian: 58 (0.2%)
- Ethiopian: 55 (0.2%)
- Swiss: 48 (0.1%)
- Slovak: 45 (0.1%)
- Austrian: 37 (0.1%)
- Croatian: 35 (0.10%)
- Danish: 34 (0.10%)
- Romanian: 29 (0.08%)
- Finnish: 27 (0.08%)
- Palestinian: 26 (0.07%)
- Lebanese: 25 (0.07%)
- Welsh: 21 (0.06%)
- Northern European: 16 (0.05%)
- Brazilian: 15 (0.04%)
- Lithuanian: 14 (0.04%)
- Belgian: 14 (0.04%)
- South African: 14 (0.04%)
- Ukrainian: 11 (0.03%)
- Czech: 9 (0.03%)
- French Canadian: 7 (0.02%)
- Jamaican: 7 (0.02%)
- Kenyan: 6 (0.02%)
- Maltese: 4 (0.01%)
Most common places of birth for foreign-born residents (%):
| Apex: | 43.6% (4,758) |
| North Carolina: | 9.3% (80,594) |
| Apex: | 9.4% (1,023) |
| North Carolina: | 3.2% (27,477) |
| Apex: | 4.6% (499) |
| North Carolina: | 24.7% (214,776) |
| Apex: | 2.9% (318) |
| North Carolina: | 0.2% (1,928) |
| Apex: | 2.8% (303) |
| North Carolina: | 2.9% (24,965) |
| Apex: | 2.7% (298) |
| North Carolina: | 1.0% (8,426) |
| Apex: | 2.7% (291) |
| North Carolina: | 1.8% (15,988) |
| Apex: | 2.4% (261) |
| North Carolina: | 2.1% (18,105) |
| Apex: | 1.6% (177) |
| North Carolina: | 0.9% (8,067) |
| Apex: | 1.6% (170) |
| North Carolina: | 1.1% (9,831) |
Place of birth for U.S.-born residents:
- This state: 21,985
- Other state: 31,719
- Northeast: 11,160
- Midwest: 4,706
- South: 10,564
- West: 5,289
90.1% of Apex residents lived in the same house 1 years ago.
Out of people who lived in different houses, 31.8% lived in this county.
Out of people who lived in different counties, 33.2% lived in North Carolina.
| Apex: | 90.1% |
| State average: | 87.3% |
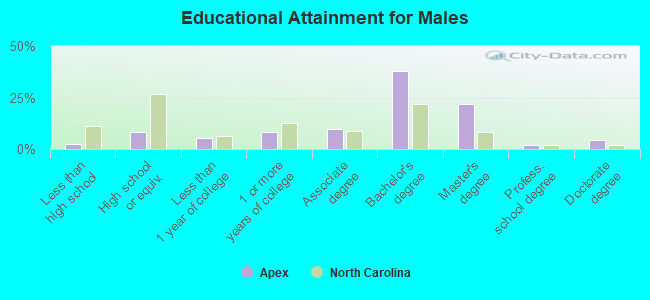
Education attainment for males 25 years and older:
- No schooling: 34
- Nursery to 4th grade: 27
- 5th and 6th grade: 75
- 7th and 8th grade: 68
- 9th grade: 20
- 10th grade: 84
- 11th grade: 37
- 12th grade, no diploma: 172
- High school graduate (or equivalency): 1,773
- Less than 1 year of college: 1,109
- Some college more than 1 year, no degree: 1,814
- Associate degree: 2,074
- Bachelor's degree: 8,164
- Master's degree: 4,703
- Professional school degree: 380
- Doctorate degree: 940
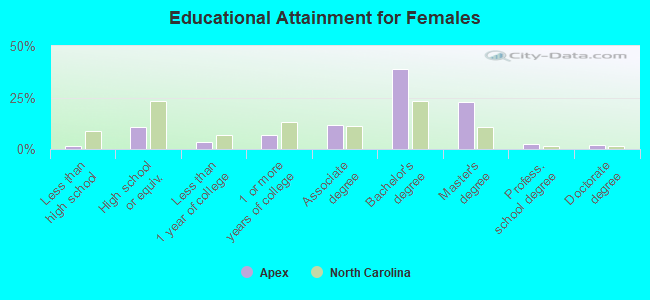
Education attainment for females 25 years and older:
- No schooling: 120
- Nursery to 4th grade: 0
- 5th and 6th grade: 22
- 7th and 8th grade: 35
- 9th grade: 0
- 10th grade: 20
- 11th grade: 79
- 12th grade, no diploma: 68
- High school graduate (or equivalency): 2,505
- Less than 1 year of college: 788
- Some college more than 1 year, no degree: 1,610
- Associate degree: 2,691
- Bachelor's degree: 9,019
- Master's degree: 5,354
- Professional school degree: 537
- Doctorate degree: 441
Housing units in structures:
- One, detached: 18,360
- One, attached: 4,798
- Two: 41
- 3 or 4: 76
- 5 to 9: 44
- 10 to 19: 938
- 20 to 49: 1,124
- 50 or more: 275
- Mobile homes: 384
Median worth of mobile homes: $33,200
Housing units lacking complete kitchen facilities in 2022: 0.3%
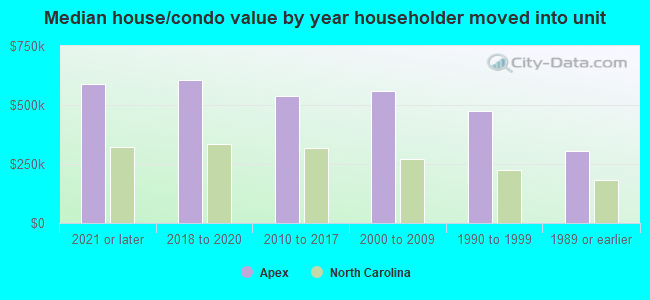
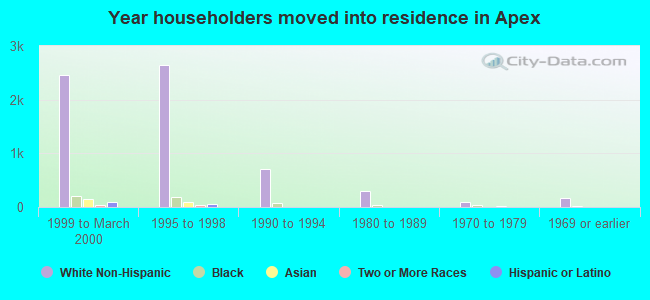
House/condo owner moved in on average 6 years ago
Renter moved in on average 2 years ago
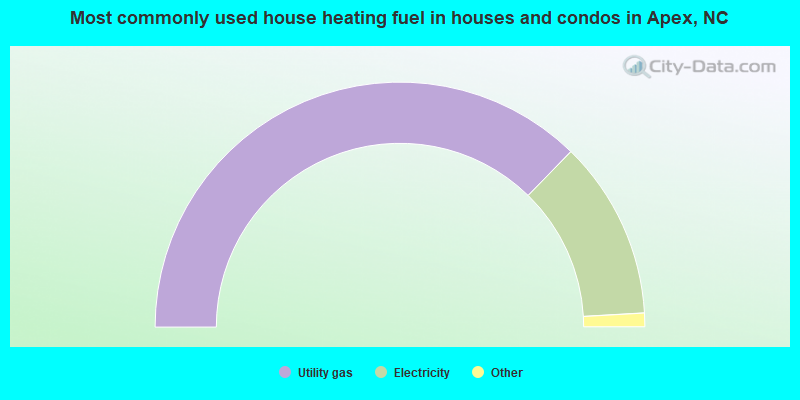
- 74.6%Utility gas
- 23.6%Electricity
- 1.5%Bottled, tank, or LP gas
- 0.2%Solar energy
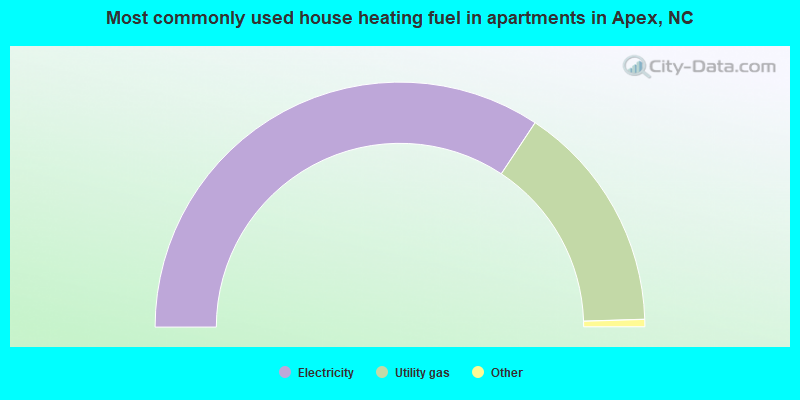
- 68.6%Electricity
- 30.4%Utility gas
- 0.7%Bottled, tank, or LP gas
- 0.3%Fuel oil, kerosene, etc.
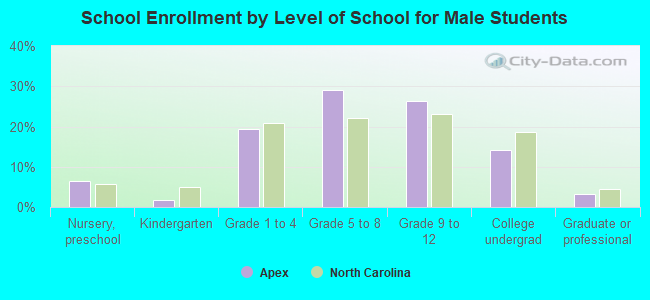
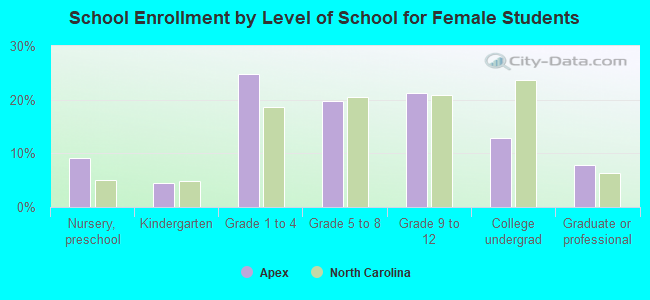
Private vs. public school enrollment:
| Here: | 7.3% |
| North Carolina: | 13.8% |
| Here: | 6.4% |
| North Carolina: | 11.9% |
| Here: | 3.5% |
| North Carolina: | 19.3% |