Lincoln, PA (Pennsylvania) Houses and Residents
| Lincoln: | $125,800 |
| Pennsylvania: | $245,500 |
Total population: 1,066 (Urban population: 61, Rural population: 1,141 (15 farm, 1,126 nonfarm))
Houses: 451 (429 occupied: 334 owner occupied, 86 renter occupied)
| % of renters here: | 20% |
| State: | 31% |
Housing density: 94 houses/condos per square mile
Median price asked for vacant for-sale houses and condos in 2022 in this county: $195,117.
Median contract rent in 2022: $575 (lower quartile is $555, upper quartile is $590)
Median rent asked for vacant for-rent units in 2022: $947
Median gross rent in Lincoln, PA in 2022: $849
Housing units in Lincoln with a mortgage: 130 (0 second mortgage, 0 home equity loan, 0 both second mortgage and home equity loan)
Houses without a mortgage: 22
Median household income for houses/condos with a mortgage: $91,536
Median household income for apartments without a mortgage: $71,920
Median monthly housing costs: $806
Compare current foreclosures near Lincoln, PA:
| Photo | Address | Area | Beds / Baths | Price | Details |
|---|---|---|---|---|---|

|
#1
Grant St
Carnegie, PA 15106
|
1,345 sq. feet
|
2 baths 4 beds |
$225,500
|
show details |

|
#2
Triana St
Pittsburgh, PA 15210
|
1,184 sq. feet
|
1 baths 3 beds |
$151,500
|
show details |

|
#3
Coal St
Dunlevy, PA 15432
|
1,740 sq. feet
|
1 baths 3 beds |
$114,500
|
show details |

|
#4
9th Ave
Elizabeth, PA 15037
|
1,554 sq. feet
|
1 baths 3 beds |
$165,000
|
show details |

|
#5
Leslie St
East Mc Keesport, PA 15035
|
1,144 sq. feet
|
1 baths 2 beds |
$54,900
|
show details |

|
#6
Blind Ln
Belle Vernon, PA 15012
|
1,548 sq. feet
|
2 baths 3 beds |
$67,500
|
show details |

|
#7
Russellwood Ave
Mc Kees Rocks, PA 15136
|
1,840 sq. feet
|
1 baths 3 beds |
$32,500
|
show details |

|
#8
S 4th St
West Newton, PA 15089
|
1,850 sq. feet
|
1 baths 4 beds |
$189,900
|
show details |

|
#9
N Hills Rd
Murrysville, PA 15668
|
1,690 sq. feet
|
1 baths 3 beds |
$159,900
|
show details |

|
#10
Mcintosh Dr
Mckeesport, PA 15132
|
1,306 sq. feet
|
2 baths 4 beds |
$236,500
|
show details |
| Photo | Address | Area | Beds / Baths | Price | Details |
|---|---|---|---|---|---|

|
#11
Muirfield Dr
Presto, PA 15142
|
4,801 sq. feet
|
4 baths 5 beds |
$669,500
|
show details |

|
#12
Mount Vernon St
Pittsburgh, PA 15208
|
1,452 sq. feet
|
1 baths 6 beds |
$176,500
|
show details |

|
#13
Munson Ave
Mc Kees Rocks, PA 15136
|
1,600 sq. feet
|
1 baths 3 beds |
$159,500
|
show details |

|
#14
Kirk Ave
Pittsburgh, PA 15227
|
1,500 sq. feet
|
2 baths 3 beds |
$189,500
|
show details |

|
#15
Collins St
Mckeesport, PA 15132
|
1,176 sq. feet
|
1 baths 3 beds |
$34,500
|
show details |

|
#16
Brinwood Ave
Pittsburgh, PA 15227
|
1,000 sq. feet
|
2 baths 3 beds |
$222,900
|
show details |

|
#17
Pittsburgh St
West Newton, PA 15089
|
1,193 sq. feet
|
1 baths 3 beds |
$184,500
|
show details |

|
#18
Punta Gorda St
East Mc Keesport, PA 15035
|
1,200 sq. feet
|
1 baths 3 beds |
$165,500
|
show details |

|
#19
Venetia Rd
Venetia, PA 15367
|
1,098 sq. feet
|
2 baths 3 beds |
$236,500
|
show details |

|
#20
25th St
Mckeesport, PA 15132
|
1,024 sq. feet
|
1 baths 2 beds |
$44,900
|
show details |
| Photo | Address | Area | Beds / Baths | Price | Details |
|---|---|---|---|---|---|

|
#21
Cherry Street
Ellsworth, PA 15331
|
- sq. feet
|
1 baths 2 beds |
$15,600
|
show details |

|
#22
North Ave Apt 1
Pittsburgh, PA 15221
|
1,759 sq. feet
|
2 baths 2 beds |
show details | |

|
#23
Ridge Point Cir
Bridgeville, PA 15017
|
1,344 sq. feet
|
1 baths 3 beds |
show details | |

|
#24
Crucible St
Pittsburgh, PA 15220
|
1,980 sq. feet
|
2 baths 4 beds |
show details | |

|
#25
Letsche St
Pittsburgh, PA 15214
|
900 sq. feet
|
1 baths 3 beds |
show details | |

|
#26
Noblestown Rd
Carnegie, PA 15106
|
855 sq. feet
|
1 baths 2 beds |
show details | |

|
#27
Hazel St
Finleyville, PA 15332
|
1,472 sq. feet
|
2 baths 3 beds |
show details | |

|
#28
Longuevue Dr
Pittsburgh, PA 15228
|
2,581 sq. feet
|
3 baths 4 beds |
show details | |

|
#29
Memorial Dr
Perryopolis, PA 15473
|
1,498 sq. feet
|
1 baths 4 beds |
show details | |

|
#30
Middle St
Pittsburgh, PA 15215
|
1,350 sq. feet
|
1 baths 2 beds |
show details |
| Photo | Address | Area | Beds / Baths | Price | Details |
|---|---|---|---|---|---|

|
#31
Stanton St
Greensburg, PA 15601
|
- sq. feet
|
- baths - beds |
$17,500
|
show details |

|
#32
Pineridge St
Pittsburgh, PA 15208
|
1,120 sq. feet
|
1 baths 3 beds |
show details | |

|
#33
Landis St
Pittsburgh, PA 15204
|
2,626 sq. feet
|
2 baths 5 beds |
show details | |

|
#34
Donora Rd
Monongahela, PA 15063
|
1,539 sq. feet
|
2 baths 3 beds |
show details | |

|
#35
Charles St
Turtle Creek, PA 15145
|
2,070 sq. feet
|
2 baths 4 beds |
show details | |

|
#36
Sweetleaf Dr
Monroeville, PA 15146
|
2,120 sq. feet
|
2 baths 3 beds |
show details | |

|
#37
Larimer Ave
Turtle Creek, PA 15145
|
1,558 sq. feet
|
1 baths 3 beds |
show details | |

|
#38
Oak St
Pittsburgh, PA 15236
|
2,065 sq. feet
|
2 baths 3 beds |
show details | |

|
#39
Lawndale St
Pittsburgh, PA 15221
|
1,552 sq. feet
|
2 baths 3 beds |
show details | |

|
#40
Greeley Ave
Pittsburgh, PA 15223
|
1,074 sq. feet
|
1 baths 3 beds |
show details |
| Photo | Address | Area | Beds / Baths | Price | Details |
|---|---|---|---|---|---|

|
#41
Center St
Carnegie, PA 15106
|
2,064 sq. feet
|
1 baths 2 beds |
show details | |

|
#42
Willowbrook Dr
Bridgeville, PA 15017
|
1,965 sq. feet
|
3 baths 3 beds |
show details | |

|
#43
Snee Dr
Pittsburgh, PA 15236
|
2,346 sq. feet
|
2 baths 4 beds |
show details | |

|
#44
Latonia Ave
Pittsburgh, PA 15216
|
1,236 sq. feet
|
1 baths 3 beds |
show details | |

|
#45
E Larkspur St
Homestead, PA 15120
|
1,800 sq. feet
|
2 baths 3 beds |
show details | |

|
#46
Virginia Manor Dr
Pittsburgh, PA 15215
|
3,534 sq. feet
|
3 baths 5 beds |
show details | |

|
#47
Clopper St
Herminie, PA 15637
|
1,680 sq. feet
|
1 baths 4 beds |
show details | |

|
#48
4th Ave
New Eagle, PA 15067
|
980 sq. feet
|
1 baths 3 beds |
show details | |

|
#49
Vine St
Homestead, PA 15120
|
752 sq. feet
|
1 baths 1 beds |
show details | |

|
Check over 1 million property listings on Foreclosure.com!
|
browse all offers | |||

Latest news about housing in Lincoln, PA collected exclusively by city-data.com from local newspapers, TV, and radio stations

 | House In Lincoln Place (10 replies) |
| 76-year old female neighbor needs emergency housing (42 replies) |
| Chicago to Philly, neighborhood recommendations (36 replies) |
| Pittsburgh (basically) didn't shrink from 2020-2022... (22 replies) |
| Larimer: The next frontier for Pittsburgh gentrification... (22 replies) |
| "East Liberty" house for rent? (12 replies) |

Median year apartment built: 1948
Household type by relationship:
Households: 988- Male householders: 230 (110 living alone), Female householders: 192 (53 living alone)
220 spouses (220 opposite-sex spouses), 10 unmarried partners, (10 opposite-sex unmarried partners), 210 children (195 natural, 10 adopted, 4 stepchildren), 48 grandchildren, 7 brothers or sisters, 26 parents, 0 foster children, 25 other relatives, 0 non-relatives
- In group quarters: 13
Size of family households: 111 2-persons, 74 3-persons, 26 4-persons, 16 5-persons, 15 6-persons.
Size of nonfamily households: 168 1-person, 5 2-persons.
74 married couples with children.
5 single-parent households (0 men, 5 women).
98.2% of residents of Lincoln speak English at home.
0.8% of residents speak Spanish at home (100% speak English very well).
0.9% of residents speak other Indo-European language at home (100% speak English very well).
Foreign born population: 15 (1.5%)
(106.7% of them are naturalized citizens)
| Here: | 6.3 |
| State: | 6.8 |
| Here: | 5.9 |
| State: | 4.3 |

- Bedrooms in owner-occupied houses and condos in Lincoln, Pennsylvania
- 4no bedroom
- 91 bedroom
- 862 bedrooms
- 1943 bedrooms
- 354 bedrooms
- 85+ bedrooms

- Bedrooms in renter-occupied apartments in Lincoln, Pennsylvania
- 0no bedroom
- 01 bedroom
- 352 bedrooms
- 493 bedrooms
- 34 bedrooms
- 05+ bedrooms

- Cars and other vehicles available in Lincoln in owner-occupied houses/condos
- 19no vehicle
- 851 vehicle
- 1182 vehicles
- 483 vehicles
- 424 vehicles
- 235+ vehicles

- Cars and other vehicles available in Lincoln in renter-occupied apartments
- 5no vehicle
- 521 vehicle
- 42 vehicles
- 223 vehicles
- 44 vehicles
- 05+ vehicles

- Rooms in owner-occupied houses in Lincoln, Pennsylvania
- 41 room
- 02 rooms
- 193 rooms
- 264 rooms
- 475 rooms
- 946 rooms
- 747 rooms
- 488 rooms
- 239+ rooms

- Rooms in renter-occupied apartments in Lincoln, Pennsylvania
- 01 room
- 02 rooms
- 03 rooms
- 84 rooms
- 65 rooms
- 736 rooms
- 07 rooms
- 08 rooms
- 09+ rooms


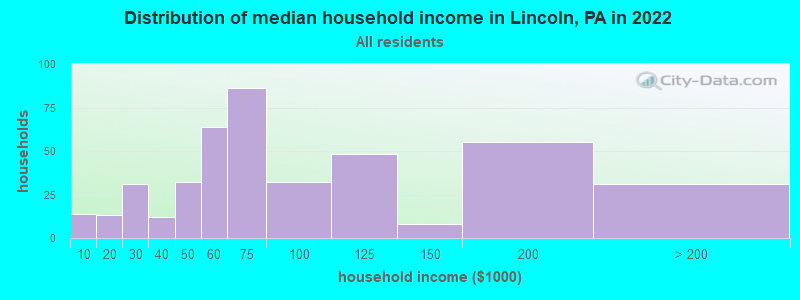
Lincoln, PA household income distribution

- 14Less than $10,000
- 13$10,000 to $19,999
- 31$20,000 to $29,999
- 12$30,000 to $39,999
- 32$40,000 to $49,999
- 64$50,000 to $59,999
- 86$60,000 to $74,999
- 32$75,000 to $99,999
- 48$100,000 to $124,999
- 8$125,000 to $149,999
- 55$150,000 to $199,999
- 31$200,000 or more
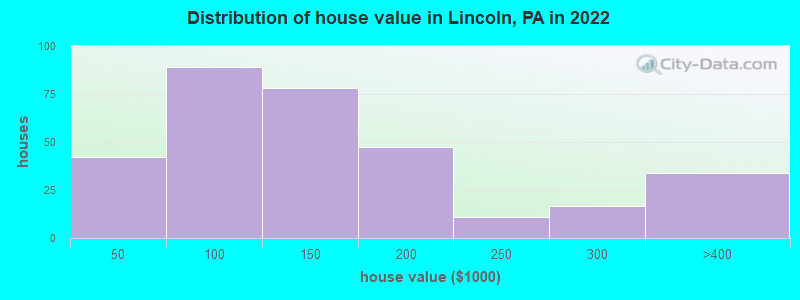
Home value of owner - occupied houses in 2022 in Lincoln, PA
-
- 8Less than $10,000
- 2$15,000 to $19,999
- 6$20,000 to $24,999
- 13$35,000 to $39,999
- 11$40,000 to $49,999
- 6$50,000 to $59,999
- 12$60,000 to $69,999
- 24$70,000 to $79,999
- 15$80,000 to $89,999
- 19$90,000 to $99,999
- 51$100,000 to $124,999
- 27$125,000 to $149,999
- 16$150,000 to $174,999
- 30$175,000 to $199,999
- 10$200,000 to $249,999
- 16$250,000 to $299,999
- 33$300,000 to $399,999
Rent paid by renters in 2022 in Lincoln, PA
-
- 5Less than $100
- 4$350 to $399
- 56$550 to $599
- 3$600 to $649
- 2$650 to $699
- 8No cash rent


Percentage of workers working in this county: 97.5%
Number of people working at home: 43 (8.8% of all workers)
Travel time to work (commute)
- Less than 5 minutes: 6
- 5 to 9 minutes: 4
- 10 to 14 minutes: 38
- 15 to 19 minutes: 124
- 20 to 24 minutes: 71
- 25 to 29 minutes: 13
- 30 to 34 minutes: 33
- 35 to 39 minutes: 9
- 40 to 44 minutes: 23
- 45 to 59 minutes: 30
- 60 to 89 minutes: 35
- 90 or more minutes: 22
Means of transportation to work:
- Drove a car alone: 443 (83.9%)
- Carpooled: 67 (12.7%)
- Bus or trolley bus: 11 (2.1%)
- Worked at home: 7 (1.3%)

- Unemployment by race in 2022
- Unemployment rate for White non-Hispanic residents
- 2.6%Males
- 3.5%Females
- Unemployment rate for American Indian and Alaska Native residents
- 100.0%Males
- Unemployment rate for Hispanic or Latino residents
- 6.2%Males

- Year of entry for the foreign-born population in Lincoln, Pennsylvania
- 02010 or later
- 02000 to 2009
- 51990 to 1999
- 31980 to 1989
- 01970 to 1979
- 8Before 1970

First ancestries reported:
- German: 183 (44.2%)
- Italian: 41 (9.9%)
- Polish: 39 (9.4%)
- American: 24 (5.8%)
- French: 16 (3.9%)
- Russian: 14 (3.4%)
- Irish: 12 (2.9%)
- Slovak: 11 (2.7%)
- English: 8 (1.9%)
- Ukrainian: 4 (1.0%)
- Carpatho Rusyn: 2 (0.5%)
- Czechoslovakian: 1 (0.2%)
- Scotch-Irish: 1 (0.2%)
Most common places of birth for foreign-born residents (%):
| Lincoln: | 58.8% (10) |
| Pennsylvania: | 1.3% (12,172) |
| Lincoln: | 29.4% (5) |
| Pennsylvania: | 1.9% (18,065) |
Place of birth for U.S.-born residents:
- This state: 849
- Other state: 105
- Northeast: 11
- Midwest: 7
- South: 26
- West: 55
97.6% of Lincoln residents lived in the same house 1 years ago.
Out of people who lived in different houses, 42.9% lived in this county.
Out of people who lived in different counties, 37.5% lived in Pennsylvania.
| Lincoln: | 97.6% |
| State average: | 89.3% |
Education attainment for males 25 years and older:
- No schooling: 2
- Nursery to 4th grade: 0
- 5th and 6th grade: 0
- 7th and 8th grade: 0
- 9th grade: 0
- 10th grade: 6
- 11th grade: 0
- 12th grade, no diploma: 0
- High school graduate (or equivalency): 177
- Less than 1 year of college: 28
- Some college more than 1 year, no degree: 94
- Associate degree: 46
- Bachelor's degree: 46
- Master's degree: 4
- Professional school degree: 4
- Doctorate degree: 0

Education attainment for females 25 years and older:
- No schooling: 8
- Nursery to 4th grade: 0
- 5th and 6th grade: 4
- 7th and 8th grade: 0
- 9th grade: 0
- 10th grade: 16
- 11th grade: 1
- 12th grade, no diploma: 0
- High school graduate (or equivalency): 138
- Less than 1 year of college: 20
- Some college more than 1 year, no degree: 41
- Associate degree: 46
- Bachelor's degree: 59
- Master's degree: 23
- Professional school degree: 0
- Doctorate degree: 0


Housing units in structures:
- One, detached: 424
- One, attached: 5
- Two: 3
- Mobile homes: 19
Median worth of mobile homes: $11,310
Housing units lacking complete kitchen facilities in 2022: 0.9%
House/condo owner moved in on average 30 years ago
Renter moved in on average 7 years ago

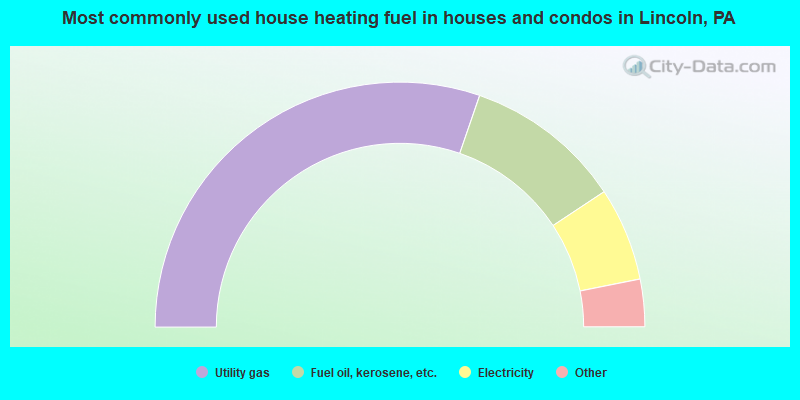
- 60.8%Utility gas
- 20.9%Fuel oil, kerosene, etc.
- 12.4%Electricity
- 3.2%Bottled, tank, or LP gas
- 2.7%Wood
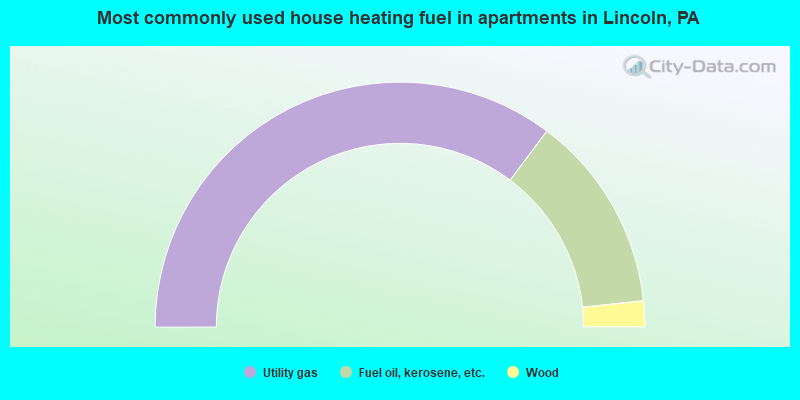
- 70.5%Utility gas
- 26.1%Fuel oil, kerosene, etc.
- 3.4%Wood
Private vs. public school enrollment:
| Here: | 0.0% |
| Pennsylvania: | 15.7% |
| Here: | 7.4% |
| Pennsylvania: | 13.4% |
| Here: | 8.6% |
| Pennsylvania: | 39.8% |


