Pecan Plantation, TX (Texas) Houses and Residents
| Pecan Plantation: | $402,546 |
| Texas: | $275,400 |
Mean price in 2022:
Detached houses: $411,806
Here: $411,806 State: $369,058 Townhouses or other attached units: $307,827
Here: $307,827 State: $327,631
Total population: 5,294 (Urban population: 3,527 (all inside urban clusters), Rural population: 0)
Houses: 3,002 (2,902 occupied: 2,826 owner occupied, 102 renter occupied)
| % of renters here: | 3% |
| State: | 38% |
Housing density: 429 houses/condos per square mile
Median price asked for vacant for-sale houses and condos in 2022 in this county: $240,397.
Median contract rent in 2022: $1,838 (lower quartile is $1,158, upper quartile is over $2,000)
Median rent asked for vacant for-rent units in 2022: $1,610
Median gross rent in Pecan Plantation, TX in 2022: over $2,000
Housing units in Pecan Plantation with a mortgage: 1,531 (0 second mortgage, 0 home equity loan, 0 both second mortgage and home equity loan)
Houses without a mortgage: 48
Median household income for houses/condos with a mortgage: $109,301
Median household income for apartments without a mortgage: $71,329
Median monthly housing costs: $1,439
Compare current foreclosures near Pecan Plantation, TX:
| Photo | Address | Area | Beds / Baths | Price | Details |
|---|---|---|---|---|---|

|
#1
Ashwood Ct
Cleburne, TX 76033
|
916 sq. feet
|
2 baths 3 beds |
show details | |

|
#2
Comanche Trl
Weatherford, TX 76087
|
1,984 sq. feet
|
2 baths 3 beds |
show details | |

|
#3
Bellevue Dr
Cleburne, TX 76033
|
3,843 sq. feet
|
3 baths 4 beds |
show details | |

|
#4
Dayla Ct
Granbury, TX 76049
|
1,120 sq. feet
|
2 baths 2 beds |
show details | |

|
#5
Lone Star Way
Godley, TX 76044
|
2,598 sq. feet
|
3 baths 4 beds |
show details | |

|
#6
County Road 1006
Godley, TX 76044
|
4,485 sq. feet
|
3 baths 4 beds |
show details | |

|
#7
Apollo Dr
Joshua, TX 76058
|
1,680 sq. feet
|
2 baths 3 beds |
show details | |

|
#8
Featherston St
Cleburne, TX 76033
|
2,134 sq. feet
|
2 baths 3 beds |
show details | |

|
#9
Whisper Ln
Glen Rose, TX 76043
|
1,743 sq. feet
|
2 baths - beds |
show details | |

|
#10
Walker St
Glen Rose, TX 76043
|
912 sq. feet
|
1 baths - beds |
show details |
| Photo | Address | Area | Beds / Baths | Price | Details |
|---|---|---|---|---|---|

|
#11
Janis St
Granbury, TX 76049
|
1,787 sq. feet
|
- baths - beds |
show details | |

|
#12
Orion Way
Granbury, TX 76048
|
1,080 sq. feet
|
- baths - beds |
show details | |

|
#13
Nolan Ridge Dr
Cleburne, TX 76033
|
1,456 sq. feet
|
- baths - beds |
show details | |

|
#14
Blueberry Trl
Granbury, TX 76048
|
840 sq. feet
|
- baths - beds |
show details | |

|
#15
Scissor Tail Dr
Joshua, TX 76058
|
- sq. feet
|
- baths - beds |
show details | |

|
#16
Alabama St
Joshua, TX 76058
|
1,590 sq. feet
|
- baths - beds |
show details | |

|
#17
Berry Ridge Ln
Joshua, TX 76058
|
- sq. feet
|
- baths - beds |
show details | |

|
#18
Montana St
Joshua, TX 76058
|
1,344 sq. feet
|
- baths - beds |
show details | |

|
#19
Plum Bush St
Granbury, TX 76048
|
1,568 sq. feet
|
- baths - beds |
show details | |

|
#20
N Nolan River Rd Apt A
Cleburne, TX 76033
|
- sq. feet
|
- baths - beds |
show details |
| Photo | Address | Area | Beds / Baths | Price | Details |
|---|---|---|---|---|---|

|
#21
Roberson Ct
Granbury, TX 76048
|
- sq. feet
|
- baths - beds |
show details | |

|
#22
County Road 1010
Joshua, TX 76058
|
1,248 sq. feet
|
- baths - beds |
show details | |

|
#23
Peighton Dr
Cleburne, TX 76033
|
- sq. feet
|
- baths - beds |
show details | |

|
#24
Kaywood Dr
Granbury, TX 76048
|
- sq. feet
|
- baths - beds |
show details | |

|
#25
Blackjack Ln
Granbury, TX 76048
|
1,340 sq. feet
|
- baths - beds |
show details | |

|
#26
County Road 1117
Cleburne, TX 76033
|
1,904 sq. feet
|
- baths - beds |
show details | |

|
#27
Rustic Edge
Godley, TX 76044
|
- sq. feet
|
- baths - beds |
show details | |

|
#28
Winding Way
Godley, TX 76044
|
- sq. feet
|
- baths - beds |
show details | |

|
#29
Paluxy Hwy
Tolar, TX 76476
|
- sq. feet
|
- baths - beds |
show details | |

|
#30
County Road 1006
Godley, TX 76044
|
1,568 sq. feet
|
- baths - beds |
show details |
| Photo | Address | Area | Beds / Baths | Price | Details |
|---|---|---|---|---|---|

|
#31
French Dr
Cresson, TX 76035
|
- sq. feet
|
- baths - beds |
show details | |

|
#32
Westover Dr
Granbury, TX 76049
|
2,039 sq. feet
|
- baths - beds |
show details | |

|
#33
Kentucky St
Joshua, TX 76058
|
1,620 sq. feet
|
- baths - beds |
show details | |

|
#34
Choctaw Ct
Granbury, TX 76049
|
- sq. feet
|
- baths - beds |
show details | |

|
#35
N Mountain Rdg
Cresson, TX 76035
|
1,803 sq. feet
|
- baths - beds |
show details | |

|
#36
Sky Rd
Joshua, TX 76058
|
1,512 sq. feet
|
- baths - beds |
show details | |

|
#37
County Road 913
Joshua, TX 76058
|
1,344 sq. feet
|
- baths - beds |
show details | |

|
#38
Constellation Dr
Cresson, TX 76035
|
3,781 sq. feet
|
- baths - beds |
show details | |

|
#39
Cleburne Hwy
Cresson, TX 76035
|
- sq. feet
|
- baths - beds |
show details | |

|
#40
De Leon Dr
Weatherford, TX 76087
|
1,020 sq. feet
|
- baths - beds |
show details |
| Photo | Address | Area | Beds / Baths | Price | Details |
|---|---|---|---|---|---|

|
#41
Terrill Ln
Granbury, TX 76049
|
840 sq. feet
|
- baths - beds |
show details | |

|
#42
Dixon St
Cleburne, TX 76033
|
- sq. feet
|
- baths - beds |
show details | |

|
#43
Davis St
Cleburne, TX 76033
|
1,512 sq. feet
|
- baths - beds |
show details | |

|
#44
W Virginia Trl
Granbury, TX 76048
|
- sq. feet
|
- baths - beds |
show details | |

|
#45
Sky Rd
Joshua, TX 76058
|
1,456 sq. feet
|
- baths - beds |
show details | |

|
#46
County Road 911
Joshua, TX 76058
|
1,879 sq. feet
|
- baths - beds |
show details | |

|
#47
Creekwood Dr
Cleburne, TX 76033
|
- sq. feet
|
- baths - beds |
show details | |

|
#48
Briarwood Dr
Cleburne, TX 76033
|
1,615 sq. feet
|
- baths - beds |
show details | |

|
#49
S Caddo St Apt B
Cleburne, TX 76031
|
- sq. feet
|
- baths - beds |
show details | |

|
Check over 1 million property listings on Foreclosure.com!
|
browse all offers | |||


 | Pecan Plantation - Decordova Bend - Granbury area (13 replies) |
| TCU area (11 replies) |
| Where to live in Dallas and Fort Worth (5 replies) |
| Retiring to Granbury (6 replies) |
| Looking to move to a "scenic setting" within 1 hour of DFW -- what do you recommend? (13 replies) |
| Barking dog, nuisance neighbor and HOAs (59 replies) |

Median year apartment built: 1992
Household type by relationship:
Households: 7,081- Male householders: 1,923 (142 living alone), Female householders: 1,072 (311 living alone)
2,241 spouses (2,216 opposite-sex spouses), 68 unmarried partners, (68 opposite-sex unmarried partners), 1,264 children (1,110 natural, 99 adopted, 54 stepchildren), 85 grandchildren, 83 brothers or sisters, 73 parents, 0 foster children, 147 other relatives, 122 non-relatives
Size of family households: 1,632 2-persons, 474 3-persons, 68 4-persons, 115 5-persons, 69 6-persons.
Size of nonfamily households: 462 1-person, 176 2-persons.
657 married couples with children.
0 single-parent households (0 men, 0 women).
97.8% of residents of Pecan Plantation speak English at home.
1.1% of residents speak Spanish at home (44% speak English very well, 41% speak English well, 15% speak English not well).
2.2% of residents speak other Indo-European language at home (100% speak English very well).
0.1% of residents speak Asian or Pacific Island language at home (100% speak English very well).
Foreign born population: 447 (6.3%)
(119.5% of them are naturalized citizens)
| Here: | 7.7 |
| State: | 6.3 |
| Here: | 6.0 |
| State: | 4.0 |

- Bedrooms in owner-occupied houses and condos in Pecan Plantation, Texas
- 0no bedroom
- 01 bedroom
- 2112 bedrooms
- 1,7423 bedrooms
- 7844 bedrooms
- 885+ bedrooms

- Bedrooms in renter-occupied apartments in Pecan Plantation, Texas
- 0no bedroom
- 171 bedroom
- 152 bedrooms
- 723 bedrooms
- 04 bedrooms
- 05+ bedrooms

- Cars and other vehicles available in Pecan Plantation in owner-occupied houses/condos
- 10no vehicle
- 6821 vehicle
- 1,3622 vehicles
- 6613 vehicles
- 814 vehicles
- 305+ vehicles

- Cars and other vehicles available in Pecan Plantation in renter-occupied apartments
- 0no vehicle
- 311 vehicle
- 422 vehicles
- 303 vehicles
- 04 vehicles
- 05+ vehicles

- Rooms in owner-occupied houses in Pecan Plantation, Texas
- 01 room
- 02 rooms
- 213 rooms
- 1104 rooms
- 3955 rooms
- 5406 rooms
- 4657 rooms
- 5438 rooms
- 7519+ rooms

- Rooms in renter-occupied apartments in Pecan Plantation, Texas
- 01 room
- 172 rooms
- 03 rooms
- 84 rooms
- 225 rooms
- 106 rooms
- 267 rooms
- 148 rooms
- 69+ rooms


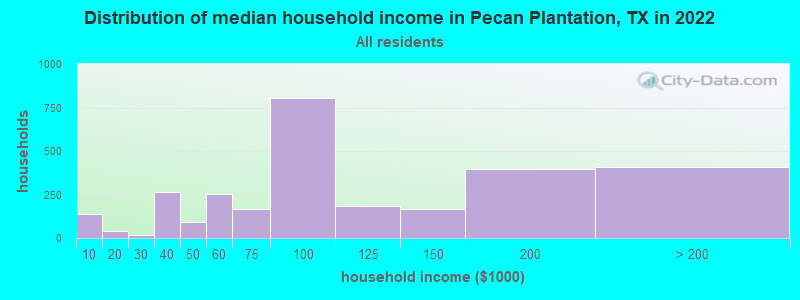
Pecan Plantation, TX household income distribution

- 136Less than $10,000
- 40$10,000 to $19,999
- 20$20,000 to $29,999
- 266$30,000 to $39,999
- 94$40,000 to $49,999
- 251$50,000 to $59,999
- 168$60,000 to $74,999
- 807$75,000 to $99,999
- 185$100,000 to $124,999
- 167$125,000 to $149,999
- 394$150,000 to $199,999
- 407$200,000 or more
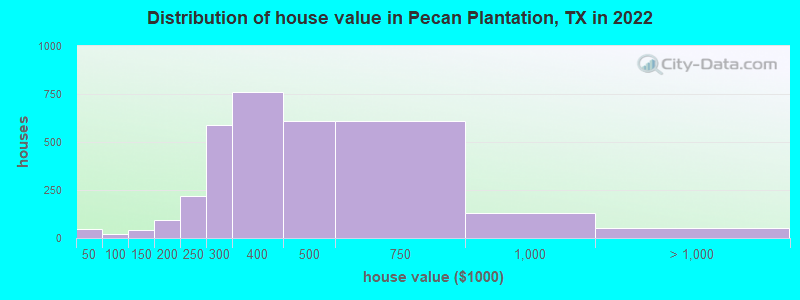
Home value of owner - occupied houses in 2022 in Pecan Plantation, TX
-
- 24$30,000 to $34,999
- 20$40,000 to $49,999
- 7$100,000 to $124,999
- 34$125,000 to $149,999
- 15$150,000 to $174,999
- 78$175,000 to $199,999
- 220$200,000 to $249,999
- 585$250,000 to $299,999
- 762$300,000 to $399,999
- 607$400,000 to $499,999
- 609$500,000 to $749,999
- 131$750,000 to $999,999
- 51$1,000,000 to $1,499,999
Rent paid by renters in 2022 in Pecan Plantation, TX
-
- 22$1,000 to $1,249
- 34$1,500 to $1,999
- 48No cash rent


Percentage of workers working in this county: 48.0%
Number of people working at home: 495 (22.9% of all workers)
Travel time to work (commute)
- Less than 5 minutes: 9
- 5 to 9 minutes: 0
- 10 to 14 minutes: 48
- 15 to 19 minutes: 168
- 20 to 24 minutes: 260
- 25 to 29 minutes: 45
- 30 to 34 minutes: 61
- 35 to 39 minutes: 12
- 40 to 44 minutes: 7
- 45 to 59 minutes: 424
- 60 to 89 minutes: 584
- 90 or more minutes: 280
Means of transportation to work:
- Drove a car alone: 961 (72.8%)
- Carpooled: 165 (12.5%)
- Motorcycle: 9 (0.7%)
- Other means: 33 (2.5%)
- Worked at home: 152 (11.5%)

- Unemployment by race in 2022
- Unemployment rate for White non-Hispanic residents
- 14.0%Males
- 11.5%Females

- Year of entry for the foreign-born population in Pecan Plantation, Texas
- 02010 or later
- 02000 to 2009
- 2031990 to 1999
- 01980 to 1989
- 01970 to 1979
- 10Before 1970

First ancestries reported:
- English: 1,128 (30.6%)
- American: 722 (19.6%)
- German: 328 (8.9%)
- Irish: 279 (7.6%)
- Scottish: 223 (6.1%)
- Dutch: 200 (5.4%)
- European: 140 (3.8%)
- Scotch-Irish: 88 (2.4%)
- Russian: 84 (2.3%)
- Italian: 47 (1.3%)
- Scandinavian: 36 (1.0%)
- British: 29 (0.8%)
- Norwegian: 22 (0.6%)
- French Canadian: 19 (0.5%)
- Danish: 13 (0.4%)
- Polish: 9 (0.2%)
Most common places of birth for foreign-born residents (%):
| Pecan Plantation: | 32.0% (99) |
| Texas: | 0.3% (16,984) |
| Pecan Plantation: | 20.4% (63) |
| Texas: | 0.3% (16,549) |
| Pecan Plantation: | 19.7% (61) |
| Texas: | 0.1% (5,793) |
| Pecan Plantation: | 8.7% (27) |
| Texas: | 0.2% (9,838) |
| Pecan Plantation: | 5.5% (17) |
| Texas: | 2.1% (103,148) |
| Pecan Plantation: | 5.5% (17) |
| Texas: | 0.6% (27,844) |
| Pecan Plantation: | 4.9% (15) |
| Texas: | 0.2% (8,227) |
| Pecan Plantation: | 3.6% (11) |
| Texas: | 0.1% (7,179) |
| Pecan Plantation: | 1.9% (6) |
| Texas: | 0.1% (2,961) |
Place of birth for U.S.-born residents:
- This state: 3,543
- Other state: 3,091
- Northeast: 342
- Midwest: 1,014
- South: 934
- West: 806
88.7% of Pecan Plantation residents lived in the same house 1 years ago.
Out of people who lived in different houses, 10.7% lived in this county.
Out of people who lived in different counties, 80.1% lived in Texas.
| Pecan Plantation: | 88.7% |
| State average: | 85.7% |
Education attainment for males 25 years and older:
- No schooling: 97
- Nursery to 4th grade: 0
- 5th and 6th grade: 0
- 7th and 8th grade: 0
- 9th grade: 0
- 10th grade: 0
- 11th grade: 0
- 12th grade, no diploma: 0
- High school graduate (or equivalency): 617
- Less than 1 year of college: 295
- Some college more than 1 year, no degree: 412
- Associate degree: 189
- Bachelor's degree: 775
- Master's degree: 468
- Professional school degree: 41
- Doctorate degree: 32

Education attainment for females 25 years and older:
- No schooling: 0
- Nursery to 4th grade: 0
- 5th and 6th grade: 0
- 7th and 8th grade: 7
- 9th grade: 0
- 10th grade: 0
- 11th grade: 0
- 12th grade, no diploma: 0
- High school graduate (or equivalency): 854
- Less than 1 year of college: 197
- Some college more than 1 year, no degree: 361
- Associate degree: 317
- Bachelor's degree: 857
- Master's degree: 445
- Professional school degree: 33
- Doctorate degree: 139


Housing units in structures:
- One, detached: 2,982
- 20 to 49: 19
House/condo owner moved in on average 11 years ago
Renter moved in on average 5 years ago

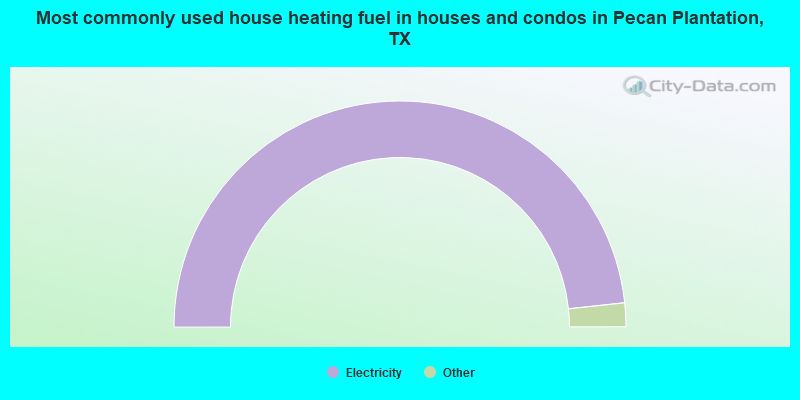
- 96.6%Electricity
- 2.0%Bottled, tank, or LP gas
- 0.8%Utility gas
- 0.6%Other fuel
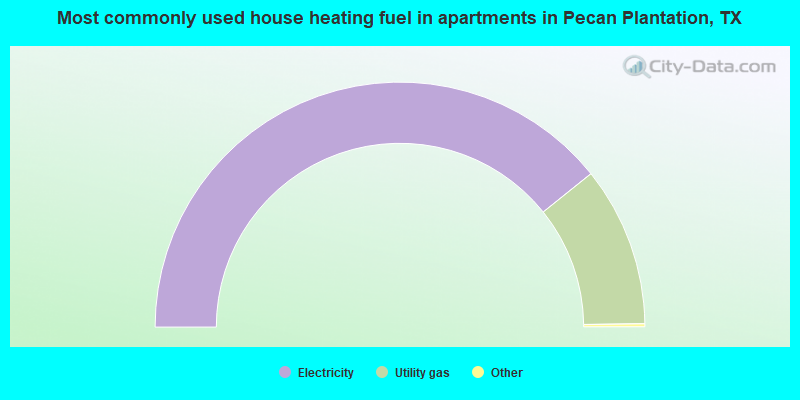
- 78.8%Electricity
- 21.2%Utility gas
Private vs. public school enrollment:
| Here: | 2.7% |
| Texas: | 8.8% |
| Here: | 0.0% |
| Texas: | 8.0% |
| Here: | 40.4% |
| Texas: | 16.2% |


