Cupertino, California Submit your own pictures of this city and show them to the world
OSM Map
General Map
Google Map
MSN Map
OSM Map
General Map
Google Map
MSN Map
OSM Map
General Map
Google Map
MSN Map
OSM Map
General Map
Google Map
MSN Map
Please wait while loading the map...
Population in 2022: 57,856 (100% urban, 0% rural). Population change since 2000: +14.5%Males: 30,458 Females: 27,398
March 2022 cost of living index in Cupertino: 133.3 (high, U.S. average is 100) Percentage of residents living in poverty in 2022: 5.3%for White Non-Hispanic residents , 6.2% for Black residents , 6.0% for Hispanic or Latino residents , 6.8% for American Indian residents , 15.6% for other race residents , 1.5% for two or more races residents )
Profiles of local businesses
Business Search - 14 Million verified businesses
Data:
Median household income ($)
Median household income (% change since 2000)
Household income diversity
Ratio of average income to average house value (%)
Ratio of average income to average rent
Median household income ($) - White
Median household income ($) - Black or African American
Median household income ($) - Asian
Median household income ($) - Hispanic or Latino
Median household income ($) - American Indian and Alaska Native
Median household income ($) - Multirace
Median household income ($) - Other Race
Median household income for houses/condos with a mortgage ($)
Median household income for apartments without a mortgage ($)
Races - White alone (%)
Races - White alone (% change since 2000)
Races - Black alone (%)
Races - Black alone (% change since 2000)
Races - American Indian alone (%)
Races - American Indian alone (% change since 2000)
Races - Asian alone (%)
Races - Asian alone (% change since 2000)
Races - Hispanic (%)
Races - Hispanic (% change since 2000)
Races - Native Hawaiian and Other Pacific Islander alone (%)
Races - Native Hawaiian and Other Pacific Islander alone (% change since 2000)
Races - Two or more races (%)
Races - Two or more races (% change since 2000)
Races - Other race alone (%)
Races - Other race alone (% change since 2000)
Racial diversity
Unemployment (%)
Unemployment (% change since 2000)
Unemployment (%) - White
Unemployment (%) - Black or African American
Unemployment (%) - Asian
Unemployment (%) - Hispanic or Latino
Unemployment (%) - American Indian and Alaska Native
Unemployment (%) - Multirace
Unemployment (%) - Other Race
Population density (people per square mile)
Population - Males (%)
Population - Females (%)
Population - Males (%) - White
Population - Males (%) - Black or African American
Population - Males (%) - Asian
Population - Males (%) - Hispanic or Latino
Population - Males (%) - American Indian and Alaska Native
Population - Males (%) - Multirace
Population - Males (%) - Other Race
Population - Females (%) - White
Population - Females (%) - Black or African American
Population - Females (%) - Asian
Population - Females (%) - Hispanic or Latino
Population - Females (%) - American Indian and Alaska Native
Population - Females (%) - Multirace
Population - Females (%) - Other Race
Coronavirus confirmed cases (May 02, 2024)
Deaths caused by coronavirus (May 02, 2024)
Coronavirus confirmed cases (per 100k population) (May 02, 2024)
Deaths caused by coronavirus (per 100k population) (May 02, 2024)
Daily increase in number of cases (May 02, 2024)
Weekly increase in number of cases (May 02, 2024)
Cases doubled (in days) (May 02, 2024)
Hospitalized patients (Apr 18, 2022)
Negative test results (Apr 18, 2022)
Total test results (Apr 18, 2022)
COVID Vaccine doses distributed (per 100k population) (Sep 19, 2023)
COVID Vaccine doses administered (per 100k population) (Sep 19, 2023)
COVID Vaccine doses distributed (Sep 19, 2023)
COVID Vaccine doses administered (Sep 19, 2023)
Likely homosexual households (%)
Likely homosexual households (% change since 2000)
Likely homosexual households - Lesbian couples (%)
Likely homosexual households - Lesbian couples (% change since 2000)
Likely homosexual households - Gay men (%)
Likely homosexual households - Gay men (% change since 2000)
Cost of living index
Median gross rent ($)
Median contract rent ($)
Median monthly housing costs ($)
Median house or condo value ($)
Median house or condo value ($ change since 2000)
Mean house or condo value by units in structure - 1, detached ($)
Mean house or condo value by units in structure - 1, attached ($)
Mean house or condo value by units in structure - 2 ($)
Mean house or condo value by units in structure by units in structure - 3 or 4 ($)
Mean house or condo value by units in structure - 5 or more ($)
Mean house or condo value by units in structure - Boat, RV, van, etc. ($)
Mean house or condo value by units in structure - Mobile home ($)
Median house or condo value ($) - White
Median house or condo value ($) - Black or African American
Median house or condo value ($) - Asian
Median house or condo value ($) - Hispanic or Latino
Median house or condo value ($) - American Indian and Alaska Native
Median house or condo value ($) - Multirace
Median house or condo value ($) - Other Race
Median resident age
Resident age diversity
Median resident age - Males
Median resident age - Females
Median resident age - White
Median resident age - Black or African American
Median resident age - Asian
Median resident age - Hispanic or Latino
Median resident age - American Indian and Alaska Native
Median resident age - Multirace
Median resident age - Other Race
Median resident age - Males - White
Median resident age - Males - Black or African American
Median resident age - Males - Asian
Median resident age - Males - Hispanic or Latino
Median resident age - Males - American Indian and Alaska Native
Median resident age - Males - Multirace
Median resident age - Males - Other Race
Median resident age - Females - White
Median resident age - Females - Black or African American
Median resident age - Females - Asian
Median resident age - Females - Hispanic or Latino
Median resident age - Females - American Indian and Alaska Native
Median resident age - Females - Multirace
Median resident age - Females - Other Race
Commute - mean travel time to work (minutes)
Travel time to work - Less than 5 minutes (%)
Travel time to work - Less than 5 minutes (% change since 2000)
Travel time to work - 5 to 9 minutes (%)
Travel time to work - 5 to 9 minutes (% change since 2000)
Travel time to work - 10 to 19 minutes (%)
Travel time to work - 10 to 19 minutes (% change since 2000)
Travel time to work - 20 to 29 minutes (%)
Travel time to work - 20 to 29 minutes (% change since 2000)
Travel time to work - 30 to 39 minutes (%)
Travel time to work - 30 to 39 minutes (% change since 2000)
Travel time to work - 40 to 59 minutes (%)
Travel time to work - 40 to 59 minutes (% change since 2000)
Travel time to work - 60 to 89 minutes (%)
Travel time to work - 60 to 89 minutes (% change since 2000)
Travel time to work - 90 or more minutes (%)
Travel time to work - 90 or more minutes (% change since 2000)
Marital status - Never married (%)
Marital status - Now married (%)
Marital status - Separated (%)
Marital status - Widowed (%)
Marital status - Divorced (%)
Median family income ($)
Median family income (% change since 2000)
Median non-family income ($)
Median non-family income (% change since 2000)
Median per capita income ($)
Median per capita income (% change since 2000)
Median family income ($) - White
Median family income ($) - Black or African American
Median family income ($) - Asian
Median family income ($) - Hispanic or Latino
Median family income ($) - American Indian and Alaska Native
Median family income ($) - Multirace
Median family income ($) - Other Race
Median year house/condo built
Median year apartment built
Year house built - Built 2005 or later (%)
Year house built - Built 2000 to 2004 (%)
Year house built - Built 1990 to 1999 (%)
Year house built - Built 1980 to 1989 (%)
Year house built - Built 1970 to 1979 (%)
Year house built - Built 1960 to 1969 (%)
Year house built - Built 1950 to 1959 (%)
Year house built - Built 1940 to 1949 (%)
Year house built - Built 1939 or earlier (%)
Average household size
Household density (households per square mile)
Average household size - White
Average household size - Black or African American
Average household size - Asian
Average household size - Hispanic or Latino
Average household size - American Indian and Alaska Native
Average household size - Multirace
Average household size - Other Race
Occupied housing units (%)
Vacant housing units (%)
Owner occupied housing units (%)
Renter occupied housing units (%)
Vacancy status - For rent (%)
Vacancy status - For sale only (%)
Vacancy status - Rented or sold, not occupied (%)
Vacancy status - For seasonal, recreational, or occasional use (%)
Vacancy status - For migrant workers (%)
Vacancy status - Other vacant (%)
Residents with income below the poverty level (%)
Residents with income below 50% of the poverty level (%)
Children below poverty level (%)
Poor families by family type - Married-couple family (%)
Poor families by family type - Male, no wife present (%)
Poor families by family type - Female, no husband present (%)
Poverty status for native-born residents (%)
Poverty status for foreign-born residents (%)
Poverty among high school graduates not in families (%)
Poverty among people who did not graduate high school not in families (%)
Residents with income below the poverty level (%) - White
Residents with income below the poverty level (%) - Black or African American
Residents with income below the poverty level (%) - Asian
Residents with income below the poverty level (%) - Hispanic or Latino
Residents with income below the poverty level (%) - American Indian and Alaska Native
Residents with income below the poverty level (%) - Multirace
Residents with income below the poverty level (%) - Other Race
Air pollution - Air Quality Index (AQI)
Air pollution - CO
Air pollution - NO2
Air pollution - SO2
Air pollution - Ozone
Air pollution - PM10
Air pollution - PM25
Air pollution - Pb
Crime - Murders per 100,000 population
Crime - Rapes per 100,000 population
Crime - Robberies per 100,000 population
Crime - Assaults per 100,000 population
Crime - Burglaries per 100,000 population
Crime - Thefts per 100,000 population
Crime - Auto thefts per 100,000 population
Crime - Arson per 100,000 population
Crime - City-data.com crime index
Crime - Violent crime index
Crime - Property crime index
Crime - Murders per 100,000 population (5 year average)
Crime - Rapes per 100,000 population (5 year average)
Crime - Robberies per 100,000 population (5 year average)
Crime - Assaults per 100,000 population (5 year average)
Crime - Burglaries per 100,000 population (5 year average)
Crime - Thefts per 100,000 population (5 year average)
Crime - Auto thefts per 100,000 population (5 year average)
Crime - Arson per 100,000 population (5 year average)
Crime - City-data.com crime index (5 year average)
Crime - Violent crime index (5 year average)
Crime - Property crime index (5 year average)
1996 Presidential Elections Results (%) - Democratic Party (Clinton)
1996 Presidential Elections Results (%) - Republican Party (Dole)
1996 Presidential Elections Results (%) - Other
2000 Presidential Elections Results (%) - Democratic Party (Gore)
2000 Presidential Elections Results (%) - Republican Party (Bush)
2000 Presidential Elections Results (%) - Other
2004 Presidential Elections Results (%) - Democratic Party (Kerry)
2004 Presidential Elections Results (%) - Republican Party (Bush)
2004 Presidential Elections Results (%) - Other
2008 Presidential Elections Results (%) - Democratic Party (Obama)
2008 Presidential Elections Results (%) - Republican Party (McCain)
2008 Presidential Elections Results (%) - Other
2012 Presidential Elections Results (%) - Democratic Party (Obama)
2012 Presidential Elections Results (%) - Republican Party (Romney)
2012 Presidential Elections Results (%) - Other
2016 Presidential Elections Results (%) - Democratic Party (Clinton)
2016 Presidential Elections Results (%) - Republican Party (Trump)
2016 Presidential Elections Results (%) - Other
2020 Presidential Elections Results (%) - Democratic Party (Biden)
2020 Presidential Elections Results (%) - Republican Party (Trump)
2020 Presidential Elections Results (%) - Other
Ancestries Reported - Arab (%)
Ancestries Reported - Czech (%)
Ancestries Reported - Danish (%)
Ancestries Reported - Dutch (%)
Ancestries Reported - English (%)
Ancestries Reported - French (%)
Ancestries Reported - French Canadian (%)
Ancestries Reported - German (%)
Ancestries Reported - Greek (%)
Ancestries Reported - Hungarian (%)
Ancestries Reported - Irish (%)
Ancestries Reported - Italian (%)
Ancestries Reported - Lithuanian (%)
Ancestries Reported - Norwegian (%)
Ancestries Reported - Polish (%)
Ancestries Reported - Portuguese (%)
Ancestries Reported - Russian (%)
Ancestries Reported - Scotch-Irish (%)
Ancestries Reported - Scottish (%)
Ancestries Reported - Slovak (%)
Ancestries Reported - Subsaharan African (%)
Ancestries Reported - Swedish (%)
Ancestries Reported - Swiss (%)
Ancestries Reported - Ukrainian (%)
Ancestries Reported - United States (%)
Ancestries Reported - Welsh (%)
Ancestries Reported - West Indian (%)
Ancestries Reported - Other (%)
Educational Attainment - No schooling completed (%)
Educational Attainment - Less than high school (%)
Educational Attainment - High school or equivalent (%)
Educational Attainment - Less than 1 year of college (%)
Educational Attainment - 1 or more years of college (%)
Educational Attainment - Associate degree (%)
Educational Attainment - Bachelor's degree (%)
Educational Attainment - Master's degree (%)
Educational Attainment - Professional school degree (%)
Educational Attainment - Doctorate degree (%)
School Enrollment - Nursery, preschool (%)
School Enrollment - Kindergarten (%)
School Enrollment - Grade 1 to 4 (%)
School Enrollment - Grade 5 to 8 (%)
School Enrollment - Grade 9 to 12 (%)
School Enrollment - College undergrad (%)
School Enrollment - Graduate or professional (%)
School Enrollment - Not enrolled in school (%)
School enrollment - Public schools (%)
School enrollment - Private schools (%)
School enrollment - Not enrolled (%)
Median number of rooms in houses and condos
Median number of rooms in apartments
Housing units lacking complete plumbing facilities (%)
Housing units lacking complete kitchen facilities (%)
Density of houses
Urban houses (%)
Rural houses (%)
Households with people 60 years and over (%)
Households with people 65 years and over (%)
Households with people 75 years and over (%)
Households with one or more nonrelatives (%)
Households with no nonrelatives (%)
Population in households (%)
Family households (%)
Nonfamily households (%)
Population in families (%)
Family households with own children (%)
Median number of bedrooms in owner occupied houses
Mean number of bedrooms in owner occupied houses
Median number of bedrooms in renter occupied houses
Mean number of bedrooms in renter occupied houses
Median number of vehichles in owner occupied houses
Mean number of vehichles in owner occupied houses
Median number of vehichles in renter occupied houses
Mean number of vehichles in renter occupied houses
Mortgage status - with mortgage (%)
Mortgage status - with second mortgage (%)
Mortgage status - with home equity loan (%)
Mortgage status - with both second mortgage and home equity loan (%)
Mortgage status - without a mortgage (%)
Average family size
Average family size - White
Average family size - Black or African American
Average family size - Asian
Average family size - Hispanic or Latino
Average family size - American Indian and Alaska Native
Average family size - Multirace
Average family size - Other Race
Geographical mobility - Same house 1 year ago (%)
Geographical mobility - Moved within same county (%)
Geographical mobility - Moved from different county within same state (%)
Geographical mobility - Moved from different state (%)
Geographical mobility - Moved from abroad (%)
Place of birth - Born in state of residence (%)
Place of birth - Born in other state (%)
Place of birth - Native, outside of US (%)
Place of birth - Foreign born (%)
Housing units in structures - 1, detached (%)
Housing units in structures - 1, attached (%)
Housing units in structures - 2 (%)
Housing units in structures - 3 or 4 (%)
Housing units in structures - 5 to 9 (%)
Housing units in structures - 10 to 19 (%)
Housing units in structures - 20 to 49 (%)
Housing units in structures - 50 or more (%)
Housing units in structures - Mobile home (%)
Housing units in structures - Boat, RV, van, etc. (%)
House/condo owner moved in on average (years ago)
Renter moved in on average (years ago)
Year householder moved into unit - Moved in 1999 to March 2000 (%)
Year householder moved into unit - Moved in 1995 to 1998 (%)
Year householder moved into unit - Moved in 1990 to 1994 (%)
Year householder moved into unit - Moved in 1980 to 1989 (%)
Year householder moved into unit - Moved in 1970 to 1979 (%)
Year householder moved into unit - Moved in 1969 or earlier (%)
Means of transportation to work - Drove car alone (%)
Means of transportation to work - Carpooled (%)
Means of transportation to work - Public transportation (%)
Means of transportation to work - Bus or trolley bus (%)
Means of transportation to work - Streetcar or trolley car (%)
Means of transportation to work - Subway or elevated (%)
Means of transportation to work - Railroad (%)
Means of transportation to work - Ferryboat (%)
Means of transportation to work - Taxicab (%)
Means of transportation to work - Motorcycle (%)
Means of transportation to work - Bicycle (%)
Means of transportation to work - Walked (%)
Means of transportation to work - Other means (%)
Working at home (%)
Industry diversity
Most Common Industries - Agriculture, forestry, fishing and hunting, and mining (%)
Most Common Industries - Agriculture, forestry, fishing and hunting (%)
Most Common Industries - Mining, quarrying, and oil and gas extraction (%)
Most Common Industries - Construction (%)
Most Common Industries - Manufacturing (%)
Most Common Industries - Wholesale trade (%)
Most Common Industries - Retail trade (%)
Most Common Industries - Transportation and warehousing, and utilities (%)
Most Common Industries - Transportation and warehousing (%)
Most Common Industries - Utilities (%)
Most Common Industries - Information (%)
Most Common Industries - Finance and insurance, and real estate and rental and leasing (%)
Most Common Industries - Finance and insurance (%)
Most Common Industries - Real estate and rental and leasing (%)
Most Common Industries - Professional, scientific, and management, and administrative and waste management services (%)
Most Common Industries - Professional, scientific, and technical services (%)
Most Common Industries - Management of companies and enterprises (%)
Most Common Industries - Administrative and support and waste management services (%)
Most Common Industries - Educational services, and health care and social assistance (%)
Most Common Industries - Educational services (%)
Most Common Industries - Health care and social assistance (%)
Most Common Industries - Arts, entertainment, and recreation, and accommodation and food services (%)
Most Common Industries - Arts, entertainment, and recreation (%)
Most Common Industries - Accommodation and food services (%)
Most Common Industries - Other services, except public administration (%)
Most Common Industries - Public administration (%)
Occupation diversity
Most Common Occupations - Management, business, science, and arts occupations (%)
Most Common Occupations - Management, business, and financial occupations (%)
Most Common Occupations - Management occupations (%)
Most Common Occupations - Business and financial operations occupations (%)
Most Common Occupations - Computer, engineering, and science occupations (%)
Most Common Occupations - Computer and mathematical occupations (%)
Most Common Occupations - Architecture and engineering occupations (%)
Most Common Occupations - Life, physical, and social science occupations (%)
Most Common Occupations - Education, legal, community service, arts, and media occupations (%)
Most Common Occupations - Community and social service occupations (%)
Most Common Occupations - Legal occupations (%)
Most Common Occupations - Education, training, and library occupations (%)
Most Common Occupations - Arts, design, entertainment, sports, and media occupations (%)
Most Common Occupations - Healthcare practitioners and technical occupations (%)
Most Common Occupations - Health diagnosing and treating practitioners and other technical occupations (%)
Most Common Occupations - Health technologists and technicians (%)
Most Common Occupations - Service occupations (%)
Most Common Occupations - Healthcare support occupations (%)
Most Common Occupations - Protective service occupations (%)
Most Common Occupations - Fire fighting and prevention, and other protective service workers including supervisors (%)
Most Common Occupations - Law enforcement workers including supervisors (%)
Most Common Occupations - Food preparation and serving related occupations (%)
Most Common Occupations - Building and grounds cleaning and maintenance occupations (%)
Most Common Occupations - Personal care and service occupations (%)
Most Common Occupations - Sales and office occupations (%)
Most Common Occupations - Sales and related occupations (%)
Most Common Occupations - Office and administrative support occupations (%)
Most Common Occupations - Natural resources, construction, and maintenance occupations (%)
Most Common Occupations - Farming, fishing, and forestry occupations (%)
Most Common Occupations - Construction and extraction occupations (%)
Most Common Occupations - Installation, maintenance, and repair occupations (%)
Most Common Occupations - Production, transportation, and material moving occupations (%)
Most Common Occupations - Production occupations (%)
Most Common Occupations - Transportation occupations (%)
Most Common Occupations - Material moving occupations (%)
People in Group quarters - Institutionalized population (%)
People in Group quarters - Correctional institutions (%)
People in Group quarters - Federal prisons and detention centers (%)
People in Group quarters - Halfway houses (%)
People in Group quarters - Local jails and other confinement facilities (including police lockups) (%)
People in Group quarters - Military disciplinary barracks (%)
People in Group quarters - State prisons (%)
People in Group quarters - Other types of correctional institutions (%)
People in Group quarters - Nursing homes (%)
People in Group quarters - Hospitals/wards, hospices, and schools for the handicapped (%)
People in Group quarters - Hospitals/wards and hospices for chronically ill (%)
People in Group quarters - Hospices or homes for chronically ill (%)
People in Group quarters - Military hospitals or wards for chronically ill (%)
People in Group quarters - Other hospitals or wards for chronically ill (%)
People in Group quarters - Hospitals or wards for drug/alcohol abuse (%)
People in Group quarters - Mental (Psychiatric) hospitals or wards (%)
People in Group quarters - Schools, hospitals, or wards for the mentally retarded (%)
People in Group quarters - Schools, hospitals, or wards for the physically handicapped (%)
People in Group quarters - Institutions for the deaf (%)
People in Group quarters - Institutions for the blind (%)
People in Group quarters - Orthopedic wards and institutions for the physically handicapped (%)
People in Group quarters - Wards in general hospitals for patients who have no usual home elsewhere (%)
People in Group quarters - Wards in military hospitals for patients who have no usual home elsewhere (%)
People in Group quarters - Juvenile institutions (%)
People in Group quarters - Long-term care (%)
People in Group quarters - Homes for abused, dependent, and neglected children (%)
People in Group quarters - Residential treatment centers for emotionally disturbed children (%)
People in Group quarters - Training schools for juvenile delinquents (%)
People in Group quarters - Short-term care, detention or diagnostic centers for delinquent children (%)
People in Group quarters - Type of juvenile institution unknown (%)
People in Group quarters - Noninstitutionalized population (%)
People in Group quarters - College dormitories (includes college quarters off campus) (%)
People in Group quarters - Military quarters (%)
People in Group quarters - On base (%)
People in Group quarters - Barracks, unaccompanied personnel housing (UPH), (Enlisted/Officer), ;and similar group living quarters for military personnel (%)
People in Group quarters - Transient quarters for temporary residents (%)
People in Group quarters - Military ships (%)
People in Group quarters - Group homes (%)
People in Group quarters - Homes or halfway houses for drug/alcohol abuse (%)
People in Group quarters - Homes for the mentally ill (%)
People in Group quarters - Homes for the mentally retarded (%)
People in Group quarters - Homes for the physically handicapped (%)
People in Group quarters - Other group homes (%)
People in Group quarters - Religious group quarters (%)
People in Group quarters - Dormitories (%)
People in Group quarters - Agriculture workers' dormitories on farms (%)
People in Group quarters - Job Corps and vocational training facilities (%)
People in Group quarters - Other workers' dormitories (%)
People in Group quarters - Crews of maritime vessels (%)
People in Group quarters - Other nonhousehold living situations (%)
People in Group quarters - Other noninstitutional group quarters (%)
Residents speaking English at home (%)
Residents speaking English at home - Born in the United States (%)
Residents speaking English at home - Native, born elsewhere (%)
Residents speaking English at home - Foreign born (%)
Residents speaking Spanish at home (%)
Residents speaking Spanish at home - Born in the United States (%)
Residents speaking Spanish at home - Native, born elsewhere (%)
Residents speaking Spanish at home - Foreign born (%)
Residents speaking other language at home (%)
Residents speaking other language at home - Born in the United States (%)
Residents speaking other language at home - Native, born elsewhere (%)
Residents speaking other language at home - Foreign born (%)
Class of Workers - Employee of private company (%)
Class of Workers - Self-employed in own incorporated business (%)
Class of Workers - Private not-for-profit wage and salary workers (%)
Class of Workers - Local government workers (%)
Class of Workers - State government workers (%)
Class of Workers - Federal government workers (%)
Class of Workers - Self-employed workers in own not incorporated business and Unpaid family workers (%)
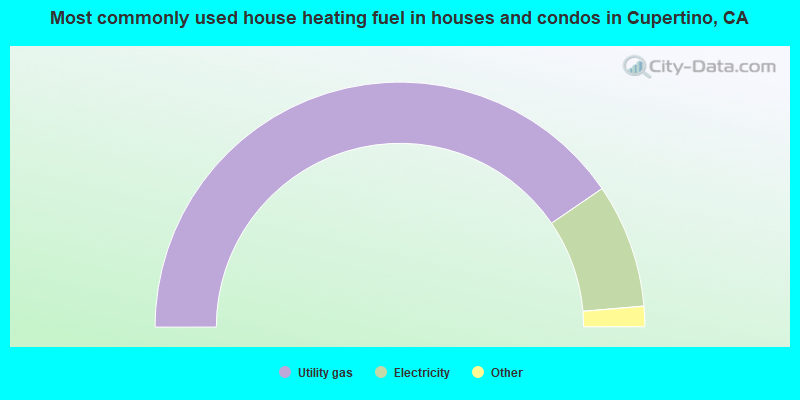
House heating fuel used in houses and condos - Utility gas (%)
House heating fuel used in houses and condos - Bottled, tank, or LP gas (%)
House heating fuel used in houses and condos - Electricity (%)
House heating fuel used in houses and condos - Fuel oil, kerosene, etc. (%)
House heating fuel used in houses and condos - Coal or coke (%)
House heating fuel used in houses and condos - Wood (%)
House heating fuel used in houses and condos - Solar energy (%)
House heating fuel used in houses and condos - Other fuel (%)
House heating fuel used in houses and condos - No fuel used (%)
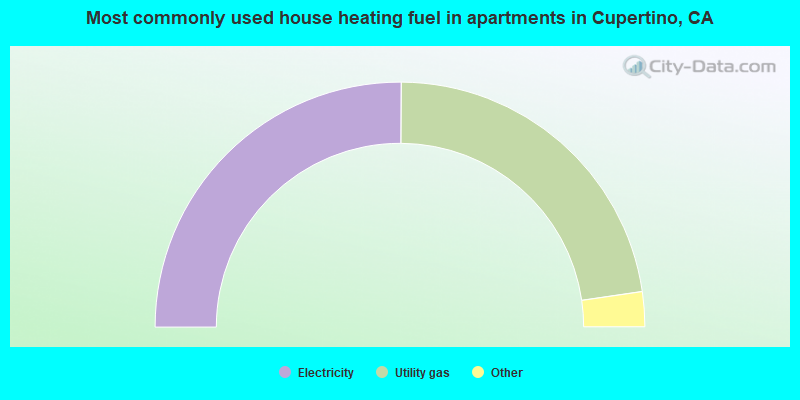
House heating fuel used in apartments - Utility gas (%)
House heating fuel used in apartments - Bottled, tank, or LP gas (%)
House heating fuel used in apartments - Electricity (%)
House heating fuel used in apartments - Fuel oil, kerosene, etc. (%)
House heating fuel used in apartments - Coal or coke (%)
House heating fuel used in apartments - Wood (%)
House heating fuel used in apartments - Solar energy (%)
House heating fuel used in apartments - Other fuel (%)
House heating fuel used in apartments - No fuel used (%)
Armed forces status - In Armed Forces (%)
Armed forces status - Civilian (%)
Armed forces status - Civilian - Veteran (%)
Armed forces status - Civilian - Nonveteran (%)
Fatal accidents locations in years 2005-2021
Fatal accidents locations in 2005
Fatal accidents locations in 2006
Fatal accidents locations in 2007
Fatal accidents locations in 2008
Fatal accidents locations in 2009
Fatal accidents locations in 2010
Fatal accidents locations in 2011
Fatal accidents locations in 2012
Fatal accidents locations in 2013
Fatal accidents locations in 2014
Fatal accidents locations in 2015
Fatal accidents locations in 2016
Fatal accidents locations in 2017
Fatal accidents locations in 2018
Fatal accidents locations in 2019
Fatal accidents locations in 2020
Fatal accidents locations in 2021
Alcohol use - People drinking some alcohol every month (%)
Alcohol use - People not drinking at all (%)
Alcohol use - Average days/month drinking alcohol
Alcohol use - Average drinks/week
Alcohol use - Average days/year people drink much
Audiometry - Average condition of hearing (%)
Audiometry - People that can hear a whisper from across a quiet room (%)
Audiometry - People that can hear normal voice from across a quiet room (%)
Audiometry - Ears ringing, roaring, buzzing (%)
Audiometry - Had a job exposure to loud noise (%)
Audiometry - Had off-work exposure to loud noise (%)
Blood Pressure & Cholesterol - Has high blood pressure (%)
Blood Pressure & Cholesterol - Checking blood pressure at home (%)
Blood Pressure & Cholesterol - Frequently checking blood cholesterol (%)
Blood Pressure & Cholesterol - Has high cholesterol level (%)
Consumer Behavior - Money monthly spent on food at supermarket/grocery store
Consumer Behavior - Money monthly spent on food at other stores
Consumer Behavior - Money monthly spent on eating out
Consumer Behavior - Money monthly spent on carryout/delivered foods
Consumer Behavior - Income spent on food at supermarket/grocery store (%)
Consumer Behavior - Income spent on food at other stores (%)
Consumer Behavior - Income spent on eating out (%)
Consumer Behavior - Income spent on carryout/delivered foods (%)
Current Health Status - General health condition (%)
Current Health Status - Blood donors (%)
Current Health Status - Has blood ever tested for HIV virus (%)
Current Health Status - Left-handed people (%)
Dermatology - People using sunscreen (%)
Diabetes - Diabetics (%)
Diabetes - Had a blood test for high blood sugar (%)
Diabetes - People taking insulin (%)
Diet Behavior & Nutrition - Diet health (%)
Diet Behavior & Nutrition - Milk product consumption (# of products/month)
Diet Behavior & Nutrition - Meals not home prepared (#/week)
Diet Behavior & Nutrition - Meals from fast food or pizza place (#/week)
Diet Behavior & Nutrition - Ready-to-eat foods (#/month)
Diet Behavior & Nutrition - Frozen meals/pizza (#/month)
Drug Use - People that ever used marijuana or hashish (%)
Drug Use - Ever used hard drugs (%)
Drug Use - Ever used any form of cocaine (%)
Drug Use - Ever used heroin (%)
Drug Use - Ever used methamphetamine (%)
Health Insurance - People covered by health insurance (%)
Kidney Conditions-Urology - Avg. # of times urinating at night
Medical Conditions - People with asthma (%)
Medical Conditions - People with anemia (%)
Medical Conditions - People with psoriasis (%)
Medical Conditions - People with overweight (%)
Medical Conditions - Elderly people having difficulties in thinking or remembering (%)
Medical Conditions - People who ever received blood transfusion (%)
Medical Conditions - People having trouble seeing even with glass/contacts (%)
Medical Conditions - People with arthritis (%)
Medical Conditions - People with gout (%)
Medical Conditions - People with congestive heart failure (%)
Medical Conditions - People with coronary heart disease (%)
Medical Conditions - People with angina pectoris (%)
Medical Conditions - People who ever had heart attack (%)
Medical Conditions - People who ever had stroke (%)
Medical Conditions - People with emphysema (%)
Medical Conditions - People with thyroid problem (%)
Medical Conditions - People with chronic bronchitis (%)
Medical Conditions - People with any liver condition (%)
Medical Conditions - People who ever had cancer or malignancy (%)
Mental Health - People who have little interest in doing things (%)
Mental Health - People feeling down, depressed, or hopeless (%)
Mental Health - People who have trouble sleeping or sleeping too much (%)
Mental Health - People feeling tired or having little energy (%)
Mental Health - People with poor appetite or overeating (%)
Mental Health - People feeling bad about themself (%)
Mental Health - People who have trouble concentrating on things (%)
Mental Health - People moving or speaking slowly or too fast (%)
Mental Health - People having thoughts they would be better off dead (%)
Oral Health - Average years since last visit a dentist
Oral Health - People embarrassed because of mouth (%)
Oral Health - People with gum disease (%)
Oral Health - General health of teeth and gums (%)
Oral Health - Average days a week using dental floss/device
Oral Health - Average days a week using mouthwash for dental problem
Oral Health - Average number of teeth
Pesticide Use - Households using pesticides to control insects (%)
Pesticide Use - Households using pesticides to kill weeds (%)
Physical Activity - People doing vigorous-intensity work activities (%)
Physical Activity - People doing moderate-intensity work activities (%)
Physical Activity - People walking or bicycling (%)
Physical Activity - People doing vigorous-intensity recreational activities (%)
Physical Activity - People doing moderate-intensity recreational activities (%)
Physical Activity - Average hours a day doing sedentary activities
Physical Activity - Average hours a day watching TV or videos
Physical Activity - Average hours a day using computer
Physical Functioning - People having limitations keeping them from working (%)
Physical Functioning - People limited in amount of work they can do (%)
Physical Functioning - People that need special equipment to walk (%)
Physical Functioning - People experiencing confusion/memory problems (%)
Physical Functioning - People requiring special healthcare equipment (%)
Prescription Medications - Average number of prescription medicines taking
Preventive Aspirin Use - Adults 40+ taking low-dose aspirin (%)
Reproductive Health - Vaginal deliveries (%)
Reproductive Health - Cesarean deliveries (%)
Reproductive Health - Deliveries resulted in a live birth (%)
Reproductive Health - Pregnancies resulted in a delivery (%)
Reproductive Health - Women breastfeeding newborns (%)
Reproductive Health - Women that had a hysterectomy (%)
Reproductive Health - Women that had both ovaries removed (%)
Reproductive Health - Women that have ever taken birth control pills (%)
Reproductive Health - Women taking birth control pills (%)
Reproductive Health - Women that have ever used Depo-Provera or injectables (%)
Reproductive Health - Women that have ever used female hormones (%)
Sexual Behavior - People 18+ that ever had sex (vaginal, anal, or oral) (%)
Sexual Behavior - Males 18+ that ever had vaginal sex with a woman (%)
Sexual Behavior - Males 18+ that ever performed oral sex on a woman (%)
Sexual Behavior - Males 18+ that ever had anal sex with a woman (%)
Sexual Behavior - Males 18+ that ever had any sex with a man (%)
Sexual Behavior - Females 18+ that ever had vaginal sex with a man (%)
Sexual Behavior - Females 18+ that ever performed oral sex on a man (%)
Sexual Behavior - Females 18+ that ever had anal sex with a man (%)
Sexual Behavior - Females 18+ that ever had any kind of sex with a woman (%)
Sexual Behavior - Average age people first had sex
Sexual Behavior - Average number of female sex partners in lifetime (males 18+)
Sexual Behavior - Average number of female vaginal sex partners in lifetime (males 18+)
Sexual Behavior - Average age people first performed oral sex on a woman (18+)
Sexual Behavior - Average number of woman performed oral sex on in lifetime (18+)
Sexual Behavior - Average number of male sex partners in lifetime (males 18+)
Sexual Behavior - Average number of male anal sex partners in lifetime (males 18+)
Sexual Behavior - Average age people first performed oral sex on a man (18+)
Sexual Behavior - Average number of male oral sex partners in lifetime (18+)
Sexual Behavior - People using protection when performing oral sex (%)
Sexual Behavior - Average number of times people have vaginal or anal sex a year
Sexual Behavior - People having sex without condom (%)
Sexual Behavior - Average number of male sex partners in lifetime (females 18+)
Sexual Behavior - Average number of male vaginal sex partners in lifetime (females 18+)
Sexual Behavior - Average number of female sex partners in lifetime (females 18+)
Sexual Behavior - Circumcised males 18+ (%)
Sleep Disorders - Average hours sleeping at night
Sleep Disorders - People that has trouble sleeping (%)
Smoking-Cigarette Use - People smoking cigarettes (%)
Taste & Smell - People 40+ having problems with smell (%)
Taste & Smell - People 40+ having problems with taste (%)
Taste & Smell - People 40+ that ever had wisdom teeth removed (%)
Taste & Smell - People 40+ that ever had tonsils teeth removed (%)
Taste & Smell - People 40+ that ever had a loss of consciousness because of a head injury (%)
Taste & Smell - People 40+ that ever had a broken nose or other serious injury to face or skull (%)
Taste & Smell - People 40+ that ever had two or more sinus infections (%)
Weight - Average height (inches)
Weight - Average weight (pounds)
Weight - Average BMI
Weight - People that are obese (%)
Weight - People that ever were obese (%)
Weight - People trying to lose weight (%)
42,503 72.9% Asian alone 11,825 20.3% White alone 2,091 3.6% Two or more races 1,819 3.1% Hispanic 662 1.1% Black alone 242 0.4% Native Hawaiian and Other 175 0.3% Other race alone 50 0.09% American Indian alone
According to our research of California and other state lists, there were 15 registered sex offenders living in Cupertino, California as of May 02, 2024 . The ratio of all residents to sex offenders in Cupertino is 4,093 to 1.The ratio of registered sex offenders to all residents in this city is much lower than the state average.
Officers per 1,000 residents here:
0.02California average:
1.98
Latest news from Cupertino, CA collected exclusively by city-data.com from local newspapers, TV, and radio stations
Ancestries: European (2.3%), American (2.0%), Iranian (1.3%), English (1.1%), German (1.1%).
Current Local Time:
Land area: 10.9 square miles.
Population density: 5,289 people per square mile (average).
32,282 residents are foreign born (47.9% Asia ).
This city:
55.3%California:
26.5%
Median real estate property taxes paid for housing units with mortgages in 2022: $10,001 (0.4%)Median real estate property taxes paid for housing units with no mortgage in 2022: $10,281 (0.5%)
Nearest city with pop. 200,000+: San Jose, CA
Nearest city with pop. 1,000,000+: Los Angeles, CA
Nearest cities:
Latitude: 37.32 N, Longitude: 122.04 W
Daytime population change due to commuting: +20,949 (+35.9%)Workers who live and work in this city: 11,502 (41.8%)
Area code commonly used in this area: 408
Cupertino tourist attractions:
Single-family new house construction building permits:
2022: 90 buildings , average cost: $409,1002021: 45 buildings , average cost: $349,9002020: 47 buildings , average cost: $456,9002019: 68 buildings , average cost: $511,5002018: 41 buildings , average cost: $593,9002017: 53 buildings , average cost: $449,8002016: 57 buildings , average cost: $381,0002015: 52 buildings , average cost: $490,8002014: 41 buildings , average cost: $388,9002013: 55 buildings , average cost: $430,9002012: 43 buildings , average cost: $458,8002011: 51 buildings , average cost: $362,8002010: 24 buildings , average cost: $534,5002009: 21 buildings , average cost: $419,7002008: 65 buildings , average cost: $457,1002007: 83 buildings , average cost: $697,7002006: 78 buildings , average cost: $546,3002005: 114 buildings , average cost: $331,7002004: 87 buildings , average cost: $340,0002003: 36 buildings , average cost: $408,4002002: 111 buildings , average cost: $248,4002001: 45 buildings , average cost: $349,0002000: 112 buildings , average cost: $298,3001999: 130 buildings , average cost: $314,7001998: 73 buildings , average cost: $339,2001997: 58 buildings , average cost: $266,100Unemployment in December 2023:
Population change in the 1990s: +10,125 (+25.0%).
Most common industries in Cupertino, CA (%)
Both Males Females
Computer & electronic products (27.0%)
Professional, scientific, technical services (17.8%)
Educational services (6.7%)
Health care (4.9%)
Data processing, libraries, other information services (3.5%)
Finance & insurance (3.3%)
Construction (2.7%)
Computer & electronic products (31.7%)
Professional, scientific, technical services (19.9%)
Construction (3.8%)
Data processing, libraries, other information services (3.8%)
Educational services (2.9%)
Finance & insurance (2.9%)
Accommodation & food services (2.8%)
Computer & electronic products (20.1%)
Professional, scientific, technical services (14.7%)
Educational services (12.4%)
Health care (8.7%)
Finance & insurance (3.8%)
Real estate & rental & leasing (3.0%)
Data processing, libraries, other information services (3.0%)
Most common occupations in Cupertino, CA (%)
Both Males Females
Computer specialists (15.7%)
Engineers (10.9%)
Other management occupations, except farmers and farm managers (7.9%)
Top executives (5.1%)
Advertising, marketing, promotions, public relations, and sales managers (3.8%)
Other sales and related occupations, including supervisors (3.4%)
Accountants and auditors (2.8%)
Computer specialists (18.8%)
Engineers (16.2%)
Other management occupations, except farmers and farm managers (9.1%)
Top executives (7.1%)
Advertising, marketing, promotions, public relations, and sales managers (3.9%)
Other sales and related occupations, including supervisors (3.3%)
Operations specialties managers, except financial managers (3.2%)
Computer specialists (11.2%)
Other management occupations, except farmers and farm managers (6.2%)
Accountants and auditors (5.2%)
Preschool, kindergarten, elementary, and middle school teachers (4.5%)
Secretaries and administrative assistants (4.5%)
Other office and administrative support workers, including supervisors (4.4%)
Advertising, marketing, promotions, public relations, and sales managers (3.8%)
Earthquake activity:
Cupertino-area historical earthquake activity is significantly above California state average. It is 7552% greater than the overall U.S. average. On 4/18/1906 at 13:12:21, a magnitude 7.9 (7.9 UK, Class: Major, Intensity: VIII - XII) earthquake occurred 70.6 miles away from the city center, causing $524,000,000 total damage On 10/18/1989 at 00:04:15, a magnitude 7.1 (6.5 MB, 7.1 MS, 6.9 MW, 7.0 ML) earthquake occurred 20.7 miles away from Cupertino center, causing 62 deaths ( 62 shaking deaths) and 3757 injuries, causing $1,305,032,704 total damage On 11/4/1927 at 13:51:53, a magnitude 7.5 (7.5 UK) earthquake occurred 175.5 miles away from the city center On 7/21/1952 at 11:52:14, a magnitude 7.7 (7.7 UK) earthquake occurred 233.5 miles away from the city center, causing $50,000,000 total damage On 1/31/1922 at 13:17:28, a magnitude 7.6 (7.6 UK) earthquake occurred 300.5 miles away from Cupertino center On 12/21/1932 at 06:10:09, a magnitude 7.2 (7.2 UK) earthquake occurred 231.2 miles away from Cupertino center Magnitude types: body-wave magnitude (MB), local magnitude (ML), surface-wave magnitude (MS), moment magnitude (MW) Natural disasters: The number of natural disasters in Santa Clara County (19) is greater than the US average (15).Major Disasters (Presidential) Declared: 10Emergencies Declared: 3Floods: 9, Fires: 5, Winter Storms: 5, Storms: 4, Mudslides: 3, Landslides: 2, Drought: 1, Earthquake: 1, Freeze: 1, Hurricane: 1, Tornado: 1, Other: 1 (Note: some incidents may be assigned to more than one category). Main business address for: MISSION WEST PROPERTIES INC REAL ESTATE INVESTMENT TRUSTS ), DURECT CORP PHARMACEUTICAL PREPARATIONS ), APPLE COMPUTER INC ELECTRONIC COMPUTERS ), PORTAL SOFTWARE INC SERVICES-COMPUTER PROGRAMMING SERVICES ), SYMANTEC CORP SERVICES-PREPACKAGED SOFTWARE ), NETMANAGE INC SERVICES-PREPACKAGED SOFTWARE ), PACKETEER INC SERVICES-COMPUTER INTEGRATED SYSTEMS DESIGN ), CHORDIANT SOFTWARE INC SERVICES-PREPACKAGED SOFTWARE ).
Hospitals and medical centers in Cupertino: KAISER FOUNDATION HOSPITAL HOSPICE-SANTA CLARA (10080 N WOLFE ROAD SUITE SW3-160) CUPERTINO HEALTHCARE AND WELLNESS CENTER (22590 VOSS AVENUE)
HEALTH CARE CTR AT THE FORUM AT RANCHO SAN ANTONIO (23600 VIA ESPLENDOR)
SUNNY VIEW MANOR (22445 CUPERTINO ROAD)
SATELLITE DIALYSIS CUPERTINO (10596 N TANTAU AVENUE)
Amtrak stations near Cupertino: 7 miles: SANTA CLARA-GREAT AMERICA (SANTA CLARA, FOOT OF STARS & STRIPES DR.) Services: partially wheelchair accessible, free short-term parking.
8 miles: SAN JOSE (65 CAHILL ST.) Services: ticket office, fully wheelchair accessible, enclosed waiting area, public restrooms, public payphones, paid short-term parking, free long-term parking, taxi stand, public transit connection.
17 miles: FREEMONT-MISSION SAN JOSE (FREMONT, MISSION BLVD. & I-680) - Bus Station Services: fully wheelchair accessible, public payphones, free short-term parking, call for taxi service, public transit connection.
College/University in Cupertino: De Anza College Full-time enrollment: 16,729; Location: 21250 Stevens Creek Blvd.; Public; Website: www.deanza.edu/)
Other colleges/universities with over 2000 students near Cupertino:
West Valley College (about 5 miles; Saratoga, CA ; Full-time enrollment: 6,128)
Foothill College (about 6 miles; Los Altos Hills, CA ; FT enrollment: 9,635)
Mission College (about 7 miles; Santa Clara, CA ; FT enrollment: 5,625)
San Jose City College (about 7 miles; San Jose, CA ; FT enrollment: 5,526)
Santa Clara University (about 7 miles; Santa Clara, CA ; FT enrollment: 7,640)
San Jose State University (about 9 miles; San Jose, CA ; FT enrollment: 23,357)
Stanford University (about 12 miles; Stanford, CA ; FT enrollment: 14,410)
Public high schools in Cupertino: MONTA VISTA HIGH Students: 1,860, Location: 21840 MCCLELLAN RD., Grades: 9-12)HOMESTEAD HIGH Students: 1,572, Location: 21370 HOMESTEAD RD., Grades: 9-12)CUPERTINO HIGH Students: 1,179, Location: 10100 FINCH AVE., Grades: 9-12)Biggest public elementary/middle schools in Cupertino: JOHN F. KENNEDY MIDDLE Students: 1,293, Location: 821 BUBB RD., Grades: 6-8)SAM H. LAWSON MIDDLE Students: 988, Location: 10401 VISTA DR., Grades: 6-8)WARREN E. HYDE MIDDLE Students: 841, Location: 19325 BOLLINGER RD., Grades: 6-8)ABRAHAM LINCOLN ELEMENTARY Students: 468, Location: 21710 MCCLELLAN RD., Grades: KG-5)WILLIAM REGNART ELEMENTARY Students: 437, Location: 1170 YORKSHIRE DR., Grades: KG-5)STEVENS CREEK ELEMENTARY Students: 415, Location: 10300 AINSWORTH DR., Grades: KG-5)GARDEN GATE ELEMENTARY Students: 407, Location: 10500 ANN ARBOR AVE., Grades: KG-5)C. B. EATON ELEMENTARY Students: 401, Location: 20220 SUISUN DR., Grades: KG-5)L. P. COLLINS ELEMENTARY Students: 396, Location: 10300 BLANEY AVE., Grades: KG-5)WILLIAM FARIA ELEMENTARY Students: 383, Location: 10155 BARBARA LN., Grades: KG-5)Private elementary/middle schools in Cupertino: ST JOSEPH OF CUPERTINO ELEMENTARY SCHOOL Students: 348, Location: 10120 N DE ANZA BLVD, Grades: PK-8)
BETHEL LUTHERAN SCHOOL Students: 124, Location: 10181 FINCH AVE, Grades: PK-5)
See full list of schools located in Cupertino User-submitted facts and corrections:
Private primary/middle schools in Cupertino: St. Joseph of Cupertino School; Students, 315; Location 10120 N. De Anza Blvd. Cupertino, CA 95014; Grades KG-8 added by DB
Collins Elementary has a new location, see collinselementary.com. Lawson Middle School is now where Collins used to be. Lawson does not appear on your list of schools. added by Dave
Notable locations in Cupertino: (A) , Blackberry Farm Golf Course (B) , Santa Clara County Fire Department Monta Vista Fire Station (C) , Santa Clara County Fire Department Seven Springs Station (D) , Northwest YMCA (E) , Hinson Campus Center (F) , Flint Center (G) , Cupertino Public Library (H) , Cupertino City Hall (I) , California History Center (J) , Kirsch Center (K) , Santa Clara County Fire Department Cupertino Fire Station (L) . Display/hide their locations on the map
Shopping Centers: (1) , Vallco Fashion Park Shopping Center (2) , Portal Plaza Shopping Center (3) , Orchard Valley Marketplace Shopping Center (4) , Loree Shopping Center (5) , Idlewild Shopping Center (6) , Homestead Square Shopping Center (7) , The Oaks Shopping Center (8) , Mervyns Cupertino Crossroads Shopping Center (9) . Display/hide their locations on the map
Main business address in Cupertino include: (A) , DURECT CORP (B) , APPLE COMPUTER INC (C) , PORTAL SOFTWARE INC (D) , SYMANTEC CORP (E) , NETMANAGE INC (F) , PACKETEER INC (G) , CHORDIANT SOFTWARE INC (H) . Display/hide their locations on the map
Churches in Cupertino include: (A) , International Baptist Church (B) , Church of the Nazarene (C) , Kingdom Hall of Jehovahs Witnesses (D) , Redeemer Lutheran Church (E) , Saint Judes Episcopal Church (F) , Union Church of Cupertino (G) , West Valley Presbyterian Church (H) , Bethel Lutheran Church (I) . Display/hide their locations on the map
Cemetery: (1) . Display/hide its location on the map
Creek: (A) . Display/hide its location on the map
Parks in Cupertino include: (1) , Hoover Park (2) , Linda Vista Park (3) , McClellan Ranch Park (4) , Monta Vista Park (5) , Somerset Square Park (6) , Three Oaks Park (7) , Varian Park (8) , Creekside Park (9) . Display/hide their locations on the map
Tourist attraction:
Hotels:
Birthplace of: Aaron Eckhart - Actor, Daniel Puder - Professional wrestler, Bryan Mantia - Heavy metal drummer, Mark Dougherty - Soccer player-coach, Matthew Axelson - 25px Petty Officer 2nd Class, David Kramer (soccer) - Soccer player-coach, Eric Sexton - Computer game developer, Brett Sickler - Rower.
Santa Clara County has a predicted average indoor radon screening level between 2 and 4 pCi/L (pico curies per liter) - Moderate Potential Average household size: This city:
2.9 peopleCalifornia:
2.9 people
Percentage of family households: This city:
78.2%Whole state:
68.7%
Percentage of households with unmarried partners: This city:
2.3%Whole state:
7.2%
Likely homosexual households (counted as self-reported same-sex unmarried-partner households)
Lesbian couples: 0.2% of all households Gay men: 0.2% of all households
People in group quarters in Cupertino in 2010:
258 people in nursing facilities/skilled-nursing facilities
25 people in group homes intended for adults
22 people in other noninstitutional facilities
14 people in workers' group living quarters and job corps centers
12 people in residential treatment centers for juveniles (non-correctional)
6 people in group homes for juveniles (non-correctional)
People in group quarters in Cupertino in 2000:
377 people in nursing homes
64 people in religious group quarters
7 people in homes for the physically handicapped
Banks with most branches in Cupertino (2011 data):
Wells Fargo Bank, National Association: Cupertino Branch at 10260 South De Anza Boulevard, branch established on 1962/06/01; Foothill Crossing Branch at 22390 Homestead Road, branch established on 2006/03/27. Info updated 2011/04/05: Bank assets: $1,161,490.0 mil, Deposits: $905,653.0 mil, headquarters in Sioux Falls, SD, positive income , 6395 total offices , Holding Company: Wells Fargo & Company
JPMorgan Chase Bank, National Association: 20573 Stevens Creek Blvd Branch at 20573 Stevens Creek Blvd, branch established on 1889/01/01; 10250 S De Anza Blvd Branch at 10250 S De Anza Blvd, branch established on 1919/01/01. Info updated 2011/11/10: Bank assets: $1,811,678.0 mil, Deposits: $1,190,738.0 mil, headquarters in Columbus, OH, positive income , International Specialization, 5577 total offices , Holding Company: Jpmorgan Chase & Co.
U.S. Bank National Association: Cupertino De Anza Branch at 10381 S. De Anza Boulevard, branch established on 1957/10/16; Cupertino Branch at 19630 Stevens Creek Boulevard, branch established on 1928/01/01. Info updated 2012/01/30: Bank assets: $330,470.8 mil, Deposits: $236,091.5 mil, headquarters in Cincinnati, OH, positive income , 3121 total offices , Holding Company: U.S. Bancorp
Cathay Bank: Cupertino Branch at 10480 S. De Anza Blvd, branch established on 1994/08/03; Stevens Creek Boulevard Branch at 20195 Stevens Creek Boulevard, branch established on 2004/10/11. Info updated 2010/12/08: Bank assets: $10,628.9 mil, Deposits: $7,249.8 mil, headquarters in Los Angeles, CA, positive income , Commercial Lending Specialization, 52 total offices , Holding Company: Cathay General Bancorp
Bank of America, National Association: Vallco Park Branch at 19376 Stevens Creek Blvd, branch established on 1961/12/19; Cupertino Branch at 20563 Stevens Creek Boulevard, branch established on 1964/05/18. Info updated 2009/11/18: Bank assets: $1,451,969.3 mil, Deposits: $1,077,176.8 mil, headquarters in Charlotte, NC, positive income , 5782 total offices , Holding Company: Bank Of America Corporation
East West Bank: Cupertino Branch at 10945 Wolfe Road, branch established on 1997/09/22; Cupertino Branch at 10001 North De Anza Blvd, branch established on 1997/12/01. Info updated 2010/06/14: Bank assets: $21,962.4 mil, Deposits: $17,501.8 mil, headquarters in Pasadena, CA, positive income , Commercial Lending Specialization, 131 total offices , Holding Company: East West Bancorp, Inc.
Citibank, National Association: Cupertino Branch at 19300 Stevens Creek Boulevard, branch established on 1998/09/11. Info updated 2012/01/10: Bank assets: $1,288,658.0 mil, Deposits: $882,541.0 mil, headquarters in Sioux Falls, SD, positive income , International Specialization, 1048 total offices , Holding Company: Citigroup Inc.
Comerica Bank: Cupertino Branch at 10020 North De Anza Boulevard, branch established on 1978/02/27. Info updated 2011/07/29: Bank assets: $60,970.5 mil, Deposits: $48,300.9 mil, headquarters in Dallas, TX, positive income , Commercial Lending Specialization, 497 total offices , Holding Company: Comerica Incorporated
Chinatrust Bank (U.S.A.): Cupertino Branch at 19648 Stevens Creek Boulevard, branch established on 1997/10/02. Info updated 2012/02/10: Bank assets: $1,418.6 mil, Deposits: $1,066.3 mil, headquarters in Torrance, CA, positive income , Commercial Lending Specialization, 12 total offices , Holding Company: Chinatrust Financial Holding Company, Ltd.
5 other banks with 5 local branches
For population 15 years and over in Cupertino:
Never married: 28.2%Now married: 62.5%Separated: 0.8%Widowed: 4.5%Divorced: 3.9% For population 25 years and over in Cupertino:
High school or higher: 97.2%Bachelor's degree or higher: 82.8%Graduate or professional degree: 49.0%Unemployed: 2.3%Mean travel time to work (commute): 16.8 minutes
Education Gini index (Inequality in education) Here:
8.8California average:
15.5
Religion statistics for Cupertino, CA (based on Santa Clara County data)
Religion Adherents Congregations Catholic 447,369 56 Evangelical Protestant 148,599 481 Other 125,165 221 Mainline Protestant 44,623 132 Orthodox 7,720 17 Black Protestant 2,552 20 None 1,005,614 -
Source: Clifford Grammich, Kirk Hadaway, Richard Houseal, Dale E.Jones, Alexei Krindatch, Richie Stanley and Richard H.Taylor. 2012. 2010 U.S.Religion Census: Religious Congregations & Membership Study. Association of Statisticians of American Religious Bodies. Jones, Dale E., et al. 2002. Congregations and Membership in the United States 2000. Nashville, TN: Glenmary Research Center. Graphs represent county-level data
Food Environment Statistics: Number of grocery stores : 345Santa Clara County :
1.99 / 10,000 pop.California :
2.14 / 10,000 pop.
Number of supercenters and club stores : 7This county :
0.04 / 10,000 pop.State :
0.04 / 10,000 pop.
Number of convenience stores (no gas) : 117Santa Clara County :
0.68 / 10,000 pop.California :
0.62 / 10,000 pop.
Number of convenience stores (with gas) : 239Santa Clara County :
1.38 / 10,000 pop.California :
1.49 / 10,000 pop.
Number of full-service restaurants : 1,488Santa Clara County :
8.59 / 10,000 pop.California :
7.42 / 10,000 pop.
Adult diabetes rate : Santa Clara County :
7.1%California :
7.3%
Adult obesity rate : Santa Clara County :
19.0%State :
21.3%
Low-income preschool obesity rate : Santa Clara County :
16.6%California :
17.9%
Health and Nutrition: Healthy diet rate : Cupertino:
57.3%California:
49.4%
Average overall health of teeth and gums : Here:
54.2%California:
48.0%
Average BMI : Cupertino:
26.6California:
28.1
People feeling badly about themselves : Cupertino:
15.5%California:
20.2%
People not drinking alcohol at all : This city:
15.4%California:
11.2%
Average hours sleeping at night : This city:
6.9California:
6.8
Overweight people : Here:
27.5%California:
31.5%
General health condition : Cupertino:
61.1%California:
56.4%
Average condition of hearing : This city:
82.2%State:
80.9%
More about Health and Nutrition of Cupertino, CA Residents
Local government employment and payroll (March 2022)
Function
Full-time employees
Monthly full-time payroll
Average yearly full-time wage
Part-time employees
Monthly part-time payroll
Streets and Highways
69 $606,876 $105,544 5 $3,135 Financial Administration
31 $367,406 $142,222 6 $11,321 Other and Unallocable
28 $323,969 $138,844 8 $26,385 Housing and Community Development (Local)
27 $313,620 $139,387 3 $5,459 Parks and Recreation
22 $196,157 $106,995 36 $19,037 Other Government Administration
8 $120,541 $180,812 8 $3,915 Judicial and Legal
3 $52,674 $210,696 0 $0
Totals for Government
188 $1,981,242 $126,462 66 $69,253
Cupertino government finances - Expenditure in 2017 (per resident):
Construction - Regular Highways: $2,497,000 ($43.16)
Parks and Recreation: $1,526,000 ($26.38)Current Operations - General - Other: $14,711,000 ($254.27)
Parks and Recreation: $13,311,000 ($230.07)Police Protection: $11,939,000 ($206.36)Central Staff Services: $11,218,000 ($193.90)Housing and Community Development: $7,825,000 ($135.25)Regular Highways: $5,163,000 ($89.24)Solid Waste Management: $2,988,000 ($51.65)Libraries: $1,159,000 ($20.03)Financial Administration: $820,000 ($14.17)General - Interest on Debt: $1,036,000 ($17.91)
Intergovernmental to Local - Other - Police Protection: $11,101,000 ($191.87)
Other - Transit Utilities: $810,000 ($14.00)Other - Libraries: $443,000 ($7.66)Other Capital Outlay - General - Other: $1,113,000 ($19.24)
Parks and Recreation: $62,000 ($1.07)Protective Inspection and Regulation - Other: $3,000 ($0.05)
Cupertino government finances - Revenue in 2017 (per resident):
Charges - Other: $27,576,000 ($476.63)
Parks and Recreation: $5,036,000 ($87.04)Solid Waste Management: $2,792,000 ($48.26)Federal Intergovernmental - Housing and Community Development: $683,000 ($11.81)
Local Intergovernmental - Other: $87,000 ($1.50)
Miscellaneous - General Revenue - Other: $2,005,000 ($34.66)
Interest Earnings: $839,000 ($14.50)Rents: $651,000 ($11.25)Fines and Forfeits: $603,000 ($10.42)State Intergovernmental - Other: $1,126,000 ($19.46)
Highways: $633,000 ($10.94)General Local Government Support: $57,000 ($0.99)Tax - General Sales and Gross Receipts: $26,932,000 ($465.50)
Property: $20,849,000 ($360.36)Public Utilities Sales: $6,492,000 ($112.21)Other Selective Sales: $6,024,000 ($104.12)Other License: $2,537,000 ($43.85)Other: $1,900,000 ($32.84)Occupation and Business License - Other: $729,000 ($12.60)
Cupertino government finances - Debt in 2017 (per resident):
Long Term Debt - Beginning Outstanding - Unspecified Public Purpose: $35,835,000 ($619.38)
Outstanding Unspecified Public Purpose: $33,700,000 ($582.48)Retired Unspecified Public Purpose: $2,135,000 ($36.90)
Cupertino government finances - Cash and Securities in 2017 (per resident):
Bond Funds - Cash and Securities: $25,439,000 ($439.70)
Other Funds - Cash and Securities: $110,125,000 ($1903.43)
Sinking Funds - Cash and Securities: $8,503,000 ($146.97)
5.37% of this county's 2021 resident taxpayers lived in other counties in 2020 ($152,550 average adjusted gross income )
Here:
5.37%California average:
5.19%
0.01% of residents moved from foreign countries ($93 average AGI )Santa Clara County:
0.01%California average:
0.03%
Top counties from which taxpayers relocated into this county between 2020 and 2021:
7.70% of this county's 2020 resident taxpayers moved to other counties in 2021 ($201,706 average adjusted gross income )
Here:
7.70%California average:
6.14%
0.01% of residents moved to foreign countries ($110 average AGI )Santa Clara County:
0.01%California average:
0.02%
Top counties to which taxpayers relocated from this county between 2020 and 2021:
Businesses in Cupertino, CA
Name Count Name Count
24 Hour Fitness 1 Motherhood Maternity 1 7-Eleven 2 New Balance 1 AT&T 1 Nike 6 Baja Fresh Mexican Grill 1 Outback 1 Burger King 1 Outback Steakhouse 1 CVS 1 Panda Express 1 Carl\s Jr. 1 Panera Bread 1 Chipotle 1 Payless 1 Chuck E. Cheese's 1 Pier 1 Imports 1 Cinnabon 1 Pizza Hut 1 Cold Stone Creamery 1 Quiznos 2 Curves 1 RadioShack 1 DHL 1 Rite Aid 1 Decora Cabinetry 1 SAS Shoes 1 Famous Footwear 1 Sears 2 FedEx 7 Staples 1 GNC 2 Starbucks 4 GameStop 1 Subway 7 Gymboree 1 T-Mobile 1 H&R Block 2 T.G.I. Driday's 1 Hilton 1 T.J.Maxx 1 JCPenney 1 Taco Bell 1 Jack In The Box 1 Target 1 Jamba Juice 1 UPS 5 Jones New York 4 Vans 2 KFC 1 Verizon Wireless 2 Lane Furniture 1 Victoria's Secret 1 Macy's 1 Walgreens 1 Marriott 1 Whole Foods Market 1 MasterBrand Cabinets 1 YMCA 1 McDonald's 1
Strongest AM radio stations in Cupertino:
KLOK (1170 AM; 50 kW; SAN JOSE, CA; Owner: ENTRAVISION HOLDINGS, LLC)
KGO (810 AM; 50 kW; SAN FRANCISCO, CA; Owner: KGO-AM RADIO, INC.)
KNBR (680 AM; 50 kW; SAN FRANCISCO, CA; Owner: KNBR LICO, INC.)
KYCY (1550 AM; 50 kW; SAN FRANCISCO, CA; Owner: INFINITY BROADCASTING OPERATIONS, INC.)
KTCT (1050 AM; 50 kW; SAN MATEO, CA; Owner: SUSQUEHANNA RADIO CORP.)
KFAX (1100 AM; 50 kW; SAN FRANCISCO, CA; Owner: GOLDEN GATE BROADCASTING CO, INC.)
KSJX (1500 AM; 10 kW; SAN JOSE, CA; Owner: MULTICULTURAL RADIO BROADCASTING INC)
KTRB (860 AM; 50 kW; MODESTO, CA; Owner: PAPPAS RADIO OF CALIFORNIA, A CALIFORNIA LIMITED PARTNERSHIP)
KZSF (1370 AM; 5 kW; SAN JOSE, CA; Owner: CARLOS A. DUHARTE)
KLIV (1590 AM; 5 kW; SAN JOSE, CA; Owner: EMPIRE BROADCASTING COMPANY)
KSFB (1220 AM; 5 kW; PALO ALTO, CA; Owner: SCA-PALO ALTO, LLC)
KIQI (1010 AM; 35 kW; SAN FRANCISCO, CA; Owner: RADIO UNICA OF SAN FRANCISCO LICENSE CORP.)
KVVN (1430 AM; 2 kW; SANTA CLARA, CA; Owner: ICBC BROADCAST HOLDINGS - CA, INC.)
Strongest FM radio stations in Cupertino:
KFJC (89.7 FM; LOS ALTOS, CA; Owner: FOOTHILL-DE ANZA COMM. COLLEGE DIST.)
KFFG (97.7 FM; LOS ALTOS, CA; Owner: KFFG LICO, INC.)
KBAA (94.5 FM; GILROY, CA; Owner: INFINITY RADIO OPERATIONS INC.)
KSQL (99.1 FM; SANTA CRUZ, CA; Owner: TMS LICENSE CALIFORNIA, INC)
KKUP (91.5 FM; CUPERTINO, CA; Owner: ASSURANCE SCIENCES FOUNDATION)
KBRG (100.3 FM; SAN JOSE, CA; Owner: ENTRAVISION HOLDINGS, LLC)
KUFX (98.5 FM; SAN JOSE, CA; Owner: CITICASTERS LICENSES, L.P.)
KRTY (95.3 FM; LOS GATOS, CA; Owner: KRTY, LTD.)
KTEE (93.7 FM; FELTON, CA; Owner: MAPLETON COMMUNICATIONS, L.L.C.)
KZBR-FM2 (95.7 FM; LIVERMORE, ETC., CA; Owner: BONNEVILLE HOLDING COMPANY)
KKSF-FM1 (103.7 FM; PLEASANTON, ETC., CA; Owner: AMFM RADIO LICENSES, L.L.C.)
KFRC-FM3 (99.7 FM; WALNUT CREEK, CA; Owner: INFINITY KFRC-FM, INC.)
KZBR-FM1 (95.7 FM; WALNUT CREEK, CA; Owner: BONNEVILLE HOLDING COMPANY)
KBLX-FM2 (102.9 FM; PLEASANTON, CA; Owner: ICBC BROADCAST HOLDINGS -CA, INC.)
KSOL-FM3 (98.9 FM; PLEASANTON, CA; Owner: TMS LICENSE CALIFORNIA, INC)
KISQ-FM3 (98.1 FM; CONCORD, CA; Owner: AMFM RADIO LICENSES, L.L.C.)
K216AX (91.1 FM; LAUREL, CA; Owner: CALVARY CHAPEL OF TWIN FALLS, INC.)
K238AC (95.5 FM; SALIDA, CA; Owner: FAMILY STATIONS, INC.)
KMEL-FM1 (106.1 FM; CONCORD, CA; Owner: AMFM RADIO LICENSES, L.L.C.)
K240CD (95.9 FM; SOQUEL, ETC., CA; Owner: CALVARY CHAPEL OF TWIN FALLS, INC.)
TV broadcast stations around Cupertino:
KQED (Channel 9; SAN FRANCISCO, CA; Owner: KQED, INC.)
KBIT-CA (Channel 28; SAN FRANCISCO, ETC., CA; Owner: POLAR BROADCASTING, INC.)
KICU-TV (Channel 36; SAN JOSE, CA; Owner: KTVU PARTNERSHIP)
KTEH (Channel 54; SAN JOSE, CA; Owner: KTEH FOUNDATION)
KDTV (Channel 14; SAN FRANCISCO, CA; Owner: KDTV LICENSE PARTNERSHIP, G.P.)
KSTS (Channel 48; SAN JOSE, CA; Owner: TELEMUNDO OF NORTHERN CALIFORNIA LICENSE CORP.)
KGO-TV (Channel 7; SAN FRANCISCO, CA; Owner: KGO TELEVISION, INC.)
KPIX-TV (Channel 5; SAN FRANCISCO, CA; Owner: CBS BROADCASTING INC.)
KTVU (Channel 2; OAKLAND, CA; Owner: KTVU PARTNERSHIP)
KNTV (Channel 11; SAN JOSE, CA; Owner: KNTV LICENSE, INC.)
KRON-TV (Channel 4; SAN FRANCISCO, CA; Owner: YOUNG BROADCASTING OF SAN FRANCISCO, INC.)
KMTP-TV (Channel 32; SAN FRANCISCO, CA; Owner: MINORITY TELEVISION PROJECT)
KBHK-TV (Channel 44; SAN FRANCISCO, CA; Owner: VIACOM TELEVISION STATIONS GROUP OF SAN FRANCISCO INC.)
KBWB (Channel 20; SAN FRANCISCO, CA; Owner: KBWB LICENSE, INC.)
KFSF (Channel 66; VALLEJO, CA; Owner: TELEFUTURA SAN FRANCISCO LLC)
KCSM-TV (Channel 60; SAN MATEO, CA; Owner: SAN MATEO COUNTY COMMUNITY COLLEGE DISTRICT)
KKPX (Channel 65; SAN JOSE, CA; Owner: PAXSON SAN JOSE LICENSE, INC.)
KCNS (Channel 38; SAN FRANCISCO, CA; Owner: WRAY, INC.)
KAXT-CA (Channel 22; SANTA CLARA-SAN JOSE, CA; Owner: LINDA K. TRUMBLY)
National Bridge Inventory (NBI) Statistics 54 Number of bridges505ft / 154m Total length3,373,155 Total average daily traffic92,174 Total average daily truck traffic
New bridges - historical statistics
1 1910-1919 1 1920-1929 2 1930-1939 22 1960-1969 9 1970-1979 12 1990-1999 4 2000-2009 3 2010-2019
See full National Bridge Inventory statistics for Cupertino, CA
Home Mortgage Disclosure Act Aggregated Statistics For Year 2009(Based on 5 full and 6 partial tracts) A) FHA, FSA/RHS & VA B) Conventional C) Refinancings D) Home Improvement Loans E) Loans on Dwellings For 5+ Families F) Non-occupant Loans on G) Loans On Manufactured Number Average Value Number Average Value Number Average Value Number Average Value Number Average Value Number Average Value Number Average Value
LOANS ORIGINATED 11 $535,347 348 $606,455 3,241 $449,087 87 $338,952 2 $918,500 105 $401,297 0 $0 APPLICATIONS APPROVED, NOT ACCEPTED 0 $0 43 $584,269 512 $471,361 8 $413,906 0 $0 14 $327,207 0 $0 APPLICATIONS DENIED 4 $609,085 70 $582,066 532 $530,979 15 $319,493 2 $1,450,000 50 $422,405 1 $9,200 APPLICATIONS WITHDRAWN 6 $520,852 54 $601,081 393 $497,087 19 $283,628 1 $1,141,000 23 $328,783 0 $0 FILES CLOSED FOR INCOMPLETENESS 1 $589,000 11 $645,525 123 $515,629 8 $125,492 1 $10,346,630 5 $432,800 0 $0
Aggregated Statistics For Year 2008(Based on 5 full and 6 partial tracts) A) FHA, FSA/RHS & VA B) Conventional C) Refinancings D) Home Improvement Loans E) Loans on Dwellings For 5+ Families F) Non-occupant Loans on G) Loans On Manufactured Number Average Value Number Average Value Number Average Value Number Average Value Number Average Value Number Average Value Number Average Value
LOANS ORIGINATED 0 $0 426 $623,671 1,359 $536,339 42 $358,206 5 $8,094,242 72 $405,736 1 $63,000 APPLICATIONS APPROVED, NOT ACCEPTED 1 $339,770 139 $686,539 293 $538,928 17 $327,179 0 $0 21 $470,610 2 $146,500 APPLICATIONS DENIED 0 $0 94 $673,952 359 $617,719 26 $338,294 1 $492,840 33 $441,015 0 $0 APPLICATIONS WITHDRAWN 0 $0 105 $668,206 188 $551,624 16 $338,511 0 $0 14 $357,912 0 $0 FILES CLOSED FOR INCOMPLETENESS 0 $0 17 $655,793 67 $531,305 10 $406,858 0 $0 8 $685,630 0 $0
Aggregated Statistics For Year 2007(Based on 5 full and 6 partial tracts) B) Conventional C) Refinancings D) Home Improvement Loans E) Loans on Dwellings For 5+ Families F) Non-occupant Loans on G) Loans On Manufactured Number Average Value Number Average Value Number Average Value Number Average Value Number Average Value Number Average Value
LOANS ORIGINATED 800 $599,259 1,409 $574,769 101 $404,472 4 $2,234,728 164 $435,844 1 $114,960 APPLICATIONS APPROVED, NOT ACCEPTED 199 $637,774 268 $557,656 15 $423,529 1 $830,000 31 $494,167 1 $147,150 APPLICATIONS DENIED 178 $632,356 270 $679,345 25 $370,941 1 $599,050 45 $447,859 4 $132,042 APPLICATIONS WITHDRAWN 93 $609,821 110 $631,941 10 $335,176 1 $1,000,000 16 $590,387 0 $0 FILES CLOSED FOR INCOMPLETENESS 27 $502,576 57 $576,567 5 $433,800 0 $0 9 $364,810 0 $0
Aggregated Statistics For Year 2006(Based on 5 full and 6 partial tracts) B) Conventional C) Refinancings D) Home Improvement Loans E) Loans on Dwellings For 5+ Families F) Non-occupant Loans on G) Loans On Manufactured Number Average Value Number Average Value Number Average Value Number Average Value Number Average Value Number Average Value
LOANS ORIGINATED 682 $604,846 1,142 $535,001 95 $389,242 2 $16,389,500 115 $474,666 1 $27,000 APPLICATIONS APPROVED, NOT ACCEPTED 164 $601,558 185 $522,027 18 $446,321 0 $0 22 $465,525 1 $116,000 APPLICATIONS DENIED 149 $650,871 228 $588,450 24 $507,993 1 $588,360 34 $506,056 2 $231,645 APPLICATIONS WITHDRAWN 85 $608,177 155 $530,128 17 $488,429 0 $0 21 $519,155 0 $0 FILES CLOSED FOR INCOMPLETENESS 19 $627,470 36 $449,508 6 $138,690 0 $0 3 $483,690 0 $0
Aggregated Statistics For Year 2005(Based on 5 full and 6 partial tracts) B) Conventional C) Refinancings D) Home Improvement Loans E) Loans on Dwellings For 5+ Families F) Non-occupant Loans on G) Loans On Manufactured Number Average Value Number Average Value Number Average Value Number Average Value Number Average Value Number Average Value
LOANS ORIGINATED 809 $610,268 1,219 $511,934 85 $412,116 4 $17,499,120 178 $486,787 0 $0 APPLICATIONS APPROVED, NOT ACCEPTED 160 $584,666 209 $519,733 13 $479,017 0 $0 23 $481,527 3 $67,837 APPLICATIONS DENIED 187 $627,543 233 $555,715 24 $395,002 0 $0 55 $573,984 2 $65,380 APPLICATIONS WITHDRAWN 82 $552,009 178 $513,390 18 $436,494 1 $716,730 22 $434,411 0 $0 FILES CLOSED FOR INCOMPLETENESS 18 $552,461 45 $507,766 3 $336,047 0 $0 0 $0 0 $0
Aggregated Statistics For Year 2004(Based on 5 full and 6 partial tracts) B) Conventional C) Refinancings D) Home Improvement Loans E) Loans on Dwellings For 5+ Families F) Non-occupant Loans on G) Loans On Manufactured Number Average Value Number Average Value Number Average Value Number Average Value Number Average Value Number Average Value
LOANS ORIGINATED 942 $527,914 2,541 $454,313 78 $347,158 2 $842,500 209 $352,251 1 $99,000 APPLICATIONS APPROVED, NOT ACCEPTED 201 $518,868 510 $435,725 15 $204,471 0 $0 38 $401,688 0 $0 APPLICATIONS DENIED 176 $513,320 345 $483,801 24 $317,563 1 $950,000 38 $373,178 4 $62,642 APPLICATIONS WITHDRAWN 86 $541,913 296 $434,736 17 $276,196 1 $490,550 19 $461,341 0 $0 FILES CLOSED FOR INCOMPLETENESS 32 $546,345 66 $492,561 3 $238,037 0 $0 6 $351,915 0 $0
Aggregated Statistics For Year 2003(Based on 5 full and 6 partial tracts) B) Conventional C) Refinancings D) Home Improvement Loans E) Loans on Dwellings For 5+ Families F) Non-occupant Loans on Number Average Value Number Average Value Number Average Value Number Average Value Number Average Value
LOANS ORIGINATED 777 $472,308 5,948 $381,269 20 $128,672 4 $741,250 359 $303,245 APPLICATIONS APPROVED, NOT ACCEPTED 124 $479,158 1,108 $407,354 7 $103,444 0 $0 59 $315,712 APPLICATIONS DENIED 98 $480,625 563 $456,492 4 $15,485 0 $0 55 $354,799 APPLICATIONS WITHDRAWN 112 $446,532 609 $385,121 3 $48,493 0 $0 38 $314,080 FILES CLOSED FOR INCOMPLETENESS 20 $547,870 203 $428,580 1 $125,800 1 $3,731,520 11 $359,099
Aggregated Statistics For Year 2002(Based on 3 full and 4 partial tracts) B) Conventional C) Refinancings D) Home Improvement Loans E) Loans on Dwellings For 5+ Families F) Non-occupant Loans on Number Average Value Number Average Value Number Average Value Number Average Value Number Average Value
LOANS ORIGINATED 438 $486,058 3,701 $398,684 16 $159,964 1 $1,325,000 157 $296,141 APPLICATIONS APPROVED, NOT ACCEPTED 56 $450,326 659 $414,816 6 $174,597 0 $0 31 $305,994 APPLICATIONS DENIED 56 $438,576 253 $452,808 9 $95,658 0 $0 15 $413,032 APPLICATIONS WITHDRAWN 48 $533,533 294 $386,210 7 $158,816 0 $0 19 $300,914 FILES CLOSED FOR INCOMPLETENESS 18 $517,193 112 $432,212 1 $106,970 0 $0 10 $319,900
Aggregated Statistics For Year 2001(Based on 3 full and 4 partial tracts) B) Conventional C) Refinancings D) Home Improvement Loans E) Loans on Dwellings For 5+ Families F) Non-occupant Loans on Number Average Value Number Average Value Number Average Value Number Average Value Number Average Value
LOANS ORIGINATED 333 $477,708 2,006 $420,172 67 $95,302 2 $7,313,280 85 $354,646 APPLICATIONS APPROVED, NOT ACCEPTED 51 $451,198 295 $409,789 11 $131,394 1 $91,970 10 $243,201 APPLICATIONS DENIED 41 $403,106 183 $466,614 27 $111,687 0 $0 11 $252,868 APPLICATIONS WITHDRAWN 37 $457,234 217 $375,280 11 $81,574 0 $0 13 $331,900 FILES CLOSED FOR INCOMPLETENESS 11 $432,078 75 $403,516 1 $13,800 0 $0 8 $241,105
Aggregated Statistics For Year 2000(Based on 3 full and 4 partial tracts) B) Conventional C) Refinancings D) Home Improvement Loans E) Loans on Dwellings For 5+ Families F) Non-occupant Loans on Number Average Value Number Average Value Number Average Value Number Average Value Number Average Value
LOANS ORIGINATED 505 $508,234 392 $374,676 86 $74,953 1 $462,280 73 $336,065 APPLICATIONS APPROVED, NOT ACCEPTED 75 $468,867 52 $351,919 19 $97,309 0 $0 7 $320,856 APPLICATIONS DENIED 69 $507,154 99 $402,609 31 $131,734 0 $0 15 $395,569 APPLICATIONS WITHDRAWN 57 $509,898 78 $314,821 11 $90,225 0 $0 4 $391,268 FILES CLOSED FOR INCOMPLETENESS 15 $499,843 63 $292,441 3 $191,923 0 $0 4 $388,340
Aggregated Statistics For Year 1999(Based on 3 full and 7 partial tracts) A) FHA, FSA/RHS & VA B) Conventional C) Refinancings D) Home Improvement Loans E) Loans on Dwellings For 5+ Families F) Non-occupant Loans on Number Average Value Number Average Value Number Average Value Number Average Value Number Average Value Number Average Value
LOANS ORIGINATED 0 $0 969 $369,260 1,608 $328,853 99 $60,528 5 $3,029,232 118 $247,953 APPLICATIONS APPROVED, NOT ACCEPTED 0 $0 162 $389,860 302 $306,623 20 $54,002 0 $0 20 $199,052 APPLICATIONS DENIED 1 $615,260 108 $369,616 217 $310,969 21 $41,052 1 $248,430 18 $296,597 APPLICATIONS WITHDRAWN 0 $0 116 $407,112 199 $280,541 12 $62,800 1 $307,520 12 $224,035 FILES CLOSED FOR INCOMPLETENESS 0 $0 27 $385,613 74 $281,779 2 $219,350 0 $0 4 $242,635
Detailed mortgage data for all 11 tracts in Cupertino, CA
Private Mortgage Insurance Companies Aggregated Statistics For Year 2009(Based on 3 full and 4 partial tracts) A) Conventional B) Refinancings Number Average Value Number Average Value
LOANS ORIGINATED 8 $468,652 3 $269,143 APPLICATIONS APPROVED, NOT ACCEPTED 6 $533,013 1 $1,470,000 APPLICATIONS DENIED 4 $590,022 2 $482,500 APPLICATIONS WITHDRAWN 1 $226,000 0 $0 FILES CLOSED FOR INCOMPLETENESS 1 $585,000 0 $0
Aggregated Statistics For Year 2008(Based on 3 full and 5 partial tracts) A) Conventional B) Refinancings C) Non-occupant Loans on Number Average Value Number Average Value Number Average Value
LOANS ORIGINATED 18 $488,462 2 $611,400 0 $0 APPLICATIONS APPROVED, NOT ACCEPTED 5 $678,502 2 $692,795 0 $0 APPLICATIONS DENIED 10 $721,096 0 $0 1 $585,000 APPLICATIONS WITHDRAWN 3 $598,073 0 $0 0 $0 FILES CLOSED FOR INCOMPLETENESS 1 $553,000 1 $657,590 0 $0
Aggregated Statistics For Year 2007(Based on 2 full and 2 partial tracts) A) Conventional Number Average Value
LOANS ORIGINATED 2 $192,000 APPLICATIONS APPROVED, NOT ACCEPTED 1 $978,130 APPLICATIONS DENIED 0 $0 APPLICATIONS WITHDRAWN 0 $0 FILES CLOSED FOR INCOMPLETENESS 0 $0
Aggregated Statistics For Year 2006(Based on 1 full and 1 partial tracts) A) Conventional B) Refinancings Number Average Value Number Average Value
LOANS ORIGINATED 2 $618,960 1 $594,000 APPLICATIONS APPROVED, NOT ACCEPTED 1 $516,000 0 $0 APPLICATIONS DENIED 0 $0 0 $0 APPLICATIONS WITHDRAWN 0 $0 0 $0 FILES CLOSED FOR INCOMPLETENESS 0 $0 0 $0
Aggregated Statistics For Year 2005(Based on 2 full and 2 partial tracts) A) Conventional B) Refinancings Number Average Value Number Average Value
LOANS ORIGINATED 2 $376,950 1 $447,800 APPLICATIONS APPROVED, NOT ACCEPTED 0 $0 3 $418,280 APPLICATIONS DENIED 0 $0 1 $447,800 APPLICATIONS WITHDRAWN 0 $0 0 $0 FILES CLOSED FOR INCOMPLETENESS 0 $0 0 $0
Aggregated Statistics For Year 2004(Based on 4 full and 3 partial tracts) A) Conventional B) Refinancings C) Non-occupant Loans on Number Average Value Number Average Value Number Average Value
LOANS ORIGINATED 3 $451,643 2 $542,325 0 $0 APPLICATIONS APPROVED, NOT ACCEPTED 1 $273,690 3 $421,253 0 $0 APPLICATIONS DENIED 0 $0 0 $0 0 $0 APPLICATIONS WITHDRAWN 1 $405,590 1 $294,150 2 $349,870 FILES CLOSED FOR INCOMPLETENESS 0 $0 0 $0 0 $0
Aggregated Statistics For Year 2003(Based on 2 full and 4 partial tracts) A) Conventional B) Refinancings Number Average Value Number Average Value
LOANS ORIGINATED 5 $389,370 4 $344,792 APPLICATIONS APPROVED, NOT ACCEPTED 0 $0 3 $693,110 APPLICATIONS DENIED 0 $0 0 $0 APPLICATIONS WITHDRAWN 0 $0 0 $0 FILES CLOSED FOR INCOMPLETENESS 0 $0 0 $0
Aggregated Statistics For Year 2002(Based on 2 full and 4 partial tracts) A) Conventional B) Refinancings C) Non-occupant Loans on Number Average Value Number Average Value Number Average Value
LOANS ORIGINATED 7 $448,930 2 $230,600 0 $0 APPLICATIONS APPROVED, NOT ACCEPTED 1 $122,000 4 $401,888 0 $0 APPLICATIONS DENIED 1 $386,000 1 $553,000 0 $0 APPLICATIONS WITHDRAWN 1 $333,000 2 $494,435 1 $413,870 FILES CLOSED FOR INCOMPLETENESS 0 $0 0 $0 0 $0
Aggregated Statistics For Year 2001(Based on 2 full and 2 partial tracts) A) Conventional B) Refinancings C) Non-occupant Loans on Number Average Value Number Average Value Number Average Value
LOANS ORIGINATED 3 $383,013 1 $404,670 0 $0 APPLICATIONS APPROVED, NOT ACCEPTED 2 $387,195 1 $490,000 0 $0 APPLICATIONS DENIED 0 $0 1 $252,920 1 $252,920 APPLICATIONS WITHDRAWN 0 $0 0 $0 0 $0 FILES CLOSED FOR INCOMPLETENESS 0 $0 0 $0 0 $0
Aggregated Statistics For Year 2000(Based on 2 full and 4 partial tracts) A) Conventional B) Refinancings C) Non-occupant Loans on Number Average Value Number Average Value Number Average Value
LOANS ORIGINATED 15 $373,446 4 $326,032 2 $349,025 APPLICATIONS APPROVED, NOT ACCEPTED 2 $202,235 0 $0 0 $0 APPLICATIONS DENIED 2 $371,925 2 $461,740 0 $0 APPLICATIONS WITHDRAWN 0 $0 0 $0 0 $0 FILES CLOSED FOR INCOMPLETENESS 0 $0 0 $0 0 $0
Aggregated Statistics For Year 1999(Based on 2 full and 7 partial tracts) A) Conventional B) Refinancings C) Non-occupant Loans on Number Average Value Number Average Value Number Average Value
LOANS ORIGINATED 36 $352,222 3 $326,467 0 $0 APPLICATIONS APPROVED, NOT ACCEPTED 6 $356,627 0 $0 0 $0 APPLICATIONS DENIED 2 $329,965 1 $332,040 1 $268,850 APPLICATIONS WITHDRAWN 0 $0 1 $373,840 0 $0 FILES CLOSED FOR INCOMPLETENESS 0 $0 0 $0 0 $0
Fire-safe hotels and motels in Cupertino, California:
Suiteamerica At Arioso, 19608 Prunridge Ave, Cupertino, California 95014 Phone: (408) 873-9090
Cypress Hotel, 10050 S De Anza Blvd, Cupertino, California 95014 Phone: (408) 253-8900, Fax: (408) 342-4854
Juniper Hotel Cupertino, 10050 S De Anza Blvd, Cupertino, California 95014 Phone: (408) 253-8900, Fax: (408) 342-4854
Residence Inn San Jose Cupertino, 19429 Stevens Creek ,Blvd ,Cupertino CA 95014, Cupertino, California 95014 Phone: (408) 777-0188, Fax: (408) 777-0189
Hyatt House Cupertino, 10380 Perimeter Rd, Cupertino, California 95014 Phone: (669) 220-3800, Fax: (669) 220-3801
All 5 fire-safe hotels and motels in Cupertino, California
Most common first names in Cupertino, CA among deceased individuals Name Count Lived (average)
John 161 76.9 years Robert 158 71.7 years Mary 158 81.2 years William 146 75.2 years James 102 75.6 years Charles 102 76.6 years Helen 102 79.6 years Joseph 91 75.5 years Margaret 87 80.4 years George 86 77.6 years
Most common last names in Cupertino, CA among deceased individuals Last name Count Lived (average)
Johnson 57 78.2 years Smith 46 76.0 years Miller 40 77.3 years Nelson 33 82.1 years Brown 30 74.8 years Williams 27 76.6 years Lee 26 75.3 years Jones 25 71.5 years Chang 24 80.6 years Moore 22 70.9 years
Cupertino compared to California state average:
Median household income above state average. Median house value significantly above state average. Unemployed percentage significantly below state average. Black race population percentage significantly below state average. Hispanic race population percentage significantly below state average. Median age above state average. Foreign-born population percentage significantly above state average. Length of stay since moving in significantly above state average. Percentage of population with a bachelor's degree or higher significantly above state average.
#1 on the list of "Top 101 cities with largest percentage of males in occupations: architecture and engineering occupations (population 50,000+)"
#1 on the list of "Top 101 cities with largest percentage of females in occupations: architecture and engineering occupations (population 50,000+)"
#3 on the list of "Top 101 cities with largest percentage of females in occupations: computer and mathematical occupations (population 50,000+)"
#3 on the list of "Top 101 cities with the most people having Master's or Doctorate degrees (population 50,000+)"
#3 on the list of "Top 101 cities with largest percentage of males in industries: manufacturing (population 50,000+)"
#4 on the list of "Top 101 cities with the smallest percentage of unmarried partner households (population 50,000+)"
#4 on the list of "Top 100 cities with highest median household income (pop. 50,000+)"
#4 on the list of "Top 101 cities with largest percentage of males in occupations: computer and mathematical occupations (population 50,000+)"
#5 on the list of "Top 100 best educated cities (highest percentage of bachelor degree holding residents) (pop. 50,000+)"
#7 on the list of "Top 100 cities with highest median house value"
#7 on the list of "Top 101 cities with largest percentage of females in industries: professional, scientific, and technical services (population 50,000+)"
#7 on the list of "Top 101 cities with largest percentage of males in industries: professional, scientific, and technical services (population 50,000+)"
#11 on the list of "Top 101 cities with the least people below the poverty level (population 50,000+)"
#12 on the list of "Top 101 cities with the most residents born in Asia (population 500+)"
#13 on the list of "Top 101 cities with the most residents born in Taiwan (population 500+)"
#14 on the list of "Top 101 cities with the most residents born in China (population 500+)"
#14 on the list of "Top 101 cities with the lowest percentage of single-parent households, population 50,000+"
#15 on the list of "Top 100 cities with highest percentage of foreign-born residents (pop. 50,000+)"
#15 on the list of "Top 101 cities with largest percentage of females in industries: manufacturing (population 50,000+)"
#16 on the list of "Top 101 cities with largest percentage of females in occupations: business and financial operations occupations (population 50,000+)"
#6 (94024) on the list of "Top 101 zip codes with the largest percentage of taxpayers reporting taxable interest in 2012 (pop 5,000+)"
#7 (94024) on the list of "Top 101 zip codes with the largest percentage of taxpayers reporting net capital gain/loss in 2012 (pop 5,000+)"
#20 (94024) on the list of "Top 101 zip codes with the highest average reported salary/wage in 2012 (pop 5,000+)"
#37 (94024) on the list of "Top 101 zip codes with the largest percentage of taxpayers using charity contributions deductions in 2012 (pop 5,000+)"
#43 (94024) on the list of "Top 101 zip codes with the highest 2012 average reported profit/loss from business (pop 5,000+)"
#61 (94024) on the list of "Top 101 zip codes with the highest 2012 average Adjusted Gross Income (AGI) for individuals (pop 5,000+)"
#5 on the list of "Top 101 counties with the highest percentage of residents that visited a dentist within the past year"
#9 on the list of "Top 101 counties with the lowest percentage of residents that smoked 100+ cigarettes in their lives"
#16 on the list of "Top 101 counties with the most Other adherents"
#16 on the list of "Top 101 counties with the most Catholic adherents"
#17 on the list of "Top 101 counties with the highest percentage of residents that drank alcohol in the past 30 days"
Top Patent Applicants
Apple Inc. (384)
Shih Chang Chang (167)
Roy E. Scheuerlein (127)
John Z. Zhong (122)
Vishal Sarin (121)
Dmitry Lubomirsky (120)
Michael F. Tomasco (118)
Masaaki Higashitani (113)
Robert W. Schlub (111)
Augustin J. Farrugia (111)
Total of 23844 patent applications in 2008-2024.

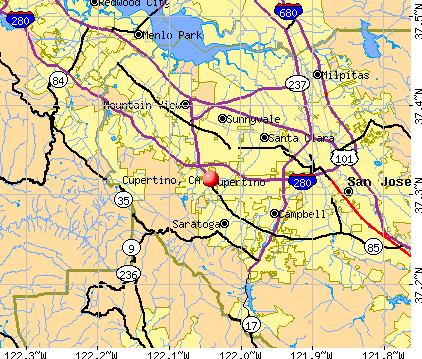


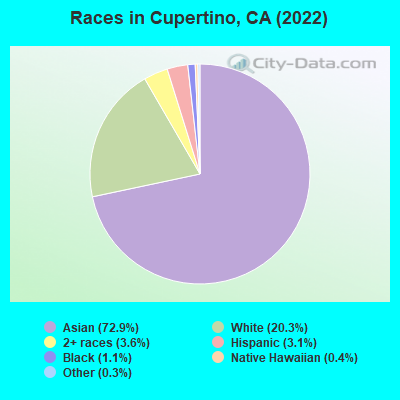
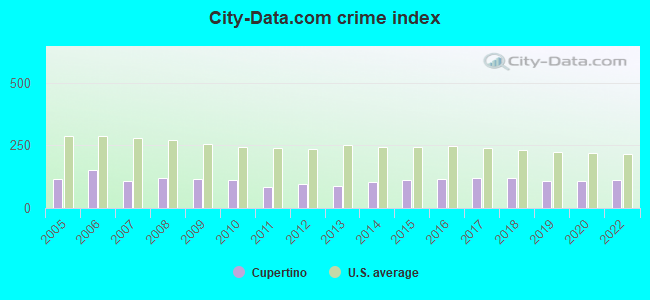
 Recent articles from our blog. Our writers, many of them Ph.D. graduates or candidates, create easy-to-read articles on a wide variety of topics.


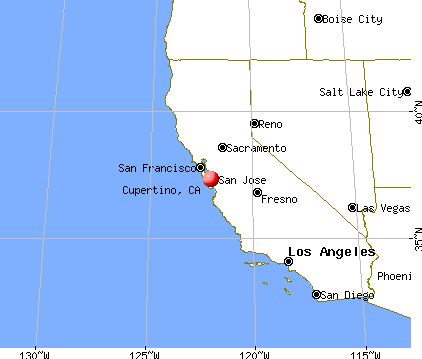
 (9.4 miles
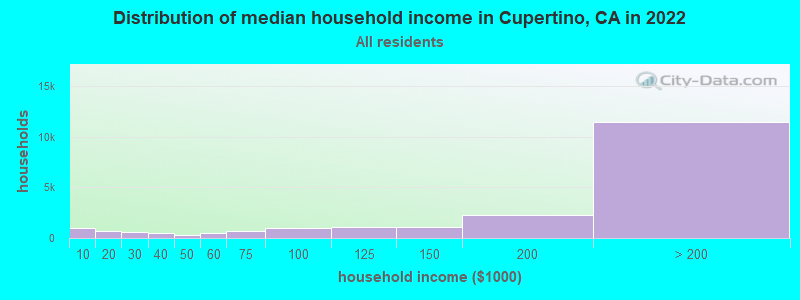
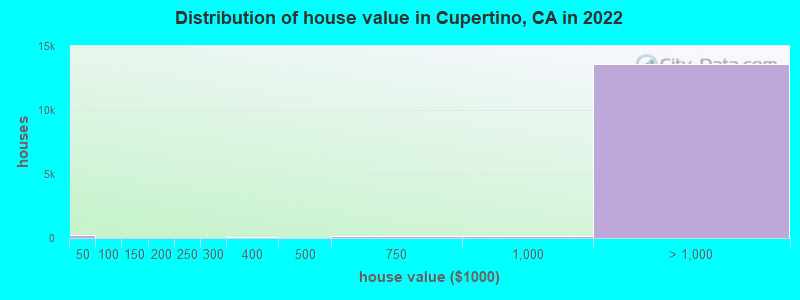

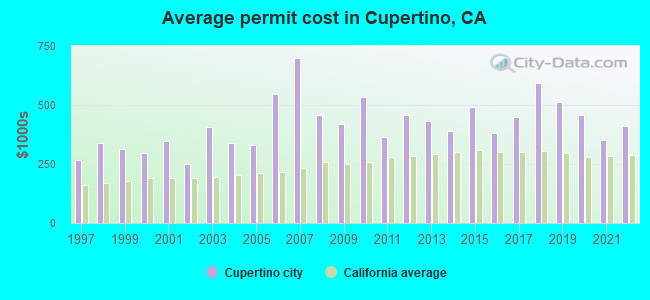
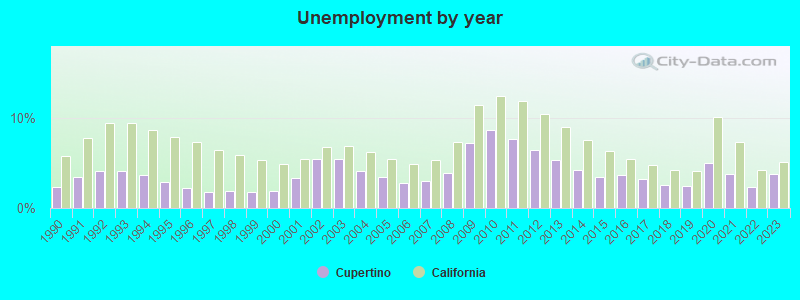

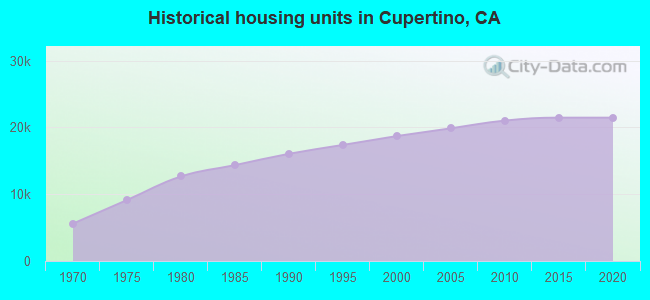
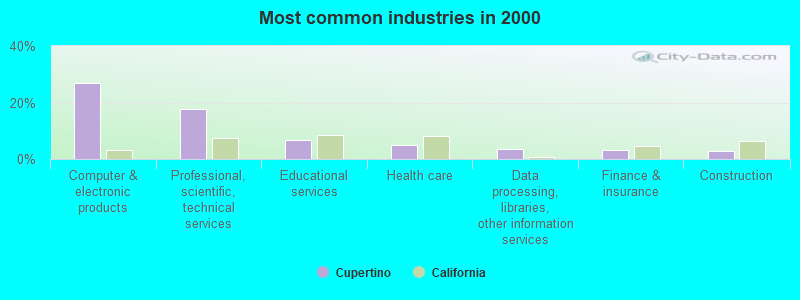
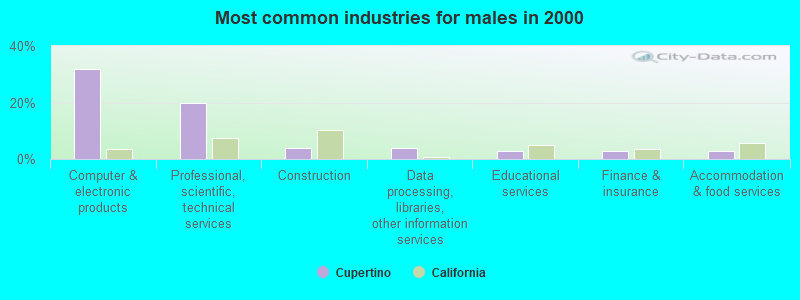
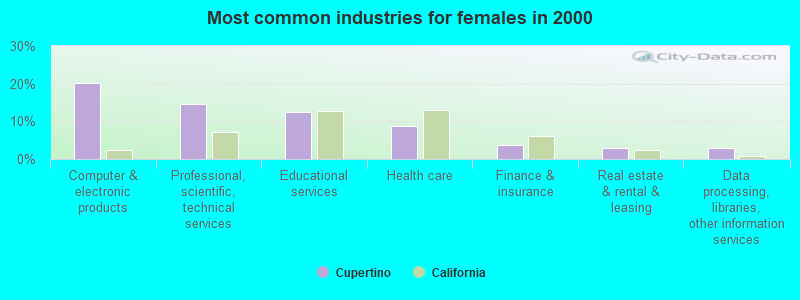
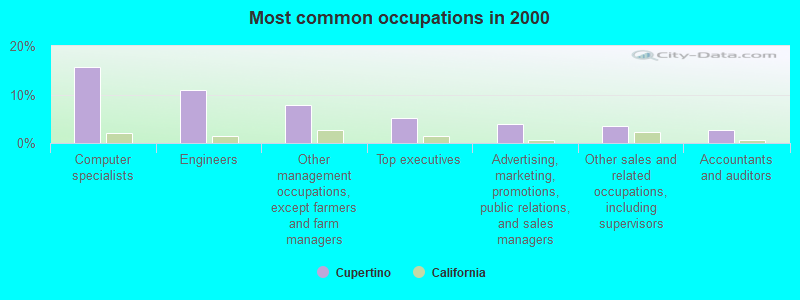
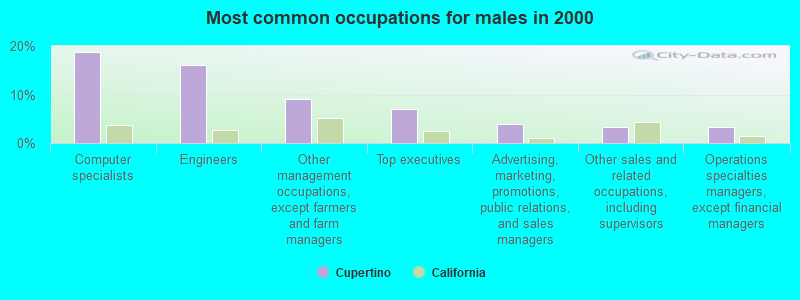
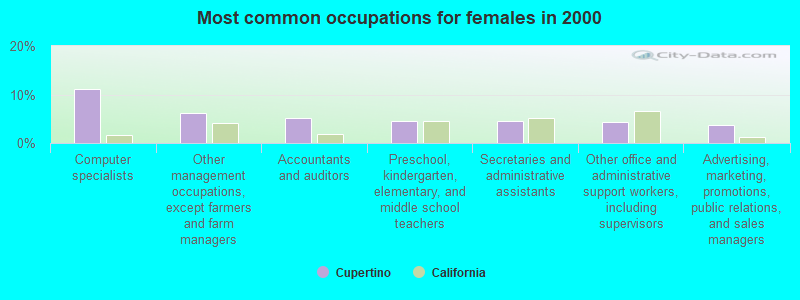


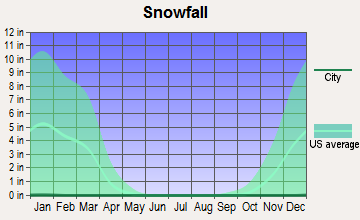
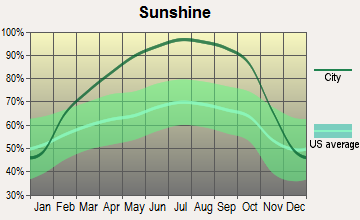
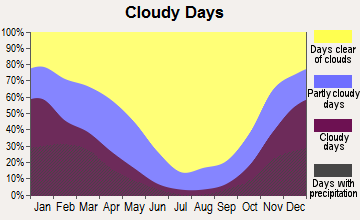
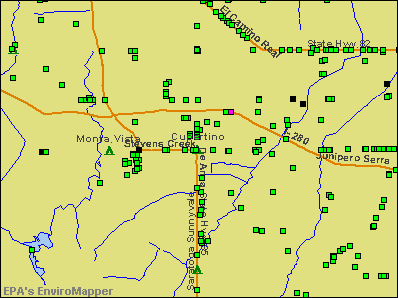

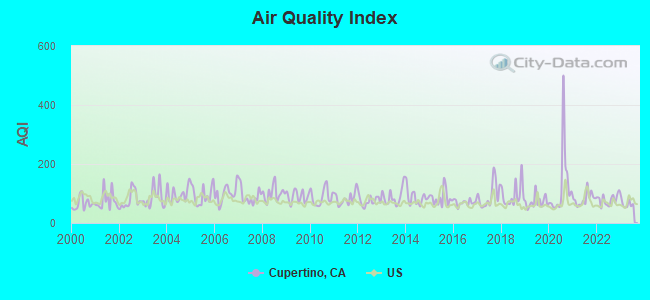
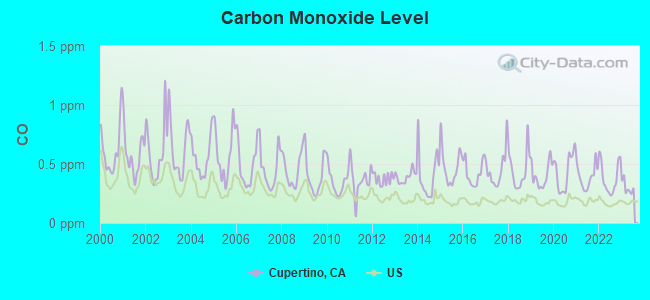
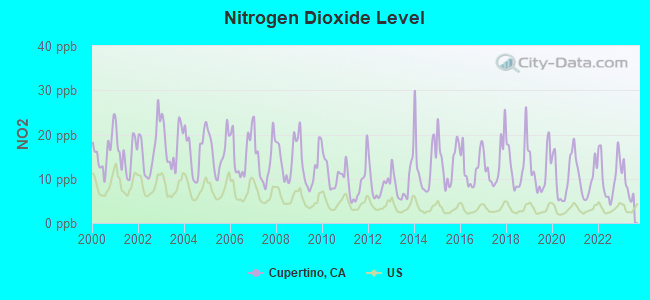
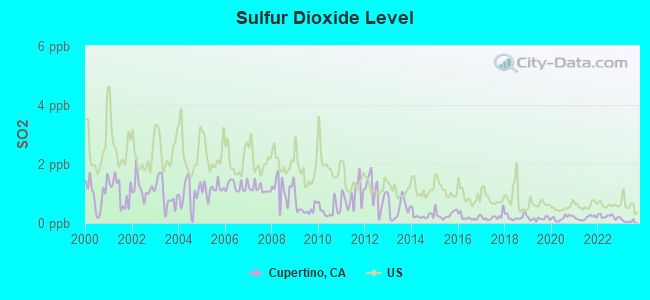
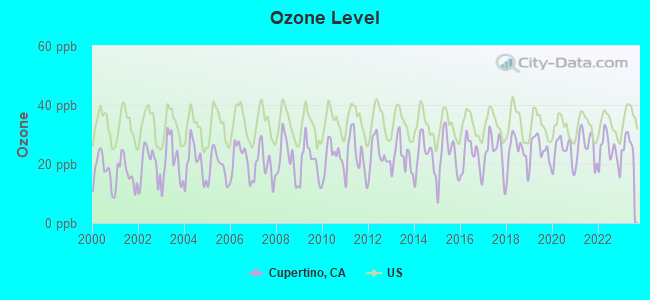
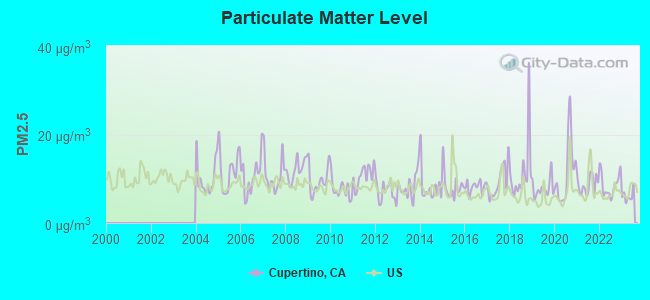
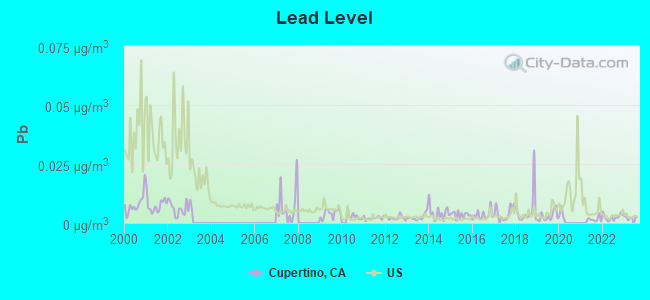
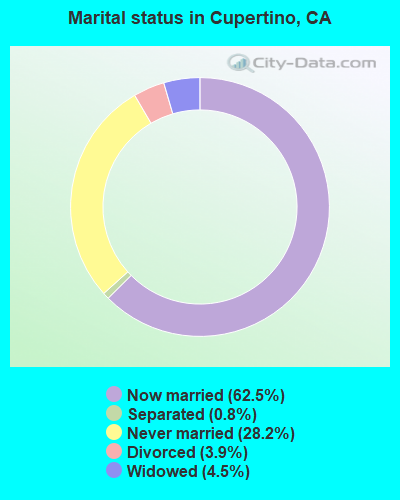
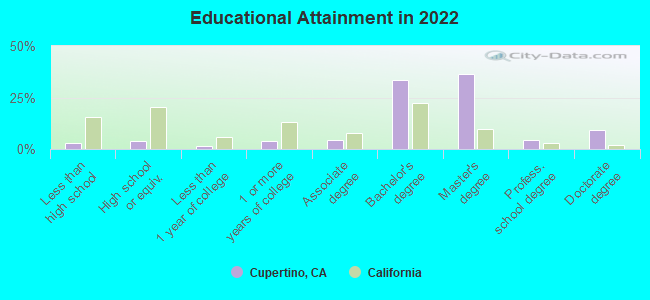
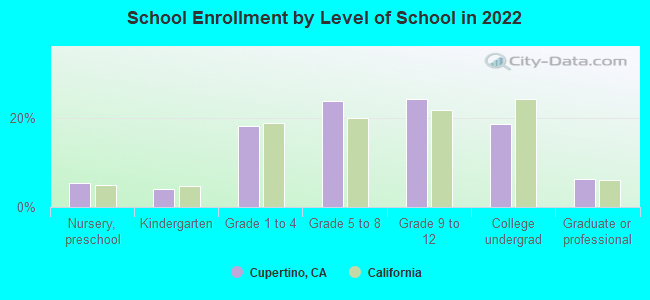
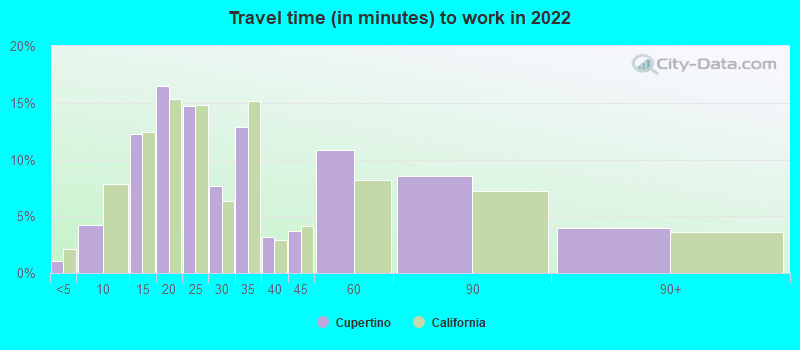

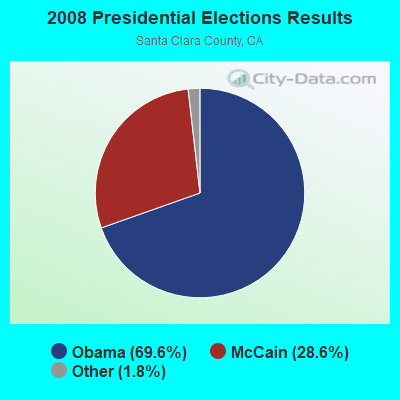
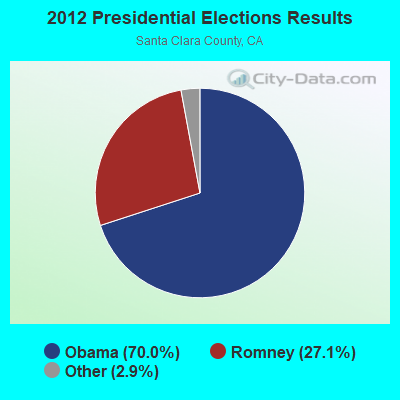
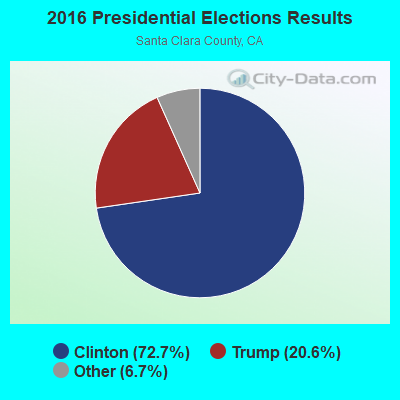
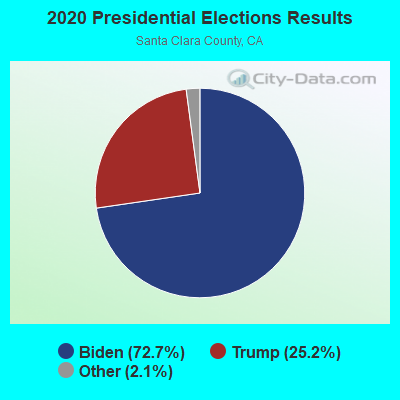
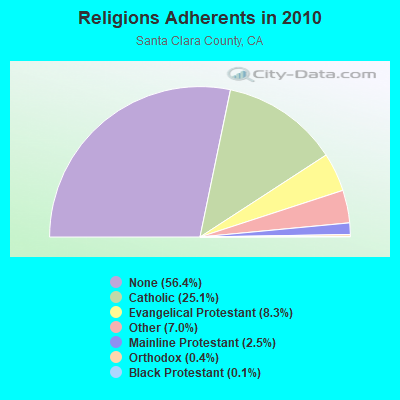
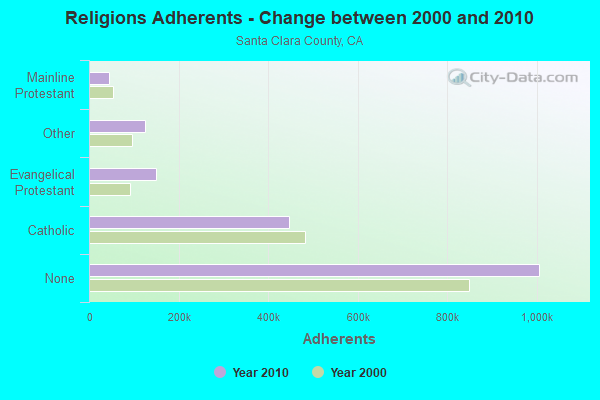
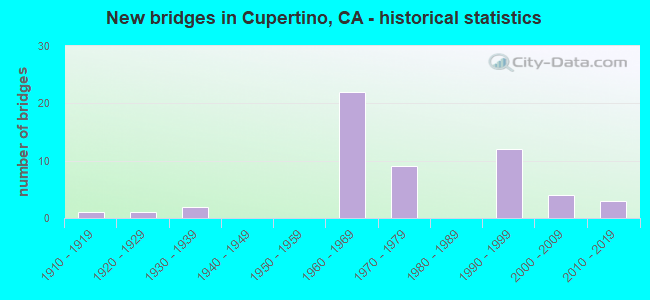
 According to the data from the years 2005 - 2018 the average number of fires per year is 64. The highest number of fires - 89 took place in 2017, and the least - 41 in 2012. The data has a decreasing trend.
 When looking into fire subcategories, the most incidents belonged to: Outside Fires (38.6%), and Structure Fires (37.5%).