Edinburgh, Indiana Submit your own pictures of this town and show them to the world
OSM Map
General Map
Google Map
MSN Map
OSM Map
General Map
Google Map
MSN Map
OSM Map
General Map
Google Map
MSN Map
OSM Map
General Map
Google Map
MSN Map
Please wait while loading the map...
Population in 2022: 4,400 (96% urban, 4% rural). Population change since 2000: -2.3%Males: 2,193 Females: 2,207
March 2022 cost of living index in Edinburgh: 86.6 (less than average, U.S. average is 100) Percentage of residents living in poverty in 2022: 13.3%
Profiles of local businesses
Business Search - 14 Million verified businesses
Data:
Median household income ($)
Median household income (% change since 2000)
Household income diversity
Ratio of average income to average house value (%)
Ratio of average income to average rent
Median household income ($) - White
Median household income ($) - Black or African American
Median household income ($) - Asian
Median household income ($) - Hispanic or Latino
Median household income ($) - American Indian and Alaska Native
Median household income ($) - Multirace
Median household income ($) - Other Race
Median household income for houses/condos with a mortgage ($)
Median household income for apartments without a mortgage ($)
Races - White alone (%)
Races - White alone (% change since 2000)
Races - Black alone (%)
Races - Black alone (% change since 2000)
Races - American Indian alone (%)
Races - American Indian alone (% change since 2000)
Races - Asian alone (%)
Races - Asian alone (% change since 2000)
Races - Hispanic (%)
Races - Hispanic (% change since 2000)
Races - Native Hawaiian and Other Pacific Islander alone (%)
Races - Native Hawaiian and Other Pacific Islander alone (% change since 2000)
Races - Two or more races (%)
Races - Two or more races (% change since 2000)
Races - Other race alone (%)
Races - Other race alone (% change since 2000)
Racial diversity
Unemployment (%)
Unemployment (% change since 2000)
Unemployment (%) - White
Unemployment (%) - Black or African American
Unemployment (%) - Asian
Unemployment (%) - Hispanic or Latino
Unemployment (%) - American Indian and Alaska Native
Unemployment (%) - Multirace
Unemployment (%) - Other Race
Population density (people per square mile)
Population - Males (%)
Population - Females (%)
Population - Males (%) - White
Population - Males (%) - Black or African American
Population - Males (%) - Asian
Population - Males (%) - Hispanic or Latino
Population - Males (%) - American Indian and Alaska Native
Population - Males (%) - Multirace
Population - Males (%) - Other Race
Population - Females (%) - White
Population - Females (%) - Black or African American
Population - Females (%) - Asian
Population - Females (%) - Hispanic or Latino
Population - Females (%) - American Indian and Alaska Native
Population - Females (%) - Multirace
Population - Females (%) - Other Race
Coronavirus confirmed cases (Jun 08, 2024)
Deaths caused by coronavirus (Jun 08, 2024)
Coronavirus confirmed cases (per 100k population) (Jun 08, 2024)
Deaths caused by coronavirus (per 100k population) (Jun 08, 2024)
Daily increase in number of cases (Jun 08, 2024)
Weekly increase in number of cases (Jun 08, 2024)
Cases doubled (in days) (Jun 08, 2024)
Hospitalized patients (Apr 18, 2022)
Negative test results (Apr 18, 2022)
Total test results (Apr 18, 2022)
COVID Vaccine doses distributed (per 100k population) (Sep 19, 2023)
COVID Vaccine doses administered (per 100k population) (Sep 19, 2023)
COVID Vaccine doses distributed (Sep 19, 2023)
COVID Vaccine doses administered (Sep 19, 2023)
Likely homosexual households (%)
Likely homosexual households (% change since 2000)
Likely homosexual households - Lesbian couples (%)
Likely homosexual households - Lesbian couples (% change since 2000)
Likely homosexual households - Gay men (%)
Likely homosexual households - Gay men (% change since 2000)
Cost of living index
Median gross rent ($)
Median contract rent ($)
Median monthly housing costs ($)
Median house or condo value ($)
Median house or condo value ($ change since 2000)
Mean house or condo value by units in structure - 1, detached ($)
Mean house or condo value by units in structure - 1, attached ($)
Mean house or condo value by units in structure - 2 ($)
Mean house or condo value by units in structure by units in structure - 3 or 4 ($)
Mean house or condo value by units in structure - 5 or more ($)
Mean house or condo value by units in structure - Boat, RV, van, etc. ($)
Mean house or condo value by units in structure - Mobile home ($)
Median house or condo value ($) - White
Median house or condo value ($) - Black or African American
Median house or condo value ($) - Asian
Median house or condo value ($) - Hispanic or Latino
Median house or condo value ($) - American Indian and Alaska Native
Median house or condo value ($) - Multirace
Median house or condo value ($) - Other Race
Median resident age
Resident age diversity
Median resident age - Males
Median resident age - Females
Median resident age - White
Median resident age - Black or African American
Median resident age - Asian
Median resident age - Hispanic or Latino
Median resident age - American Indian and Alaska Native
Median resident age - Multirace
Median resident age - Other Race
Median resident age - Males - White
Median resident age - Males - Black or African American
Median resident age - Males - Asian
Median resident age - Males - Hispanic or Latino
Median resident age - Males - American Indian and Alaska Native
Median resident age - Males - Multirace
Median resident age - Males - Other Race
Median resident age - Females - White
Median resident age - Females - Black or African American
Median resident age - Females - Asian
Median resident age - Females - Hispanic or Latino
Median resident age - Females - American Indian and Alaska Native
Median resident age - Females - Multirace
Median resident age - Females - Other Race
Commute - mean travel time to work (minutes)
Travel time to work - Less than 5 minutes (%)
Travel time to work - Less than 5 minutes (% change since 2000)
Travel time to work - 5 to 9 minutes (%)
Travel time to work - 5 to 9 minutes (% change since 2000)
Travel time to work - 10 to 19 minutes (%)
Travel time to work - 10 to 19 minutes (% change since 2000)
Travel time to work - 20 to 29 minutes (%)
Travel time to work - 20 to 29 minutes (% change since 2000)
Travel time to work - 30 to 39 minutes (%)
Travel time to work - 30 to 39 minutes (% change since 2000)
Travel time to work - 40 to 59 minutes (%)
Travel time to work - 40 to 59 minutes (% change since 2000)
Travel time to work - 60 to 89 minutes (%)
Travel time to work - 60 to 89 minutes (% change since 2000)
Travel time to work - 90 or more minutes (%)
Travel time to work - 90 or more minutes (% change since 2000)
Marital status - Never married (%)
Marital status - Now married (%)
Marital status - Separated (%)
Marital status - Widowed (%)
Marital status - Divorced (%)
Median family income ($)
Median family income (% change since 2000)
Median non-family income ($)
Median non-family income (% change since 2000)
Median per capita income ($)
Median per capita income (% change since 2000)
Median family income ($) - White
Median family income ($) - Black or African American
Median family income ($) - Asian
Median family income ($) - Hispanic or Latino
Median family income ($) - American Indian and Alaska Native
Median family income ($) - Multirace
Median family income ($) - Other Race
Median year house/condo built
Median year apartment built
Year house built - Built 2005 or later (%)
Year house built - Built 2000 to 2004 (%)
Year house built - Built 1990 to 1999 (%)
Year house built - Built 1980 to 1989 (%)
Year house built - Built 1970 to 1979 (%)
Year house built - Built 1960 to 1969 (%)
Year house built - Built 1950 to 1959 (%)
Year house built - Built 1940 to 1949 (%)
Year house built - Built 1939 or earlier (%)
Average household size
Household density (households per square mile)
Average household size - White
Average household size - Black or African American
Average household size - Asian
Average household size - Hispanic or Latino
Average household size - American Indian and Alaska Native
Average household size - Multirace
Average household size - Other Race
Occupied housing units (%)
Vacant housing units (%)
Owner occupied housing units (%)
Renter occupied housing units (%)
Vacancy status - For rent (%)
Vacancy status - For sale only (%)
Vacancy status - Rented or sold, not occupied (%)
Vacancy status - For seasonal, recreational, or occasional use (%)
Vacancy status - For migrant workers (%)
Vacancy status - Other vacant (%)
Residents with income below the poverty level (%)
Residents with income below 50% of the poverty level (%)
Children below poverty level (%)
Poor families by family type - Married-couple family (%)
Poor families by family type - Male, no wife present (%)
Poor families by family type - Female, no husband present (%)
Poverty status for native-born residents (%)
Poverty status for foreign-born residents (%)
Poverty among high school graduates not in families (%)
Poverty among people who did not graduate high school not in families (%)
Residents with income below the poverty level (%) - White
Residents with income below the poverty level (%) - Black or African American
Residents with income below the poverty level (%) - Asian
Residents with income below the poverty level (%) - Hispanic or Latino
Residents with income below the poverty level (%) - American Indian and Alaska Native
Residents with income below the poverty level (%) - Multirace
Residents with income below the poverty level (%) - Other Race
Air pollution - Air Quality Index (AQI)
Air pollution - CO
Air pollution - NO2
Air pollution - SO2
Air pollution - Ozone
Air pollution - PM10
Air pollution - PM25
Air pollution - Pb
Crime - Murders per 100,000 population
Crime - Rapes per 100,000 population
Crime - Robberies per 100,000 population
Crime - Assaults per 100,000 population
Crime - Burglaries per 100,000 population
Crime - Thefts per 100,000 population
Crime - Auto thefts per 100,000 population
Crime - Arson per 100,000 population
Crime - City-data.com crime index
Crime - Violent crime index
Crime - Property crime index
Crime - Murders per 100,000 population (5 year average)
Crime - Rapes per 100,000 population (5 year average)
Crime - Robberies per 100,000 population (5 year average)
Crime - Assaults per 100,000 population (5 year average)
Crime - Burglaries per 100,000 population (5 year average)
Crime - Thefts per 100,000 population (5 year average)
Crime - Auto thefts per 100,000 population (5 year average)
Crime - Arson per 100,000 population (5 year average)
Crime - City-data.com crime index (5 year average)
Crime - Violent crime index (5 year average)
Crime - Property crime index (5 year average)
1996 Presidential Elections Results (%) - Democratic Party (Clinton)
1996 Presidential Elections Results (%) - Republican Party (Dole)
1996 Presidential Elections Results (%) - Other
2000 Presidential Elections Results (%) - Democratic Party (Gore)
2000 Presidential Elections Results (%) - Republican Party (Bush)
2000 Presidential Elections Results (%) - Other
2004 Presidential Elections Results (%) - Democratic Party (Kerry)
2004 Presidential Elections Results (%) - Republican Party (Bush)
2004 Presidential Elections Results (%) - Other
2008 Presidential Elections Results (%) - Democratic Party (Obama)
2008 Presidential Elections Results (%) - Republican Party (McCain)
2008 Presidential Elections Results (%) - Other
2012 Presidential Elections Results (%) - Democratic Party (Obama)
2012 Presidential Elections Results (%) - Republican Party (Romney)
2012 Presidential Elections Results (%) - Other
2016 Presidential Elections Results (%) - Democratic Party (Clinton)
2016 Presidential Elections Results (%) - Republican Party (Trump)
2016 Presidential Elections Results (%) - Other
2020 Presidential Elections Results (%) - Democratic Party (Biden)
2020 Presidential Elections Results (%) - Republican Party (Trump)
2020 Presidential Elections Results (%) - Other
Ancestries Reported - Arab (%)
Ancestries Reported - Czech (%)
Ancestries Reported - Danish (%)
Ancestries Reported - Dutch (%)
Ancestries Reported - English (%)
Ancestries Reported - French (%)
Ancestries Reported - French Canadian (%)
Ancestries Reported - German (%)
Ancestries Reported - Greek (%)
Ancestries Reported - Hungarian (%)
Ancestries Reported - Irish (%)
Ancestries Reported - Italian (%)
Ancestries Reported - Lithuanian (%)
Ancestries Reported - Norwegian (%)
Ancestries Reported - Polish (%)
Ancestries Reported - Portuguese (%)
Ancestries Reported - Russian (%)
Ancestries Reported - Scotch-Irish (%)
Ancestries Reported - Scottish (%)
Ancestries Reported - Slovak (%)
Ancestries Reported - Subsaharan African (%)
Ancestries Reported - Swedish (%)
Ancestries Reported - Swiss (%)
Ancestries Reported - Ukrainian (%)
Ancestries Reported - United States (%)
Ancestries Reported - Welsh (%)
Ancestries Reported - West Indian (%)
Ancestries Reported - Other (%)
Educational Attainment - No schooling completed (%)
Educational Attainment - Less than high school (%)
Educational Attainment - High school or equivalent (%)
Educational Attainment - Less than 1 year of college (%)
Educational Attainment - 1 or more years of college (%)
Educational Attainment - Associate degree (%)
Educational Attainment - Bachelor's degree (%)
Educational Attainment - Master's degree (%)
Educational Attainment - Professional school degree (%)
Educational Attainment - Doctorate degree (%)
School Enrollment - Nursery, preschool (%)
School Enrollment - Kindergarten (%)
School Enrollment - Grade 1 to 4 (%)
School Enrollment - Grade 5 to 8 (%)
School Enrollment - Grade 9 to 12 (%)
School Enrollment - College undergrad (%)
School Enrollment - Graduate or professional (%)
School Enrollment - Not enrolled in school (%)
School enrollment - Public schools (%)
School enrollment - Private schools (%)
School enrollment - Not enrolled (%)
Median number of rooms in houses and condos
Median number of rooms in apartments
Housing units lacking complete plumbing facilities (%)
Housing units lacking complete kitchen facilities (%)
Density of houses
Urban houses (%)
Rural houses (%)
Households with people 60 years and over (%)
Households with people 65 years and over (%)
Households with people 75 years and over (%)
Households with one or more nonrelatives (%)
Households with no nonrelatives (%)
Population in households (%)
Family households (%)
Nonfamily households (%)
Population in families (%)
Family households with own children (%)
Median number of bedrooms in owner occupied houses
Mean number of bedrooms in owner occupied houses
Median number of bedrooms in renter occupied houses
Mean number of bedrooms in renter occupied houses
Median number of vehichles in owner occupied houses
Mean number of vehichles in owner occupied houses
Median number of vehichles in renter occupied houses
Mean number of vehichles in renter occupied houses
Mortgage status - with mortgage (%)
Mortgage status - with second mortgage (%)
Mortgage status - with home equity loan (%)
Mortgage status - with both second mortgage and home equity loan (%)
Mortgage status - without a mortgage (%)
Average family size
Average family size - White
Average family size - Black or African American
Average family size - Asian
Average family size - Hispanic or Latino
Average family size - American Indian and Alaska Native
Average family size - Multirace
Average family size - Other Race
Geographical mobility - Same house 1 year ago (%)
Geographical mobility - Moved within same county (%)
Geographical mobility - Moved from different county within same state (%)
Geographical mobility - Moved from different state (%)
Geographical mobility - Moved from abroad (%)
Place of birth - Born in state of residence (%)
Place of birth - Born in other state (%)
Place of birth - Native, outside of US (%)
Place of birth - Foreign born (%)
Housing units in structures - 1, detached (%)
Housing units in structures - 1, attached (%)
Housing units in structures - 2 (%)
Housing units in structures - 3 or 4 (%)
Housing units in structures - 5 to 9 (%)
Housing units in structures - 10 to 19 (%)
Housing units in structures - 20 to 49 (%)
Housing units in structures - 50 or more (%)
Housing units in structures - Mobile home (%)
Housing units in structures - Boat, RV, van, etc. (%)
House/condo owner moved in on average (years ago)
Renter moved in on average (years ago)
Year householder moved into unit - Moved in 1999 to March 2000 (%)
Year householder moved into unit - Moved in 1995 to 1998 (%)
Year householder moved into unit - Moved in 1990 to 1994 (%)
Year householder moved into unit - Moved in 1980 to 1989 (%)
Year householder moved into unit - Moved in 1970 to 1979 (%)
Year householder moved into unit - Moved in 1969 or earlier (%)
Means of transportation to work - Drove car alone (%)
Means of transportation to work - Carpooled (%)
Means of transportation to work - Public transportation (%)
Means of transportation to work - Bus or trolley bus (%)
Means of transportation to work - Streetcar or trolley car (%)
Means of transportation to work - Subway or elevated (%)
Means of transportation to work - Railroad (%)
Means of transportation to work - Ferryboat (%)
Means of transportation to work - Taxicab (%)
Means of transportation to work - Motorcycle (%)
Means of transportation to work - Bicycle (%)
Means of transportation to work - Walked (%)
Means of transportation to work - Other means (%)
Working at home (%)
Industry diversity
Most Common Industries - Agriculture, forestry, fishing and hunting, and mining (%)
Most Common Industries - Agriculture, forestry, fishing and hunting (%)
Most Common Industries - Mining, quarrying, and oil and gas extraction (%)
Most Common Industries - Construction (%)
Most Common Industries - Manufacturing (%)
Most Common Industries - Wholesale trade (%)
Most Common Industries - Retail trade (%)
Most Common Industries - Transportation and warehousing, and utilities (%)
Most Common Industries - Transportation and warehousing (%)
Most Common Industries - Utilities (%)
Most Common Industries - Information (%)
Most Common Industries - Finance and insurance, and real estate and rental and leasing (%)
Most Common Industries - Finance and insurance (%)
Most Common Industries - Real estate and rental and leasing (%)
Most Common Industries - Professional, scientific, and management, and administrative and waste management services (%)
Most Common Industries - Professional, scientific, and technical services (%)
Most Common Industries - Management of companies and enterprises (%)
Most Common Industries - Administrative and support and waste management services (%)
Most Common Industries - Educational services, and health care and social assistance (%)
Most Common Industries - Educational services (%)
Most Common Industries - Health care and social assistance (%)
Most Common Industries - Arts, entertainment, and recreation, and accommodation and food services (%)
Most Common Industries - Arts, entertainment, and recreation (%)
Most Common Industries - Accommodation and food services (%)
Most Common Industries - Other services, except public administration (%)
Most Common Industries - Public administration (%)
Occupation diversity
Most Common Occupations - Management, business, science, and arts occupations (%)
Most Common Occupations - Management, business, and financial occupations (%)
Most Common Occupations - Management occupations (%)
Most Common Occupations - Business and financial operations occupations (%)
Most Common Occupations - Computer, engineering, and science occupations (%)
Most Common Occupations - Computer and mathematical occupations (%)
Most Common Occupations - Architecture and engineering occupations (%)
Most Common Occupations - Life, physical, and social science occupations (%)
Most Common Occupations - Education, legal, community service, arts, and media occupations (%)
Most Common Occupations - Community and social service occupations (%)
Most Common Occupations - Legal occupations (%)
Most Common Occupations - Education, training, and library occupations (%)
Most Common Occupations - Arts, design, entertainment, sports, and media occupations (%)
Most Common Occupations - Healthcare practitioners and technical occupations (%)
Most Common Occupations - Health diagnosing and treating practitioners and other technical occupations (%)
Most Common Occupations - Health technologists and technicians (%)
Most Common Occupations - Service occupations (%)
Most Common Occupations - Healthcare support occupations (%)
Most Common Occupations - Protective service occupations (%)
Most Common Occupations - Fire fighting and prevention, and other protective service workers including supervisors (%)
Most Common Occupations - Law enforcement workers including supervisors (%)
Most Common Occupations - Food preparation and serving related occupations (%)
Most Common Occupations - Building and grounds cleaning and maintenance occupations (%)
Most Common Occupations - Personal care and service occupations (%)
Most Common Occupations - Sales and office occupations (%)
Most Common Occupations - Sales and related occupations (%)
Most Common Occupations - Office and administrative support occupations (%)
Most Common Occupations - Natural resources, construction, and maintenance occupations (%)
Most Common Occupations - Farming, fishing, and forestry occupations (%)
Most Common Occupations - Construction and extraction occupations (%)
Most Common Occupations - Installation, maintenance, and repair occupations (%)
Most Common Occupations - Production, transportation, and material moving occupations (%)
Most Common Occupations - Production occupations (%)
Most Common Occupations - Transportation occupations (%)
Most Common Occupations - Material moving occupations (%)
People in Group quarters - Institutionalized population (%)
People in Group quarters - Correctional institutions (%)
People in Group quarters - Federal prisons and detention centers (%)
People in Group quarters - Halfway houses (%)
People in Group quarters - Local jails and other confinement facilities (including police lockups) (%)
People in Group quarters - Military disciplinary barracks (%)
People in Group quarters - State prisons (%)
People in Group quarters - Other types of correctional institutions (%)
People in Group quarters - Nursing homes (%)
People in Group quarters - Hospitals/wards, hospices, and schools for the handicapped (%)
People in Group quarters - Hospitals/wards and hospices for chronically ill (%)
People in Group quarters - Hospices or homes for chronically ill (%)
People in Group quarters - Military hospitals or wards for chronically ill (%)
People in Group quarters - Other hospitals or wards for chronically ill (%)
People in Group quarters - Hospitals or wards for drug/alcohol abuse (%)
People in Group quarters - Mental (Psychiatric) hospitals or wards (%)
People in Group quarters - Schools, hospitals, or wards for the mentally retarded (%)
People in Group quarters - Schools, hospitals, or wards for the physically handicapped (%)
People in Group quarters - Institutions for the deaf (%)
People in Group quarters - Institutions for the blind (%)
People in Group quarters - Orthopedic wards and institutions for the physically handicapped (%)
People in Group quarters - Wards in general hospitals for patients who have no usual home elsewhere (%)
People in Group quarters - Wards in military hospitals for patients who have no usual home elsewhere (%)
People in Group quarters - Juvenile institutions (%)
People in Group quarters - Long-term care (%)
People in Group quarters - Homes for abused, dependent, and neglected children (%)
People in Group quarters - Residential treatment centers for emotionally disturbed children (%)
People in Group quarters - Training schools for juvenile delinquents (%)
People in Group quarters - Short-term care, detention or diagnostic centers for delinquent children (%)
People in Group quarters - Type of juvenile institution unknown (%)
People in Group quarters - Noninstitutionalized population (%)
People in Group quarters - College dormitories (includes college quarters off campus) (%)
People in Group quarters - Military quarters (%)
People in Group quarters - On base (%)
People in Group quarters - Barracks, unaccompanied personnel housing (UPH), (Enlisted/Officer), ;and similar group living quarters for military personnel (%)
People in Group quarters - Transient quarters for temporary residents (%)
People in Group quarters - Military ships (%)
People in Group quarters - Group homes (%)
People in Group quarters - Homes or halfway houses for drug/alcohol abuse (%)
People in Group quarters - Homes for the mentally ill (%)
People in Group quarters - Homes for the mentally retarded (%)
People in Group quarters - Homes for the physically handicapped (%)
People in Group quarters - Other group homes (%)
People in Group quarters - Religious group quarters (%)
People in Group quarters - Dormitories (%)
People in Group quarters - Agriculture workers' dormitories on farms (%)
People in Group quarters - Job Corps and vocational training facilities (%)
People in Group quarters - Other workers' dormitories (%)
People in Group quarters - Crews of maritime vessels (%)
People in Group quarters - Other nonhousehold living situations (%)
People in Group quarters - Other noninstitutional group quarters (%)
Residents speaking English at home (%)
Residents speaking English at home - Born in the United States (%)
Residents speaking English at home - Native, born elsewhere (%)
Residents speaking English at home - Foreign born (%)
Residents speaking Spanish at home (%)
Residents speaking Spanish at home - Born in the United States (%)
Residents speaking Spanish at home - Native, born elsewhere (%)
Residents speaking Spanish at home - Foreign born (%)
Residents speaking other language at home (%)
Residents speaking other language at home - Born in the United States (%)
Residents speaking other language at home - Native, born elsewhere (%)
Residents speaking other language at home - Foreign born (%)
Class of Workers - Employee of private company (%)
Class of Workers - Self-employed in own incorporated business (%)
Class of Workers - Private not-for-profit wage and salary workers (%)
Class of Workers - Local government workers (%)
Class of Workers - State government workers (%)
Class of Workers - Federal government workers (%)
Class of Workers - Self-employed workers in own not incorporated business and Unpaid family workers (%)
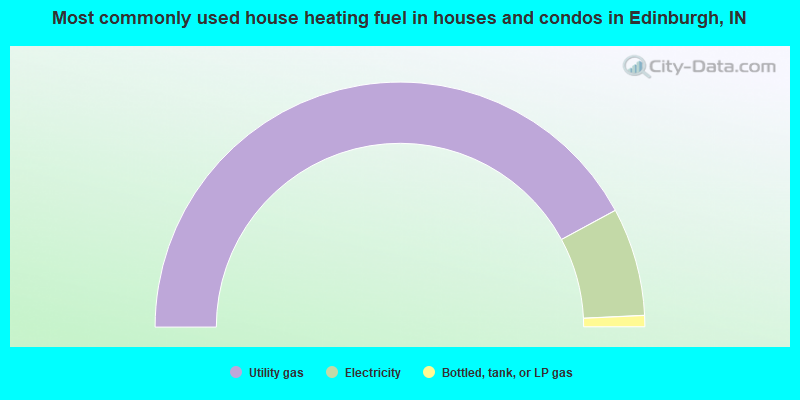
House heating fuel used in houses and condos - Utility gas (%)
House heating fuel used in houses and condos - Bottled, tank, or LP gas (%)
House heating fuel used in houses and condos - Electricity (%)
House heating fuel used in houses and condos - Fuel oil, kerosene, etc. (%)
House heating fuel used in houses and condos - Coal or coke (%)
House heating fuel used in houses and condos - Wood (%)
House heating fuel used in houses and condos - Solar energy (%)
House heating fuel used in houses and condos - Other fuel (%)
House heating fuel used in houses and condos - No fuel used (%)
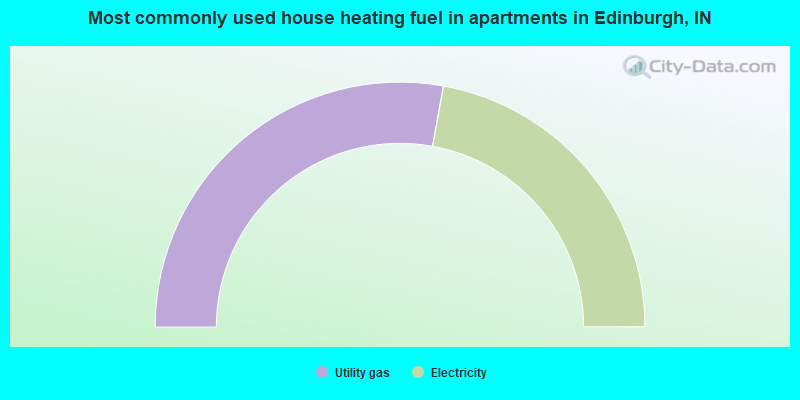
House heating fuel used in apartments - Utility gas (%)
House heating fuel used in apartments - Bottled, tank, or LP gas (%)
House heating fuel used in apartments - Electricity (%)
House heating fuel used in apartments - Fuel oil, kerosene, etc. (%)
House heating fuel used in apartments - Coal or coke (%)
House heating fuel used in apartments - Wood (%)
House heating fuel used in apartments - Solar energy (%)
House heating fuel used in apartments - Other fuel (%)
House heating fuel used in apartments - No fuel used (%)
Armed forces status - In Armed Forces (%)
Armed forces status - Civilian (%)
Armed forces status - Civilian - Veteran (%)
Armed forces status - Civilian - Nonveteran (%)
Fatal accidents locations in years 2005-2021
Fatal accidents locations in 2005
Fatal accidents locations in 2006
Fatal accidents locations in 2007
Fatal accidents locations in 2008
Fatal accidents locations in 2009
Fatal accidents locations in 2010
Fatal accidents locations in 2011
Fatal accidents locations in 2012
Fatal accidents locations in 2013
Fatal accidents locations in 2014
Fatal accidents locations in 2015
Fatal accidents locations in 2016
Fatal accidents locations in 2017
Fatal accidents locations in 2018
Fatal accidents locations in 2019
Fatal accidents locations in 2020
Fatal accidents locations in 2021
Alcohol use - People drinking some alcohol every month (%)
Alcohol use - People not drinking at all (%)
Alcohol use - Average days/month drinking alcohol
Alcohol use - Average drinks/week
Alcohol use - Average days/year people drink much
Audiometry - Average condition of hearing (%)
Audiometry - People that can hear a whisper from across a quiet room (%)
Audiometry - People that can hear normal voice from across a quiet room (%)
Audiometry - Ears ringing, roaring, buzzing (%)
Audiometry - Had a job exposure to loud noise (%)
Audiometry - Had off-work exposure to loud noise (%)
Blood Pressure & Cholesterol - Has high blood pressure (%)
Blood Pressure & Cholesterol - Checking blood pressure at home (%)
Blood Pressure & Cholesterol - Frequently checking blood cholesterol (%)
Blood Pressure & Cholesterol - Has high cholesterol level (%)
Consumer Behavior - Money monthly spent on food at supermarket/grocery store
Consumer Behavior - Money monthly spent on food at other stores
Consumer Behavior - Money monthly spent on eating out
Consumer Behavior - Money monthly spent on carryout/delivered foods
Consumer Behavior - Income spent on food at supermarket/grocery store (%)
Consumer Behavior - Income spent on food at other stores (%)
Consumer Behavior - Income spent on eating out (%)
Consumer Behavior - Income spent on carryout/delivered foods (%)
Current Health Status - General health condition (%)
Current Health Status - Blood donors (%)
Current Health Status - Has blood ever tested for HIV virus (%)
Current Health Status - Left-handed people (%)
Dermatology - People using sunscreen (%)
Diabetes - Diabetics (%)
Diabetes - Had a blood test for high blood sugar (%)
Diabetes - People taking insulin (%)
Diet Behavior & Nutrition - Diet health (%)
Diet Behavior & Nutrition - Milk product consumption (# of products/month)
Diet Behavior & Nutrition - Meals not home prepared (#/week)
Diet Behavior & Nutrition - Meals from fast food or pizza place (#/week)
Diet Behavior & Nutrition - Ready-to-eat foods (#/month)
Diet Behavior & Nutrition - Frozen meals/pizza (#/month)
Drug Use - People that ever used marijuana or hashish (%)
Drug Use - Ever used hard drugs (%)
Drug Use - Ever used any form of cocaine (%)
Drug Use - Ever used heroin (%)
Drug Use - Ever used methamphetamine (%)
Health Insurance - People covered by health insurance (%)
Kidney Conditions-Urology - Avg. # of times urinating at night
Medical Conditions - People with asthma (%)
Medical Conditions - People with anemia (%)
Medical Conditions - People with psoriasis (%)
Medical Conditions - People with overweight (%)
Medical Conditions - Elderly people having difficulties in thinking or remembering (%)
Medical Conditions - People who ever received blood transfusion (%)
Medical Conditions - People having trouble seeing even with glass/contacts (%)
Medical Conditions - People with arthritis (%)
Medical Conditions - People with gout (%)
Medical Conditions - People with congestive heart failure (%)
Medical Conditions - People with coronary heart disease (%)
Medical Conditions - People with angina pectoris (%)
Medical Conditions - People who ever had heart attack (%)
Medical Conditions - People who ever had stroke (%)
Medical Conditions - People with emphysema (%)
Medical Conditions - People with thyroid problem (%)
Medical Conditions - People with chronic bronchitis (%)
Medical Conditions - People with any liver condition (%)
Medical Conditions - People who ever had cancer or malignancy (%)
Mental Health - People who have little interest in doing things (%)
Mental Health - People feeling down, depressed, or hopeless (%)
Mental Health - People who have trouble sleeping or sleeping too much (%)
Mental Health - People feeling tired or having little energy (%)
Mental Health - People with poor appetite or overeating (%)
Mental Health - People feeling bad about themself (%)
Mental Health - People who have trouble concentrating on things (%)
Mental Health - People moving or speaking slowly or too fast (%)
Mental Health - People having thoughts they would be better off dead (%)
Oral Health - Average years since last visit a dentist
Oral Health - People embarrassed because of mouth (%)
Oral Health - People with gum disease (%)
Oral Health - General health of teeth and gums (%)
Oral Health - Average days a week using dental floss/device
Oral Health - Average days a week using mouthwash for dental problem
Oral Health - Average number of teeth
Pesticide Use - Households using pesticides to control insects (%)
Pesticide Use - Households using pesticides to kill weeds (%)
Physical Activity - People doing vigorous-intensity work activities (%)
Physical Activity - People doing moderate-intensity work activities (%)
Physical Activity - People walking or bicycling (%)
Physical Activity - People doing vigorous-intensity recreational activities (%)
Physical Activity - People doing moderate-intensity recreational activities (%)
Physical Activity - Average hours a day doing sedentary activities
Physical Activity - Average hours a day watching TV or videos
Physical Activity - Average hours a day using computer
Physical Functioning - People having limitations keeping them from working (%)
Physical Functioning - People limited in amount of work they can do (%)
Physical Functioning - People that need special equipment to walk (%)
Physical Functioning - People experiencing confusion/memory problems (%)
Physical Functioning - People requiring special healthcare equipment (%)
Prescription Medications - Average number of prescription medicines taking
Preventive Aspirin Use - Adults 40+ taking low-dose aspirin (%)
Reproductive Health - Vaginal deliveries (%)
Reproductive Health - Cesarean deliveries (%)
Reproductive Health - Deliveries resulted in a live birth (%)
Reproductive Health - Pregnancies resulted in a delivery (%)
Reproductive Health - Women breastfeeding newborns (%)
Reproductive Health - Women that had a hysterectomy (%)
Reproductive Health - Women that had both ovaries removed (%)
Reproductive Health - Women that have ever taken birth control pills (%)
Reproductive Health - Women taking birth control pills (%)
Reproductive Health - Women that have ever used Depo-Provera or injectables (%)
Reproductive Health - Women that have ever used female hormones (%)
Sexual Behavior - People 18+ that ever had sex (vaginal, anal, or oral) (%)
Sexual Behavior - Males 18+ that ever had vaginal sex with a woman (%)
Sexual Behavior - Males 18+ that ever performed oral sex on a woman (%)
Sexual Behavior - Males 18+ that ever had anal sex with a woman (%)
Sexual Behavior - Males 18+ that ever had any sex with a man (%)
Sexual Behavior - Females 18+ that ever had vaginal sex with a man (%)
Sexual Behavior - Females 18+ that ever performed oral sex on a man (%)
Sexual Behavior - Females 18+ that ever had anal sex with a man (%)
Sexual Behavior - Females 18+ that ever had any kind of sex with a woman (%)
Sexual Behavior - Average age people first had sex
Sexual Behavior - Average number of female sex partners in lifetime (males 18+)
Sexual Behavior - Average number of female vaginal sex partners in lifetime (males 18+)
Sexual Behavior - Average age people first performed oral sex on a woman (18+)
Sexual Behavior - Average number of woman performed oral sex on in lifetime (18+)
Sexual Behavior - Average number of male sex partners in lifetime (males 18+)
Sexual Behavior - Average number of male anal sex partners in lifetime (males 18+)
Sexual Behavior - Average age people first performed oral sex on a man (18+)
Sexual Behavior - Average number of male oral sex partners in lifetime (18+)
Sexual Behavior - People using protection when performing oral sex (%)
Sexual Behavior - Average number of times people have vaginal or anal sex a year
Sexual Behavior - People having sex without condom (%)
Sexual Behavior - Average number of male sex partners in lifetime (females 18+)
Sexual Behavior - Average number of male vaginal sex partners in lifetime (females 18+)
Sexual Behavior - Average number of female sex partners in lifetime (females 18+)
Sexual Behavior - Circumcised males 18+ (%)
Sleep Disorders - Average hours sleeping at night
Sleep Disorders - People that has trouble sleeping (%)
Smoking-Cigarette Use - People smoking cigarettes (%)
Taste & Smell - People 40+ having problems with smell (%)
Taste & Smell - People 40+ having problems with taste (%)
Taste & Smell - People 40+ that ever had wisdom teeth removed (%)
Taste & Smell - People 40+ that ever had tonsils teeth removed (%)
Taste & Smell - People 40+ that ever had a loss of consciousness because of a head injury (%)
Taste & Smell - People 40+ that ever had a broken nose or other serious injury to face or skull (%)
Taste & Smell - People 40+ that ever had two or more sinus infections (%)
Weight - Average height (inches)
Weight - Average weight (pounds)
Weight - Average BMI
Weight - People that are obese (%)
Weight - People that ever were obese (%)
Weight - People trying to lose weight (%)
According to our research of Indiana and other state lists, there were 2 registered sex offenders living in Edinburgh, Indiana as of June 08, 2024 . The ratio of all residents to sex offenders in Edinburgh is 2,339 to 1.The ratio of registered sex offenders to all residents in this city is much lower than the state average.
Officers per 1,000 residents here:
2.59Indiana average:
2.16
Latest news from Edinburgh, IN collected exclusively by city-data.com from local newspapers, TV, and radio stations
Ancestries: American (35.8%), German (18.7%), Irish (14.9%), English (11.1%), European (2.4%), African (1.1%).
Current Local Time:
Land area: 2.84 square miles.
Population density: 1,548 people per square mile (low).
17 residents are foreign born
This town:
0.4%Indiana:
5.6%
Median real estate property taxes paid for housing units with mortgages in 2022: $1,224 (0.8%)Median real estate property taxes paid for housing units with no mortgage in 2022: $1,477 (0.9%)
Nearest city with pop. 50,000+: Indianapolis, IN
Nearest city with pop. 1,000,000+: Chicago, IL
Nearest cities:
Latitude: 39.35 N, Longitude: 85.97 W
Daytime population change due to commuting: +213 (+5.0%)Workers who live and work in this town: 666 (29.7%)
Single-family new house construction building permits:
2022: 15 buildings , average cost: $263,5002021: 11 buildings , average cost: $343,0002020: 3 buildings , average cost: $253,3002019: 7 buildings , average cost: $252,7002018: 6 buildings , average cost: $297,5002017: 2 buildings , average cost: $160,5002016: 1 building , cost: $80,0002015: 2 buildings , average cost: $212,5002014: 2 buildings , average cost: $206,0002012: 5 buildings , average cost: $102,1002010: 2 buildings , average cost: $76,3002009: 3 buildings , average cost: $76,3002008: 7 buildings , average cost: $83,1002007: 4 buildings , average cost: $134,3002006: 5 buildings , average cost: $134,3002005: 8 buildings , average cost: $134,3002004: 4 buildings , average cost: $134,4002003: 6 buildings , average cost: $134,0002002: 6 buildings , average cost: $135,8002001: 3 buildings , average cost: $125,2002000: 4 buildings , average cost: $156,9001999: 5 buildings , average cost: $109,3001998: 9 buildings , average cost: $196,0001997: 4 buildings , average cost: $67,000Unemployment in December 2023:
Most common occupations in Edinburgh, IN (%)
Both Males Females
Metal workers and plastic workers (10.3%)
Other production occupations, including supervisors (8.6%)
Assemblers and fabricators (5.9%)
Laborers and material movers, hand (5.8%)
Building and grounds cleaning and maintenance occupations (5.6%)
Driver/sales workers and truck drivers (3.6%)
Electrical equipment mechanics and other installation, maintenance, and repair workers, including supervisors (3.4%)
Other production occupations, including supervisors (11.4%)
Metal workers and plastic workers (10.2%)
Assemblers and fabricators (9.0%)
Driver/sales workers and truck drivers (6.1%)
Laborers and material movers, hand (6.0%)
Electrical equipment mechanics and other installation, maintenance, and repair workers, including supervisors (5.3%)
Woodworkers (4.6%)
Metal workers and plastic workers (10.3%)
Cashiers (7.6%)
Building and grounds cleaning and maintenance occupations (6.8%)
Other sales and related occupations, including supervisors (6.6%)
Laborers and material movers, hand (5.6%)
Other production occupations, including supervisors (5.2%)
Secretaries and administrative assistants (4.4%)
Tornado activity:
Edinburgh-area historical tornado activity is slightly above Indiana state average. It is 118% greater than the overall U.S. average.
On 4/25/1961, a category F4 (max. wind speeds 207-260 mph) tornado 18.1 miles away from the Edinburgh town center injured 7 people and caused between $500,000 and $5,000,000 in damages.
On 4/3/1974, a category F4 tornado 20.3 miles away from the town center killed 4 people and injured 17 people and caused between $5,000,000 and $50,000,000 in damages.
Earthquake activity:
Edinburgh-area historical earthquake activity is significantly above Indiana state average. It is 88% greater than the overall U.S. average. On 4/18/2008 at 09:36:59, a magnitude 5.4 (5.1 MB, 4.8 MS, 5.4 MW, 5.2 MW, Class: Moderate, Intensity: VI - VII) earthquake occurred 120.6 miles away from the city center On 4/18/2008 at 09:36:59, a magnitude 5.2 (5.2 MW, Depth: 8.9 mi) earthquake occurred 120.6 miles away from the city center On 6/10/1987 at 23:48:54, a magnitude 5.1 (4.9 MB, 4.4 MS, 4.6 MS, 5.1 LG) earthquake occurred 109.3 miles away from the city center On 7/27/1980 at 18:52:21, a magnitude 5.2 (5.1 MB, 4.7 MS, 5.0 UK, 5.2 UK) earthquake occurred 135.0 miles away from Edinburgh center On 6/18/2002 at 17:37:15, a magnitude 5.0 (4.3 MB, 4.6 MW, 5.0 LG) earthquake occurred 136.0 miles away from Edinburgh center On 4/18/2008 at 15:14:16, a magnitude 4.8 (4.5 MB, 4.8 MW, 4.6 MW, Class: Light, Intensity: IV - V) earthquake occurred 117.9 miles away from the city center Magnitude types: regional Lg-wave magnitude (LG), body-wave magnitude (MB), surface-wave magnitude (MS), moment magnitude (MW) Natural disasters: The number of natural disasters in Johnson County (13) is near the US average (15).Major Disasters (Presidential) Declared: 9Emergencies Declared: 3Floods: 6, Storms: 6, Tornadoes: 4, Winter Storms: 3, Blizzard: 1, Hurricane: 1, Snow: 1, Snowstorm: 1, Other: 1 (Note: some incidents may be assigned to more than one category). Hospitals and medical centers in Edinburgh: FAITH NURSING HOME (30 NORTH EISENHOWER DRIVE)
Other hospitals and medical centers near Edinburgh: DEVELOPMENTAL SERVICES INC (Hospital, about 8 miles away; COLUMBUS, IN)
KOALA HOSPITAL AND COUNSELING CENTER (Hospital, about 9 miles away; COLUMBUS, IN)
AMERICAN NURSING CARE INC (Home Health Center, about 9 miles away; COLUMBUS, IN)
WILLOW CROSSING HEALTH AND REHABILITATION CENTER (Nursing Home, about 9 miles away; COLUMBUS, IN)
ACACIA HOME HEALTH SERVICES (Home Health Center, about 10 miles away; FRANKLIN, IN)
INDIANA MASONIC HOME INC (Nursing Home, about 10 miles away; FRANKLIN, IN)
HOMEVIEW CENTER OF FRANKLIN (Nursing Home, about 10 miles away; FRANKLIN, IN)
Colleges/universities with over 2000 students nearest to Edinburgh:
University of Indianapolis (about 27 miles; Indianapolis, IN ; Full-time enrollment: 4,625)
Harrison College-Indianapolis (about 31 miles; Indianapolis, IN ; FT enrollment: 4,244)
American College of Education (about 31 miles; Indianapolis, IN ; FT enrollment: 2,718)
Indiana University-Purdue University-Indianapolis (about 32 miles; Indianapolis, IN ; FT enrollment: 22,751)
Indiana University-Bloomington (about 33 miles; Bloomington, IN ; FT enrollment: 39,039)
Ivy Tech Community College (about 33 miles; Indianapolis, IN ; FT enrollment: 71,493)
Marian University (about 35 miles; Indianapolis, IN ; FT enrollment: 2,476)
Public high school in Edinburgh:
Private high school in Edinburgh: TABERNACLE CHRISTIAN SCHOOL Students: 45, Location: 701 S MAIN ST, Grades: KG-12)
Public elementary/middle schools in Edinburgh:
See full list of schools located in Edinburgh Library in Edinburgh: EDINBURGH WRIGHT-HAGEMAN PUBLIC LIBRARY Operating income: $373,290; Location: 119 WEST MAIN CROSS STREET; 25,558 books ; 1,275 audio materials ; 1,914 video materials ; 37 state licensed databases ; 4 other licensed databases ; 84 print serial subscriptions ; 5 electronic serial subscriptions )
Johnson County has a predicted average indoor radon screening level greater than 4 pCi/L (pico curies per liter) - Highest Potential Drinking water stations with addresses in Edinburgh and their reported violations in the past:
EDINBURGH WATER UTILITY (Population served: 4,700, Groundwater):
Past monitoring violations:
Monitoring, Source Water (GWR) - In JUN-13-2013, Contaminant: E. COLI. Follow-up actions: St Public Notif requested (JUN-13-2013), St Violation/Reminder Notice (JUN-13-2013), St Compliance achieved (JUN-21-2013), St Public Notif received (JUN-21-2013)
Serves FL, Population served: 1,209, Groundwater):
Past health violations:
MCL, Single Sample - Between NOV-26-2006 and DEC-31-2006, Contaminant: Nitrate. Follow-up actions: St Compliance achieved (MAY-16-2007)
Past monitoring violations:
Failure to Conduct Assessment Monitoring - In MAY-2014, Contaminant: E. COLI
Failure to Conduct Assessment Monitoring - In DEC-2013, Contaminant: E. COLI
Failure to Conduct Assessment Monitoring - In NOV-2013, Contaminant: E. COLI
Failure to Conduct Assessment Monitoring - In AUG-2013, Contaminant: E. COLI
2 routine major monitoring violations
2 regular monitoring violations
Drinking water stations with addresses in Edinburgh that have no violations reported:
CAMP ATTERBURY (Population served: 5,300, Primary Water Source Type: Purch groundwater)
Average household size: This town:
2.5 peopleIndiana:
2.5 people
Percentage of family households: This town:
67.0%Whole state:
66.9%
Percentage of households with unmarried partners: This town:
10.3%Whole state:
6.9%
Likely homosexual households (counted as self-reported same-sex unmarried-partner households)
Lesbian couples: 0.4% of all households Gay men: 0.1% of all households
Banks with branches in Edinburgh (2011 data):
Mutual Savings Bank: Edinburgh Branch at 206 S. Main Street, branch established on 2005/05/23. Info updated 2008/09/02: Bank assets: $118.9 mil, Deposits: $89.0 mil, headquarters in Franklin, IN, positive income , Commercial Lending Specialization, 6 total offices , Holding Company: Third Century Bancorp
MainSource Bank: Edinburgh Branch at 3880 West Presidential Way, branch established on 2000/01/17. Info updated 2009/12/09: Bank assets: $2,729.1 mil, Deposits: $2,167.0 mil, headquarters in Greensburg, IN, positive income , 86 total offices , Holding Company: Mainsource Financial Group, Inc.
Salin Bank and Trust Company: Edinburgh Branch at 100 West Main Street, branch established on 1997/11/17. Info updated 2006/11/03: Bank assets: $851.0 mil, Deposits: $677.9 mil, headquarters in Indianapolis, IN, positive income , Commercial Lending Specialization, 23 total offices , Holding Company: Salin Bancshares, Inc.
For population 15 years and over in Edinburgh:
Never married: 25.4%Now married: 49.1%Separated: 1.5%Widowed: 3.5%Divorced: 20.5% For population 25 years and over in Edinburgh:
High school or higher: 87.5%Bachelor's degree or higher: 9.2%Graduate or professional degree: 2.2%Unemployed: 5.4%Mean travel time to work (commute): 19.3 minutes
Education Gini index (Inequality in education) Here:
10.7Indiana average:
11.3
Religion statistics for Edinburgh, IN (based on Johnson County data)
Religion Adherents Congregations Evangelical Protestant 41,166 98 Catholic 11,589 4 Mainline Protestant 9,942 31 Other 1,325 3 Black Protestant 314 2 Orthodox 27 1 None 75,291 -
Source: Clifford Grammich, Kirk Hadaway, Richard Houseal, Dale E.Jones, Alexei Krindatch, Richie Stanley and Richard H.Taylor. 2012. 2010 U.S.Religion Census: Religious Congregations & Membership Study. Association of Statisticians of American Religious Bodies. Jones, Dale E., et al. 2002. Congregations and Membership in the United States 2000. Nashville, TN: Glenmary Research Center. Graphs represent county-level data
Food Environment Statistics: Number of grocery stores : 14Johnson County :
1.03 / 10,000 pop.Indiana :
1.73 / 10,000 pop.
Number of supercenters and club stores : 4This county :
0.29 / 10,000 pop.Indiana :
0.21 / 10,000 pop.
Number of convenience stores (no gas) : 5This county :
0.37 / 10,000 pop.State :
0.50 / 10,000 pop.
Number of convenience stores (with gas) : 36Johnson County :
2.65 / 10,000 pop.State :
3.57 / 10,000 pop.
Number of full-service restaurants : 89Johnson County :
6.54 / 10,000 pop.Indiana :
6.78 / 10,000 pop.
Adult diabetes rate : Johnson County :
8.1%State :
9.2%
Low-income preschool obesity rate : Johnson County :
12.6%Indiana :
14.3%
Health and Nutrition:
Average overall health of teeth and gums : Edinburgh:
43.8%Indiana:
46.2%
People feeling badly about themselves : Edinburgh:
22.1%State:
21.3%
People not drinking alcohol at all : Edinburgh:
11.5%State:
10.6%
Average hours sleeping at night : Overweight people : This city:
34.6%Indiana:
33.9%
General health condition : This city:
55.5%Indiana:
56.1%
Average condition of hearing : Edinburgh:
77.4%Indiana:
78.7%
More about Health and Nutrition of Edinburgh, IN Residents
Local government employment and payroll (March 2022)
Function
Full-time employees
Monthly full-time payroll
Average yearly full-time wage
Part-time employees
Monthly part-time payroll
Police Protection - Officers
11 $58,583 $63,909 0 $0 Other and Unallocable
10 $41,436 $49,723 3 $2,855 Electric Power
9 $50,592 $67,456 0 $0 Sewerage
7 $39,322 $67,409 0 $0 Parks and Recreation
7 $34,697 $59,481 18 $25,849 Water Supply
5 $24,055 $57,732 1 $4,521 Streets and Highways
4 $19,915 $59,745 3 $9,689 Financial Administration
3 $16,430 $65,720 0 $0 Police - Other
1 $3,845 $46,140 3 $2,855 Firefighters
1 $3,901 $46,812 1 $1,127 Other Government Administration
0 $0 8 $5,063
Totals for Government
58 $292,776 $60,574 37 $51,959
Edinburgh government finances - Expenditure in 2021 (per resident):
Construction - Electric Utilities: $624,000 ($141.82)
Sewerage: $171,000 ($38.86)Water Utilities: $130,000 ($29.55)Regular Highways: $82,000 ($18.64)General - Other: $4,000 ($0.91)Current Operations - Electric Utilities: $7,943,000 ($1805.23)
Regular Highways: $1,687,000 ($383.41)Parks and Recreation: $1,242,000 ($282.27)Police Protection: $1,095,000 ($248.86)Water Utilities: $806,000 ($183.18)Sewerage: $786,000 ($178.64)General - Other: $685,000 ($155.68)Local Fire Protection: $646,000 ($146.82)Central Staff Services: $481,000 ($109.32)Miscellaneous Commercial Activities - Other: $340,000 ($77.27)General Public Buildings: $229,000 ($52.05)Solid Waste Management: $225,000 ($51.14)Health - Other: $172,000 ($39.09)Financial Administration: $96,000 ($21.82)General - Interest on Debt: $224,000 ($50.91)
Other Capital Outlay - General - Other: $547,000 ($124.32)
Sewerage: $148,000 ($33.64)Police Protection: $105,000 ($23.86)Parks and Recreation: $39,000 ($8.86)Central Staff Services: $22,000 ($5.00)Electric Utilities: $15,000 ($3.41)Local Fire Protection: $10,000 ($2.27)Miscellaneous Commercial Activities - Other: $7,000 ($1.59)Health - Other: $3,000 ($0.68)
Edinburgh government finances - Revenue in 2021 (per resident):
Charges - Sewerage: $2,119,000 ($481.59)
Parks and Recreation: $1,315,000 ($298.86)Miscellaneous Commercial Activities: $136,000 ($30.91)Other: $115,000 ($26.14)Solid Waste Management: $15,000 ($3.41)Federal Intergovernmental - Other: $148,000 ($33.64)
Local Intergovernmental - Highways: $96,000 ($21.82)
Other: $3,000 ($0.68)Miscellaneous - Donations From Private Sources: $161,000 ($36.59)
Interest Earnings: $28,000 ($6.36)General Revenue - Other: $11,000 ($2.50)Revenue - Electric Utilities: $8,746,000 ($1987.73)
Water Utilities: $1,751,000 ($397.95)State Intergovernmental - Highways: $1,589,000 ($361.14)
Other: $484,000 ($110.00)General Local Government Support: $265,000 ($60.23)Tax - Property: $2,191,000 ($497.95)
Public Utilities Sales: $16,000 ($3.64)Other License: $6,000 ($1.36)
Edinburgh government finances - Debt in 2021 (per resident):
Long Term Debt - Outstanding Unspecified Public Purpose: $5,618,000 ($1276.82)
Beginning Outstanding - Unspecified Public Purpose: $5,618,000 ($1276.82)
Edinburgh government finances - Cash and Securities in 2021 (per resident):
Bond Funds - Cash and Securities: $246,000 ($55.91)
Other Funds - Cash and Securities: $15,703,000 ($3568.86)
Sinking Funds - Cash and Securities: $710,000 ($161.36)
Businesses in Edinburgh, IN
Name Count Name Count
ALDO 2 H&R Block 1 Aeropostale 1 Hardee's 1 American Eagle Outfitters 1 Hilton 2 Arby's 1 Holiday Inn 1 Banana Republic 1 IZOD 1 Best Western 1 J.Crew 1 CVS 1 Jimmy Jazz 1 Casual Male XL 1 Jones New York 1 Charlotte Russe 1 Justice 1 Chico's 1 Kroger 1 Circle K 2 Lane Bryant 1 Clarks 1 Levi Strauss & Co. 1 Coldwater Creek 1 Maurices 1 Comfort Inn 1 McDonald's 1 Cracker Barrel 1 Motherhood Maternity 1 Dairy Queen 1 Nike 2 Domino's Pizza 1 Pac Sun 1 DressBarn 1 Ruby Tuesday 1 Dressbarn 1 Rue21 1 Eddie Bauer 1 Skechers USA 1 Famous Footwear 1 Subway 2 FedEx 1 Taco Bell 1 Gap 1 UPS 1 Gymboree 1
Strongest AM radio stations in Edinburgh:
WIBC (1070 AM; 50 kW; INDIANAPOLIS, IN; Owner: EMMIS RADIO LICENSE CORPORATION)
WLW (700 AM; 50 kW; CINCINNATI, OH; Owner: JACOR BROADCASTING CORPORATION)
WHAS (840 AM; 50 kW; LOUISVILLE, KY; Owner: CLEAR CHANNEL BROADCASTING LICENSES, INC.)
WSAI (1530 AM; 50 kW; CINCINNATI, OH; Owner: JACOR BROADCASTING CORPORATION)
WTLC (1310 AM; 5 kW; INDIANAPOLIS, IN; Owner: RADIO ONE OF INDIANA, LLC)
WNTS (1590 AM; 5 kW; BEECH GROVE, IN; Owner: S + M BROADCASTING CO., INC.)
WXLW (950 AM; 5 kW; INDIANAPOLIS, IN)
WNDE (1260 AM; 5 kW; INDIANAPOLIS, IN; Owner: CAPSTAR TX LIMITED PARTNERSHIP)
WOWO (1190 AM; 50 kW; FORT WAYNE, IN; Owner: PATHFINDER COMMUNICATIONS CORPORATION)
WTVN (610 AM; 50 kW; COLUMBUS, OH; Owner: CITICASTERS LICENSES, L.P.)
WXNT (1430 AM; 5 kW; INDIANAPOLIS, IN; Owner: MYSTAR COMMUNICATIONS CORPORATION)
WGCL (1370 AM; 5 kW; BLOOMINGTON, IN; Owner: SARKES TARZIAN, INC,)
WBRI (1500 AM; daytime; 5 kW; INDIANAPOLIS, IN)
Strongest FM radio stations in Edinburgh:
WTTS (92.3 FM; BLOOMINGTON, IN; Owner: SARKES TARZIAN, INC.)
WKKG (101.5 FM; COLUMBUS, IN; Owner: WHITE RIVER BROADCASTING CO. INC.)
WJLR (91.5 FM; SEYMOUR, IN; Owner: MIDWEST MINISTRIES, INC.)
WIJY (95.9 FM; FRANKLIN, IN; Owner: PILGRIM COMMUNICATIONS, LLC)
WENS (97.1 FM; SHELBYVILLE, IN; Owner: EMMIS RADIO LICENSE CORPORATION)
WYGB (102.9 FM; EDINBURGH, IN; Owner: EDINBURGH RADIO)
WNOU (93.1 FM; INDIANAPOLIS, IN; Owner: EMMIS RADIO LICENSE CORPORATION)
WZPL (99.5 FM; GREENFIELD, IN; Owner: MYSTAR COMMUNICATIONS CORPORATION)
WINN (104.9 FM; COLUMBUS, IN; Owner: WHITE RIVER BROADCASTING COMPANY, INC.)
WFMS (95.5 FM; INDIANAPOLIS, IN; Owner: WFMS LICO, INC)
WYXB (105.7 FM; INDIANAPOLIS, IN; Owner: EMMIS RADIO LICENSE CORPORATION)
WFCI (89.5 FM; FRANKLIN, IN; Owner: FRANKLIN COLLEGE OF INDIANA)
WQKC (93.7 FM; SEYMOUR, IN; Owner: S.C.I. BROADCASTING, INC.)
WVNI (95.1 FM; NASHVILLE, IN; Owner: BROWN COUNTY BROADCASTERS, INC.)
WRZQ-FM (107.3 FM; GREENSBURG, IN; Owner: WTRE, INC.)
WAUZ (89.1 FM; GREENSBURG, IN; Owner: GOOD SHEPHERD RADIO INC)
WHHH (96.3 FM; INDIANAPOLIS, IN; Owner: RADIO ONE OF INDIANA, LLC)
WWWY (106.1 FM; NORTH VERNON, IN; Owner: WHITE RIVER BROADCASTING CO., INC.)
WCBK-FM (102.3 FM; MARTINSVILLE, IN; Owner: MID-AMERICA RADIO GROUP, INC.)
WFBQ (94.7 FM; INDIANAPOLIS, IN; Owner: CAPSTAR TX LIMITED PARTNERSHIP)
TV broadcast stations around Edinburgh:
WTTV (Channel 4; BLOOMINGTON, IN; Owner: TRIBUNE BROADCAST HOLDINGS, INC.)
WIPX (Channel 63; BLOOMINGTON, IN; Owner: PAXSON INDIANAPOLIS LICENSE, INC.)
WCLJ (Channel 42; BLOOMINGTON, IN; Owner: TRINITY BROADCASTING OF INDIANA, INC.)
WTIU (Channel 30; BLOOMINGTON, IN; Owner: THE TRUSTEES OF INDIANA UNIVERSITY)
WKOG-LP (Channel 31; INDIANAPOLIS, IN; Owner: KINGDOM OF GOD MINISTRIES, INC.)
WDNI-LP (Channel 65; INDIANAPOLIS, IN; Owner: RADIO ONE OF INDIANA, LLC)
WIPX-LP (Channel 51; INDIANAPOLIS, IN; Owner: PAXSON COMMUNICATIONS LICENSE COMPANY, LLC)
WXIN (Channel 59; INDIANAPOLIS, IN; Owner: TRIBUNE TELEVISION COMPANY)
WISH-TV (Channel 8; INDIANAPOLIS, IN; Owner: INDIANA BROADCASTING, LLC)
WHMB-TV (Channel 40; INDIANAPOLIS, IN; Owner: LESEA BROADCASTING CORPORATION)
WRTV (Channel 6; INDIANAPOLIS, IN; Owner: MCGRAW-HILL BROADCASTING COMPANY, INC.)
WTHR (Channel 13; INDIANAPOLIS, IN; Owner: VIDEOINDIANA, INC.)
WBXI-CA (Channel 47; INDIANAPOLIS, IN; Owner: THE BOX WORLDWIDE LLC)
WFYI (Channel 20; INDIANAPOLIS, IN; Owner: METROPOLITAN INDIANAPOLIS PUBLIC BROADCASTING, INC.)
WTBU-TV (Channel 69; INDIANAPOLIS, IN; Owner: BUTLER UNIVERSITY)
Edinburgh fatal accident statistics for 1975 - 2021
Edinburgh fatal accident list:
Nov 6, 2017 12:34 AM, East Main Cross Street, Lat: 39.354342, Lon: -85.964850, Vehicles: 1, Persons: 1, Fatalities: 1Lat: 39.361872, Lon: -85.953639, Vehicles: 1, Persons: 1, Pedestrians: 1, Fatalities: 1Lat: 39.355125, Lon: -85.983669, Vehicles: 2, Persons: 2, Fatalities: 1Lat: 39.362110, Lon: -85.958490, Vehicles: 2, Persons: 3, Pedestrians: 2, Fatalities: 1Lat: 39.360870, Lon: -85.960740, Vehicles: 1, Persons: 1, Fatalities: 1
National Bridge Inventory (NBI) Statistics 37 Number of bridges607ft / 185m Total length $3,665,000 Total costs385,638 Total average daily traffic44,552 Total average daily truck traffic
New bridges - historical statistics
1 Before 1900 2 1920-1929 5 1940-1949 1 1950-1959 21 1960-1969 4 1970-1979 2 1990-1999 1 2010-2019
See full National Bridge Inventory statistics for Edinburgh, IN
FCC Registered Cell Phone Towers: 3 (
See the full list of FCC Registered Cell Phone Towers in Edinburgh )
FCC Registered Antenna Towers: 84 (
See the full list of FCC Registered Antenna Towers )
FCC Registered Private Land Mobile Towers: 1 (
See the full list of FCC Registered Private Land Mobile Towers in Edinburgh, IN )
FCC Registered Broadcast Land Mobile Towers: 12 (
See the full list of FCC Registered Broadcast Land Mobile Towers )
FCC Registered Microwave Towers: 18 (
See the full list of FCC Registered Microwave Towers in this town )
FCC Registered Paging Towers: 2 (
See the full list of FCC Registered Paging Towers )
FCC Registered Amateur Radio Licenses: 30 (
See the full list of FCC Registered Amateur Radio Licenses in Edinburgh )
FAA Registered Aircraft: 1
Aircraft: CESSNA 172N (Category: Land, Seats: 4, Weight: Up to 12,499 Pounds, Speed: 105 mph), Engine: LYCOMING 0-320 SERIES (180 HP) (Reciprocating)N-Number: 75925, N75925, N-75925, Serial Number: 17268047, Year manufactured: 1976, Airworthiness Date: 11/11/1976, Certificate Issue Date: 11/06/2018Registrant (LLC): A&a Aviation LLC, 8767 S Edinburgh Rd, Edinburgh, IN 46124
Home Mortgage Disclosure Act Aggregated Statistics For Year 2009(Based on 1 full tract) A) FHA, FSA/RHS & VA B) Conventional C) Refinancings D) Home Improvement Loans F) Non-occupant Loans on G) Loans On Manufactured Number Average Value Number Average Value Number Average Value Number Average Value Number Average Value Number Average Value
LOANS ORIGINATED 13 $67,448 4 $56,240 30 $75,885 4 $7,248 7 $52,561 2 $21,495 APPLICATIONS APPROVED, NOT ACCEPTED 0 $0 2 $66,485 5 $54,190 0 $0 1 $32,990 0 $0 APPLICATIONS DENIED 6 $85,317 4 $53,740 25 $74,905 2 $11,500 2 $32,495 0 $0 APPLICATIONS WITHDRAWN 0 $0 2 $158,970 18 $83,150 0 $0 1 $164,970 0 $0 FILES CLOSED FOR INCOMPLETENESS 0 $0 0 $0 2 $82,485 0 $0 0 $0 0 $0
Aggregated Statistics For Year 2008(Based on 1 full tract) A) FHA, FSA/RHS & VA B) Conventional C) Refinancings D) Home Improvement Loans F) Non-occupant Loans on G) Loans On Manufactured Number Average Value Number Average Value Number Average Value Number Average Value Number Average Value Number Average Value
LOANS ORIGINATED 23 $81,592 13 $56,296 37 $92,549 9 $29,439 9 $50,434 0 $0 APPLICATIONS APPROVED, NOT ACCEPTED 0 $0 3 $51,323 5 $57,988 0 $0 2 $57,990 1 $37,990 APPLICATIONS DENIED 6 $61,488 13 $51,989 37 $92,333 11 $23,541 10 $46,991 1 $15,000 APPLICATIONS WITHDRAWN 1 $59,990 5 $72,586 18 $107,145 5 $68,986 1 $78,980 0 $0 FILES CLOSED FOR INCOMPLETENESS 0 $0 0 $0 5 $86,382 1 $45,990 0 $0 0 $0
Aggregated Statistics For Year 2007(Based on 1 full tract) A) FHA, FSA/RHS & VA B) Conventional C) Refinancings D) Home Improvement Loans F) Non-occupant Loans on G) Loans On Manufactured Number Average Value Number Average Value Number Average Value Number Average Value Number Average Value Number Average Value
LOANS ORIGINATED 2 $80,985 31 $73,050 52 $72,851 8 $30,619 21 $50,657 1 $49,990 APPLICATIONS APPROVED, NOT ACCEPTED 0 $0 3 $94,980 14 $56,417 1 $12,000 3 $73,320 1 $40,990 APPLICATIONS DENIED 2 $111,980 24 $53,698 71 $81,111 24 $59,571 8 $62,488 7 $32,279 APPLICATIONS WITHDRAWN 0 $0 9 $58,543 34 $81,043 2 $80,485 2 $34,495 0 $0 FILES CLOSED FOR INCOMPLETENESS 0 $0 1 $64,990 9 $99,758 0 $0 1 $115,980 0 $0
Aggregated Statistics For Year 2006(Based on 1 full tract) A) FHA, FSA/RHS & VA B) Conventional C) Refinancings D) Home Improvement Loans E) Loans on Dwellings For 5+ Families F) Non-occupant Loans on G) Loans On Manufactured Number Average Value Number Average Value Number Average Value Number Average Value Number Average Value Number Average Value Number Average Value
LOANS ORIGINATED 8 $74,110 49 $71,006 63 $62,845 16 $27,807 1 $89,980 17 $66,281 2 $58,990 APPLICATIONS APPROVED, NOT ACCEPTED 1 $57,990 7 $117,976 9 $65,098 3 $77,317 0 $0 1 $87,980 1 $18,000 APPLICATIONS DENIED 1 $119,980 15 $74,719 81 $82,811 13 $35,147 0 $0 5 $58,188 4 $47,740 APPLICATIONS WITHDRAWN 0 $0 12 $116,810 42 $83,317 3 $61,987 0 $0 3 $48,323 1 $38,990 FILES CLOSED FOR INCOMPLETENESS 0 $0 4 $88,482 5 $90,382 0 $0 0 $0 0 $0 0 $0
Aggregated Statistics For Year 2005(Based on 1 full tract) A) FHA, FSA/RHS & VA B) Conventional C) Refinancings D) Home Improvement Loans F) Non-occupant Loans on G) Loans On Manufactured Number Average Value Number Average Value Number Average Value Number Average Value Number Average Value Number Average Value
LOANS ORIGINATED 10 $72,985 52 $59,892 76 $73,683 9 $17,330 17 $51,989 3 $21,330 APPLICATIONS APPROVED, NOT ACCEPTED 2 $81,485 3 $72,320 12 $78,734 0 $0 0 $0 1 $25,000 APPLICATIONS DENIED 0 $0 26 $57,873 109 $86,368 16 $19,809 5 $44,192 13 $43,376 APPLICATIONS WITHDRAWN 1 $66,990 12 $104,062 37 $90,009 9 $115,866 3 $138,973 0 $0 FILES CLOSED FOR INCOMPLETENESS 0 $0 0 $0 20 $80,734 0 $0 0 $0 0 $0
Aggregated Statistics For Year 2004(Based on 1 full tract) A) FHA, FSA/RHS & VA B) Conventional C) Refinancings D) Home Improvement Loans E) Loans on Dwellings For 5+ Families F) Non-occupant Loans on G) Loans On Manufactured Number Average Value Number Average Value Number Average Value Number Average Value Number Average Value Number Average Value Number Average Value
LOANS ORIGINATED 5 $69,786 36 $70,097 86 $77,020 17 $48,578 1 $229,950 13 $61,988 7 $46,561 APPLICATIONS APPROVED, NOT ACCEPTED 2 $64,485 6 $78,818 32 $87,701 2 $80,985 0 $0 2 $84,985 3 $31,327 APPLICATIONS DENIED 0 $0 16 $48,303 90 $83,194 15 $26,395 0 $0 5 $99,980 11 $35,265 APPLICATIONS WITHDRAWN 1 $60,990 1 $137,970 41 $79,009 3 $39,993 0 $0 0 $0 0 $0 FILES CLOSED FOR INCOMPLETENESS 2 $100,480 0 $0 14 $85,269 0 $0 0 $0 0 $0 0 $0
Aggregated Statistics For Year 2003(Based on 1 full tract) A) FHA, FSA/RHS & VA B) Conventional C) Refinancings D) Home Improvement Loans E) Loans on Dwellings For 5+ Families F) Non-occupant Loans on Number Average Value Number Average Value Number Average Value Number Average Value Number Average Value Number Average Value
LOANS ORIGINATED 7 $76,127 22 $69,032 161 $71,433 11 $30,721 1 $44,990 22 $63,305 APPLICATIONS APPROVED, NOT ACCEPTED 1 $87,980 2 $47,490 24 $76,985 2 $8,000 0 $0 3 $51,657 APPLICATIONS DENIED 2 $71,485 10 $57,189 84 $85,281 8 $9,498 0 $0 2 $55,990 APPLICATIONS WITHDRAWN 1 $68,990 1 $75,980 48 $87,087 1 $4,000 0 $0 3 $66,653 FILES CLOSED FOR INCOMPLETENESS 1 $68,990 0 $0 9 $77,762 0 $0 0 $0 0 $0
Aggregated Statistics For Year 2002(Based on 1 full tract) A) FHA, FSA/RHS & VA B) Conventional C) Refinancings D) Home Improvement Loans F) Non-occupant Loans on Number Average Value Number Average Value Number Average Value Number Average Value Number Average Value
LOANS ORIGINATED 14 $78,413 24 $70,152 107 $64,211 9 $15,663 10 $53,789 APPLICATIONS APPROVED, NOT ACCEPTED 0 $0 5 $62,988 31 $76,017 2 $23,495 1 $44,990 APPLICATIONS DENIED 3 $48,323 22 $45,718 60 $78,168 13 $22,611 4 $43,990 APPLICATIONS WITHDRAWN 1 $86,980 2 $27,495 30 $79,951 3 $20,330 1 $51,990 FILES CLOSED FOR INCOMPLETENESS 0 $0 1 $10,000 6 $73,818 0 $0 0 $0
Aggregated Statistics For Year 2001(Based on 1 full tract) A) FHA, FSA/RHS & VA B) Conventional C) Refinancings D) Home Improvement Loans F) Non-occupant Loans on Number Average Value Number Average Value Number Average Value Number Average Value Number Average Value
LOANS ORIGINATED 20 $73,686 22 $60,897 88 $71,145 10 $13,097 8 $53,489 APPLICATIONS APPROVED, NOT ACCEPTED 0 $0 5 $56,588 19 $70,407 2 $31,495 0 $0 APPLICATIONS DENIED 2 $94,480 28 $36,386 78 $70,883 10 $10,898 3 $49,323 APPLICATIONS WITHDRAWN 3 $84,983 6 $90,482 33 $65,623 1 $3,000 0 $0 FILES CLOSED FOR INCOMPLETENESS 1 $66,990 1 $30,990 7 $69,700 0 $0 0 $0
Aggregated Statistics For Year 2000(Based on 1 full tract) A) FHA, FSA/RHS & VA B) Conventional C) Refinancings D) Home Improvement Loans F) Non-occupant Loans on Number Average Value Number Average Value Number Average Value Number Average Value Number Average Value
LOANS ORIGINATED 14 $61,488 18 $53,823 44 $59,511 11 $18,542 7 $67,559 APPLICATIONS APPROVED, NOT ACCEPTED 0 $0 4 $61,238 23 $60,944 12 $17,913 3 $46,990 APPLICATIONS DENIED 1 $83,980 32 $35,680 53 $64,478 11 $10,180 1 $35,990 APPLICATIONS WITHDRAWN 1 $50,990 3 $71,987 20 $67,686 0 $0 1 $88,980 FILES CLOSED FOR INCOMPLETENESS 0 $0 1 $74,980 5 $59,388 0 $0 0 $0
Aggregated Statistics For Year 1999(Based on 1 full tract) A) FHA, FSA/RHS & VA B) Conventional C) Refinancings D) Home Improvement Loans F) Non-occupant Loans on Number Average Value Number Average Value Number Average Value Number Average Value Number Average Value
LOANS ORIGINATED 20 $73,878 22 $81,255 67 $56,204 10 $9,073 7 $28,486 APPLICATIONS APPROVED, NOT ACCEPTED 2 $85,245 10 $53,140 25 $48,654 3 $16,617 1 $28,910 APPLICATIONS DENIED 2 $61,815 59 $41,198 60 $55,666 30 $8,873 2 $10,470 APPLICATIONS WITHDRAWN 1 $67,800 10 $87,238 36 $75,994 0 $0 2 $39,380 FILES CLOSED FOR INCOMPLETENESS 0 $0 3 $64,473 6 $59,488 0 $0 1 $35,890
Detailed HMDA statistics for the following Tracts:
6113.00
Private Mortgage Insurance Companies Aggregated Statistics For Year 2009(Based on 1 full tract) A) Conventional B) Refinancings Number Average Value Number Average Value
LOANS ORIGINATED 1 $63,990 2 $63,485 APPLICATIONS APPROVED, NOT ACCEPTED 0 $0 1 $72,990 APPLICATIONS DENIED 0 $0 0 $0 APPLICATIONS WITHDRAWN 0 $0 0 $0 FILES CLOSED FOR INCOMPLETENESS 0 $0 0 $0
Aggregated Statistics For Year 2008(Based on 1 full tract) A) Conventional B) Refinancings C) Non-occupant Loans on Number Average Value Number Average Value Number Average Value
LOANS ORIGINATED 5 $78,384 3 $84,317 1 $41,990 APPLICATIONS APPROVED, NOT ACCEPTED 4 $95,730 4 $109,478 0 $0 APPLICATIONS DENIED 0 $0 0 $0 0 $0 APPLICATIONS WITHDRAWN 0 $0 0 $0 0 $0 FILES CLOSED FOR INCOMPLETENESS 0 $0 1 $103,980 0 $0
Aggregated Statistics For Year 2007(Based on 1 full tract) A) Conventional B) Refinancings C) Non-occupant Loans on Number Average Value Number Average Value Number Average Value
LOANS ORIGINATED 24 $68,528 8 $126,475 3 $45,323 APPLICATIONS APPROVED, NOT ACCEPTED 1 $76,980 0 $0 0 $0 APPLICATIONS DENIED 1 $32,990 1 $125,970 1 $32,990 APPLICATIONS WITHDRAWN 2 $88,480 1 $116,980 0 $0 FILES CLOSED FOR INCOMPLETENESS 0 $0 0 $0 0 $0
Aggregated Statistics For Year 2006(Based on 1 full tract) A) Conventional B) Refinancings C) Non-occupant Loans on Number Average Value Number Average Value Number Average Value
LOANS ORIGINATED 16 $75,922 1 $112,980 2 $65,485 APPLICATIONS APPROVED, NOT ACCEPTED 4 $74,235 1 $109,980 0 $0 APPLICATIONS DENIED 0 $0 0 $0 0 $0 APPLICATIONS WITHDRAWN 1 $45,990 0 $0 0 $0 FILES CLOSED FOR INCOMPLETENESS 0 $0 0 $0 0 $0
Aggregated Statistics For Year 2005(Based on 1 full tract) A) Conventional B) Refinancings C) Non-occupant Loans on Number Average Value Number Average Value Number Average Value
LOANS ORIGINATED 11 $60,625 5 $77,184 2 $57,490 APPLICATIONS APPROVED, NOT ACCEPTED 2 $85,985 3 $97,647 0 $0 APPLICATIONS DENIED 0 $0 0 $0 0 $0 APPLICATIONS WITHDRAWN 2 $57,990 1 $67,990 0 $0 FILES CLOSED FOR INCOMPLETENESS 0 $0 0 $0 0 $0
Aggregated Statistics For Year 2004(Based on 1 full tract) A) Conventional B) Refinancings C) Non-occupant Loans on Number Average Value Number Average Value Number Average Value
LOANS ORIGINATED 11 $77,621 14 $89,839 1 $44,990 APPLICATIONS APPROVED, NOT ACCEPTED 1 $67,990 3 $70,987 0 $0 APPLICATIONS DENIED 0 $0 0 $0 0 $0 APPLICATIONS WITHDRAWN 0 $0 1 $66,990 0 $0 FILES CLOSED FOR INCOMPLETENESS 0 $0 1 $77,980 0 $0
Aggregated Statistics For Year 2003(Based on 1 full tract) A) Conventional B) Refinancings C) Non-occupant Loans on Number Average Value Number Average Value Number Average Value
LOANS ORIGINATED 10 $75,385 23 $85,939 1 $49,990 APPLICATIONS APPROVED, NOT ACCEPTED 0 $0 11 $98,253 0 $0 APPLICATIONS DENIED 0 $0 0 $0 0 $0 APPLICATIONS WITHDRAWN 0 $0 1 $67,990 0 $0 FILES CLOSED FOR INCOMPLETENESS 0 $0 1 $70,990 0 $0
Aggregated Statistics For Year 2002(Based on 1 full tract) A) Conventional B) Refinancings C) Non-occupant Loans on Number Average Value Number Average Value Number Average Value
LOANS ORIGINATED 9 $80,983 16 $78,922 1 $23,000 APPLICATIONS APPROVED, NOT ACCEPTED 1 $130,970 4 $74,235 0 $0 APPLICATIONS DENIED 2 $57,990 0 $0 0 $0 APPLICATIONS WITHDRAWN 0 $0 3 $93,647 1 $79,980 FILES CLOSED FOR INCOMPLETENESS 0 $0 0 $0 0 $0
Aggregated Statistics For Year 2001(Based on 1 full tract) A) Conventional B) Refinancings Number Average Value Number Average Value
LOANS ORIGINATED 6 $76,818 7 $75,556 APPLICATIONS APPROVED, NOT ACCEPTED 0 $0 5 $73,386 APPLICATIONS DENIED 0 $0 0 $0 APPLICATIONS WITHDRAWN 0 $0 0 $0 FILES CLOSED FOR INCOMPLETENESS 0 $0 0 $0
Aggregated Statistics For Year 2000(Based on 1 full tract) A) Conventional B) Refinancings Number Average Value Number Average Value
LOANS ORIGINATED 3 $56,990 6 $77,818 APPLICATIONS APPROVED, NOT ACCEPTED 1 $108,980 0 $0 APPLICATIONS DENIED 0 $0 0 $0 APPLICATIONS WITHDRAWN 0 $0 1 $94,980 FILES CLOSED FOR INCOMPLETENESS 0 $0 0 $0
Aggregated Statistics For Year 1999(Based on 1 full tract) A) Conventional B) Refinancings C) Non-occupant Loans on Number Average Value Number Average Value Number Average Value
LOANS ORIGINATED 11 $75,954 8 $69,416 0 $0 APPLICATIONS APPROVED, NOT ACCEPTED 1 $134,600 1 $105,680 0 $0 APPLICATIONS DENIED 0 $0 0 $0 0 $0 APPLICATIONS WITHDRAWN 1 $22,930 0 $0 1 $22,930 FILES CLOSED FOR INCOMPLETENESS 0 $0 0 $0 0 $0
Detailed PMIC statistics for the following Tracts:
6113.00
Fire-safe hotels and motels in Edinburgh, Indiana:
Best Western Edinburgh/Columbus, 11780 N US Hwy 31, Edinburgh, Indiana 46124 Phone: (812) 526-9883
Comfort Inn, 11711 N US 31, Edinburgh, Indiana 46124 Phone: (812) 526-9899, Fax: (812) 526-4185
Hampton Inn, 12161 N US 31, Edinburgh, Indiana 46124 Phone: (812) 526-5100, Fax: (812) 526-3818
Hilton Garden Inn, 12210 N Executive Dr, Edinburgh, Indiana 46124 Phone: (812) 526-8600, Fax: (812) 526-9337
Holiday Inn Express & Suites Columbus Edinburgh, 12225 N Executive Dr, Edinburgh, Indiana 46124 Phone: (812) 526-4919
All 5 fire-safe hotels and motels in Edinburgh, Indiana
Most common first names in Edinburgh, IN among deceased individuals Name Count Lived (average)
Mary 60 79.2 years William 45 69.3 years James 43 72.9 years John 42 72.9 years Charles 38 71.6 years Robert 33 71.5 years Donald 23 67.6 years Earl 18 70.1 years Paul 17 71.7 years Harold 17 72.1 years
Most common last names in Edinburgh, IN among deceased individuals Last name Count Lived (average)
Burton 88 68.4 years Smith 29 73.5 years Streeval 23 69.8 years Williams 21 76.2 years Brown 21 78.0 years Johnson 17 71.4 years Thompson 15 66.6 years Bryant 15 64.2 years Miller 14 75.4 years Jones 13 71.6 years
Edinburgh compared to Indiana state average:
Unemployed percentage below state average. Black race population percentage significantly below state average. Hispanic race population percentage significantly below state average. Foreign-born population percentage significantly below state average. Percentage of population with a bachelor's degree or higher below state average.
Top Patent Applicants
Timothy Andrew Woods (6)
John D. Crofts (4)
Gregory S. Franks (3)
Mike Mccullough (2)
Gregory Scott Franks (1)
John G. Allman (1)
Maria R. Swift (1)
Rickey Albert Mackey (1)
Total of 18 patent applications in 2008-2024.

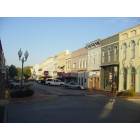
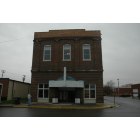
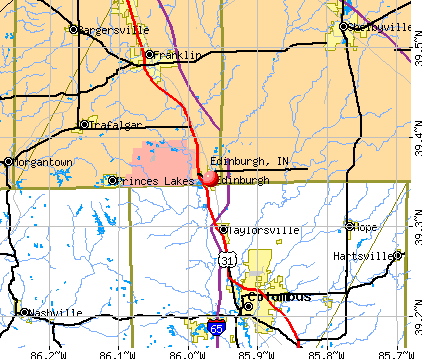


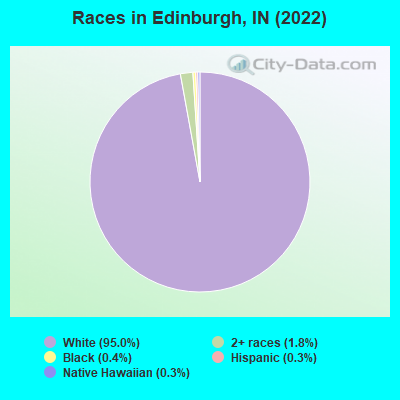

 Recent articles from our blog. Our writers, many of them Ph.D. graduates or candidates, create easy-to-read articles on a wide variety of topics.

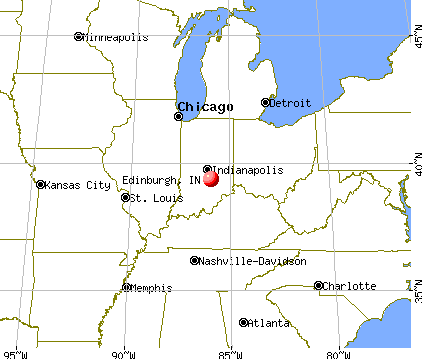
 (31.8 miles
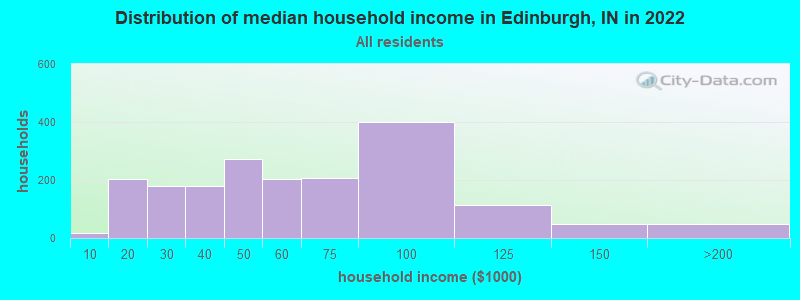
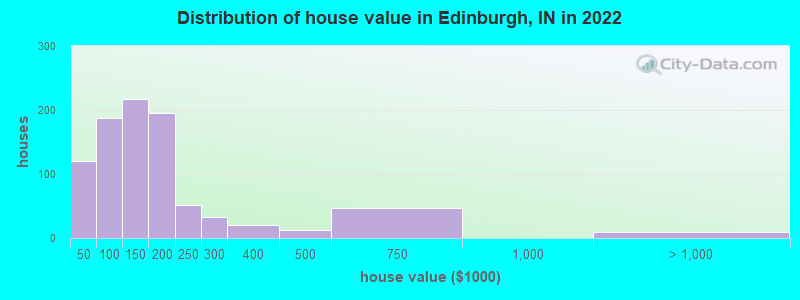

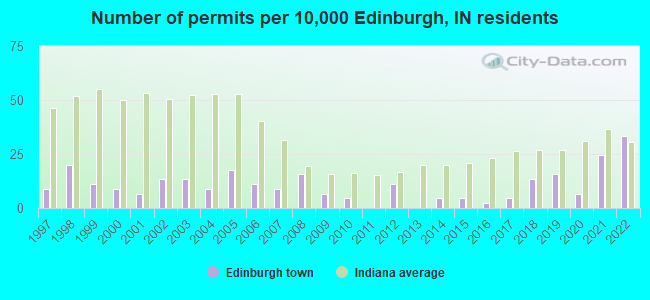
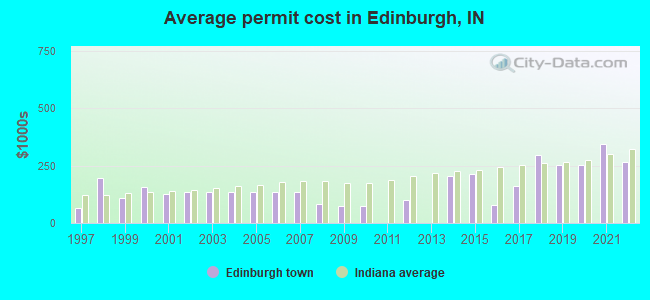
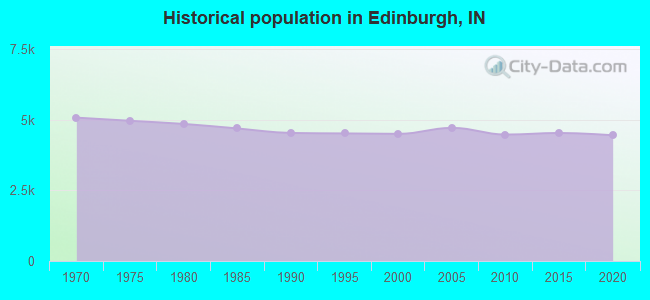
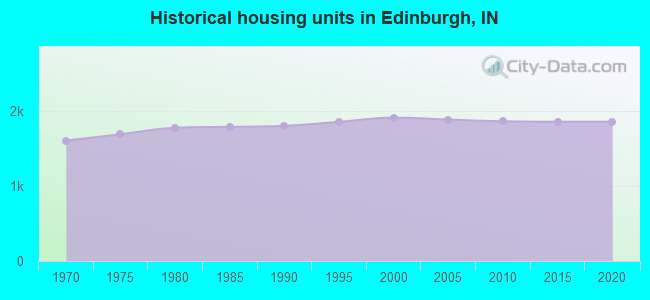
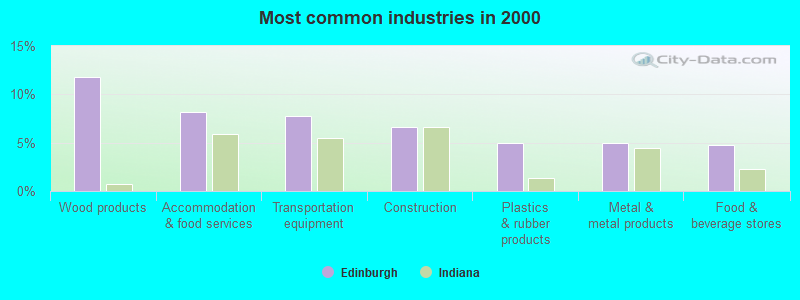
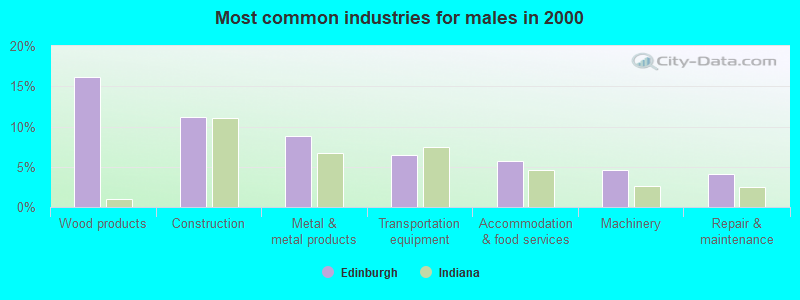
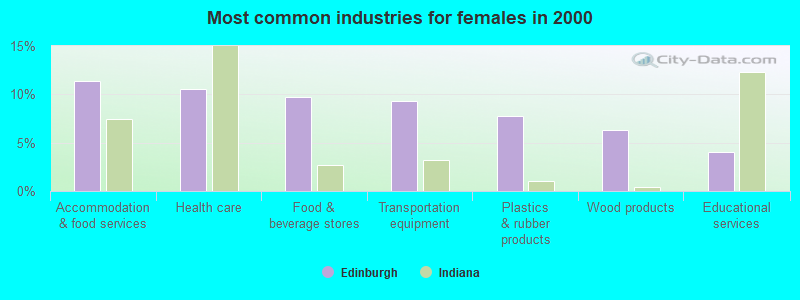
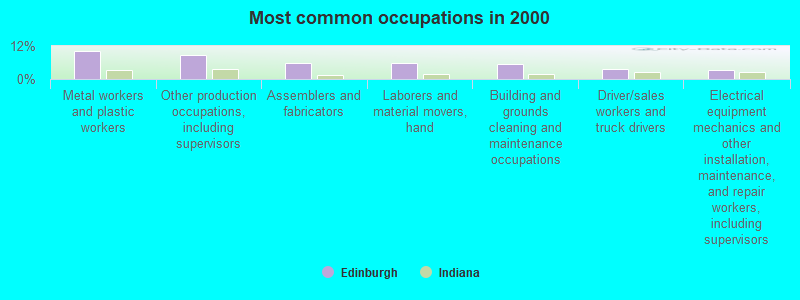
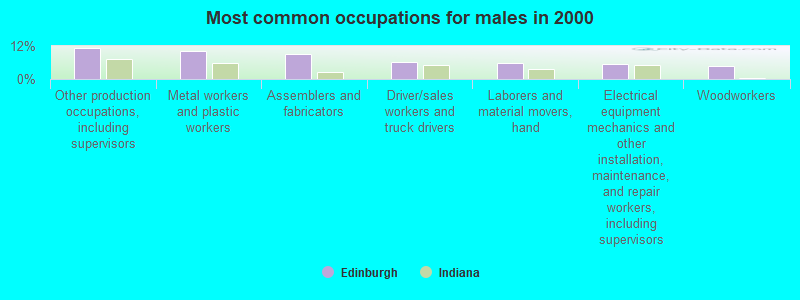
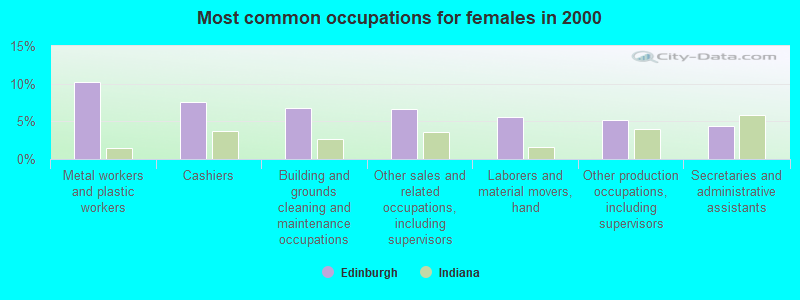


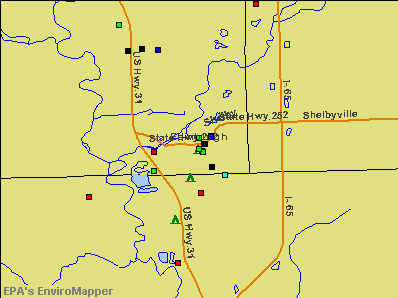

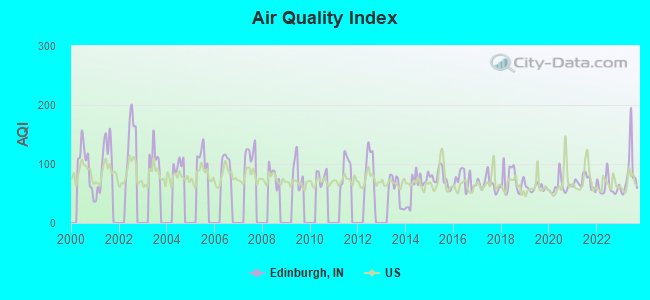
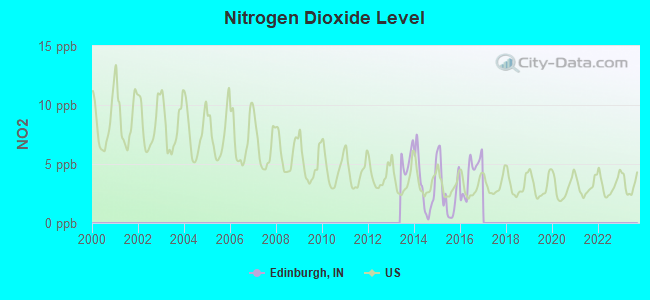
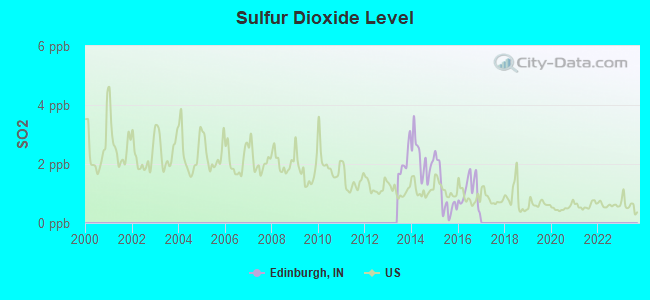
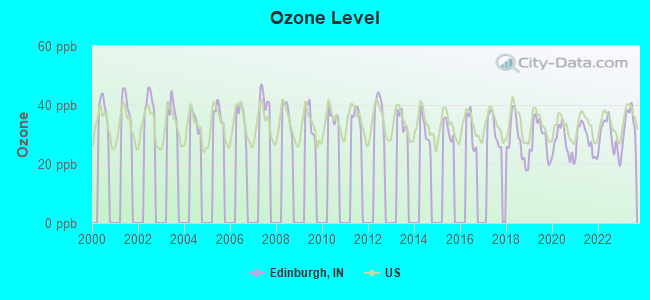
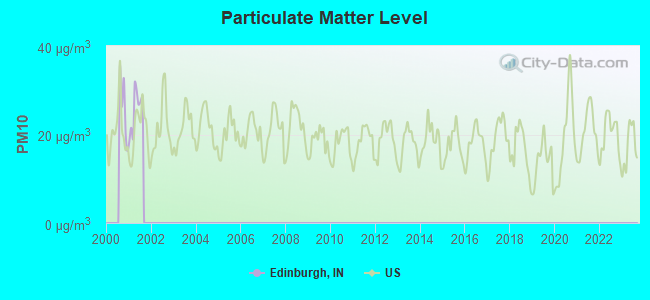
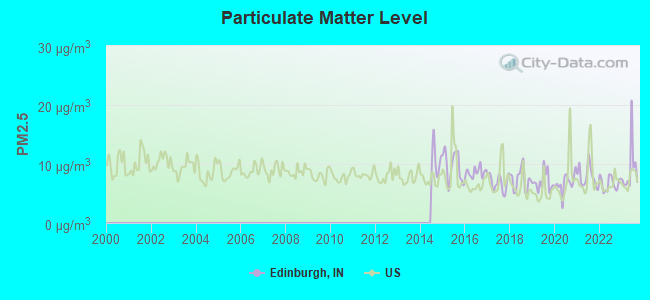

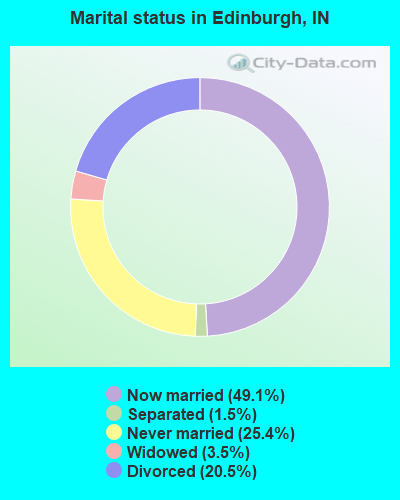
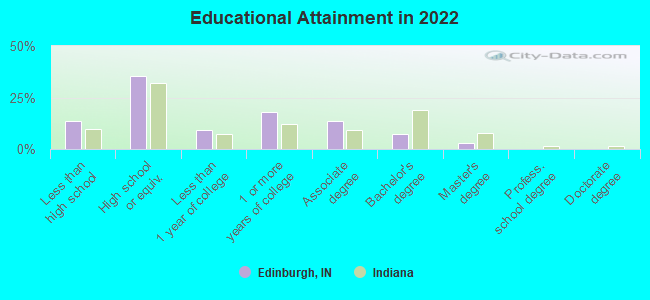
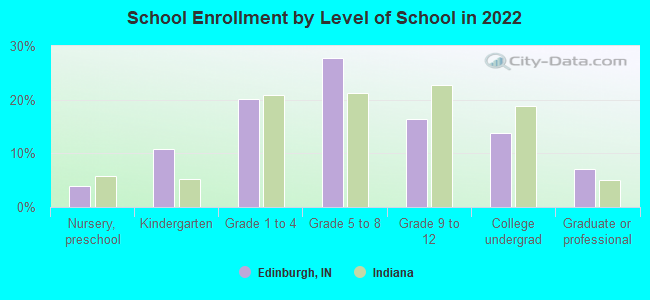
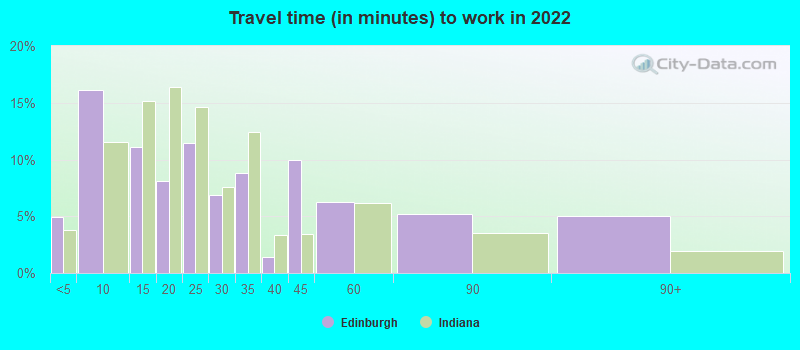
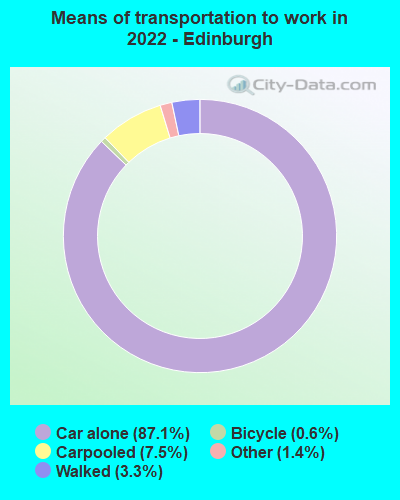
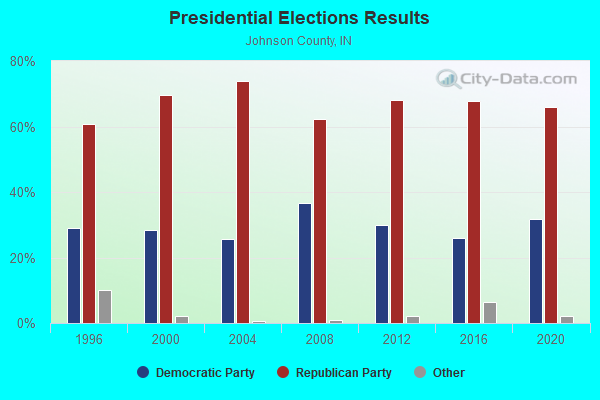
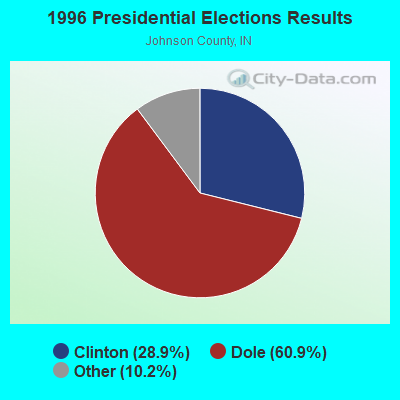


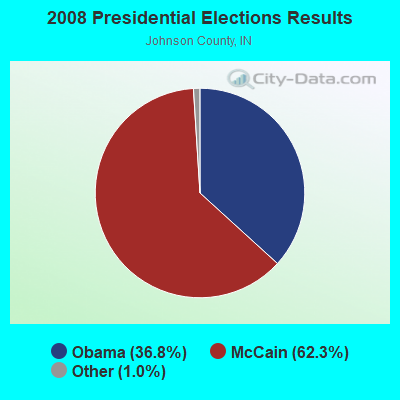
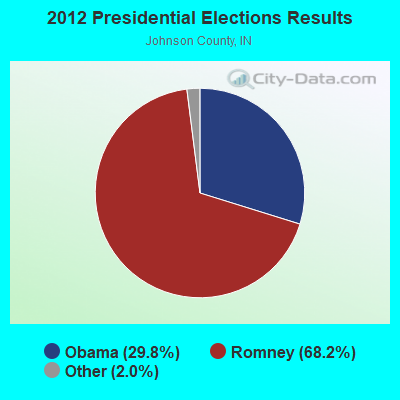
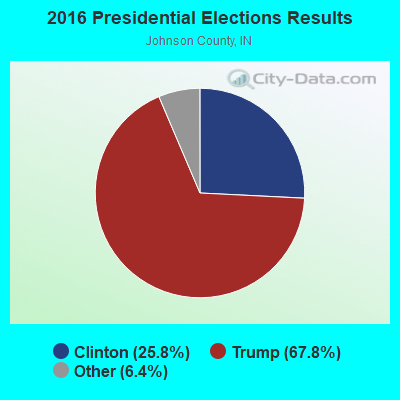
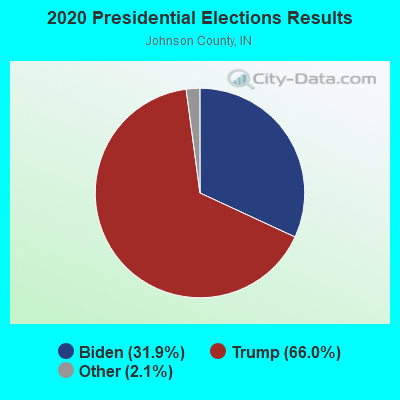
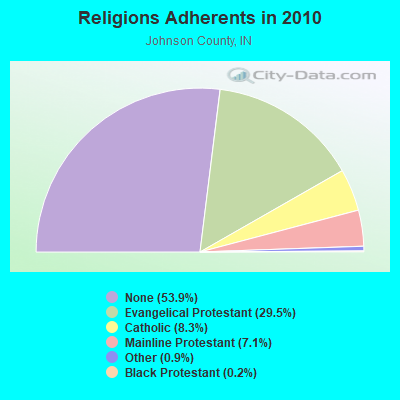
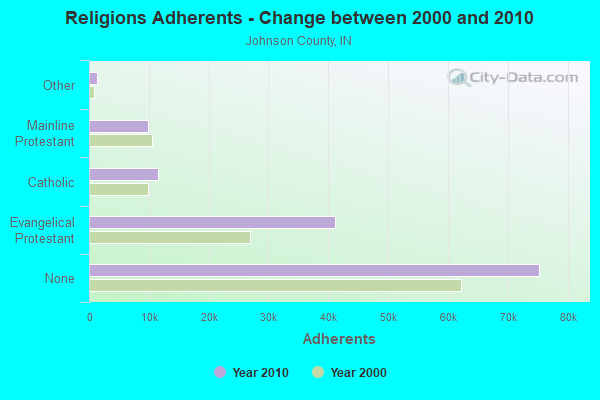
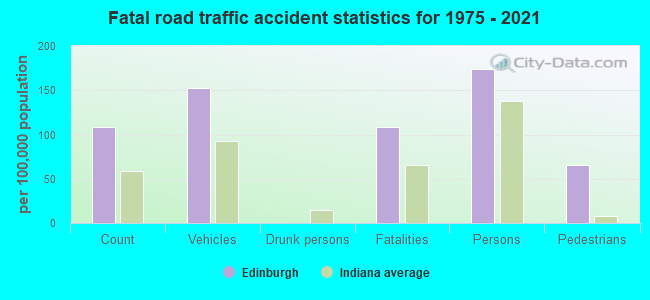
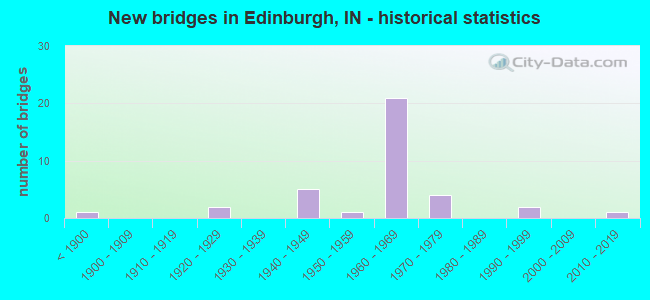
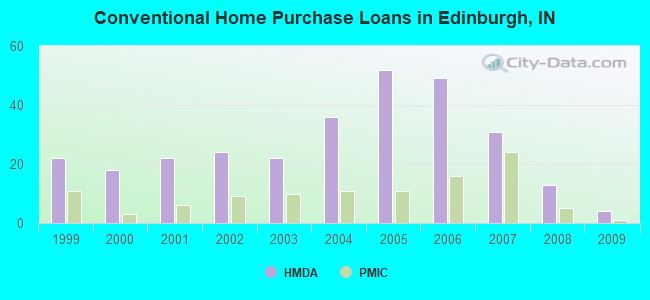
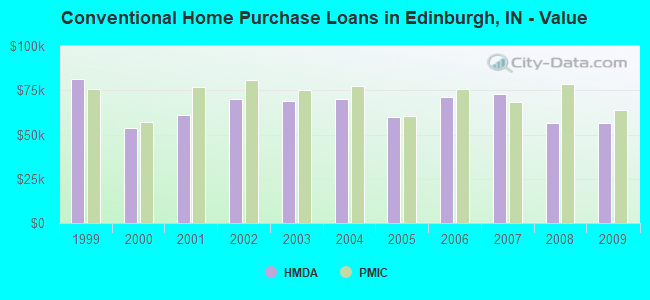
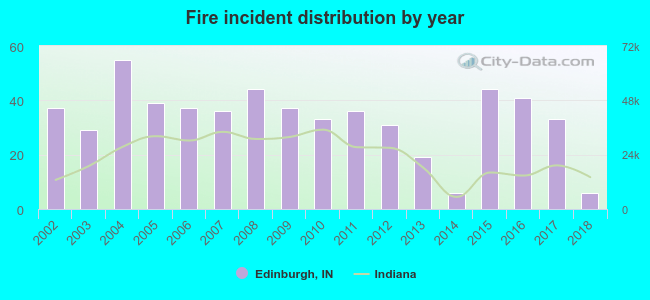 According to the data from the years 2002 - 2018 the average number of fire incidents per year is 33. The highest number of fires - 55 took place in 2004, and the least - 6 in 2014. The data has a declining trend.
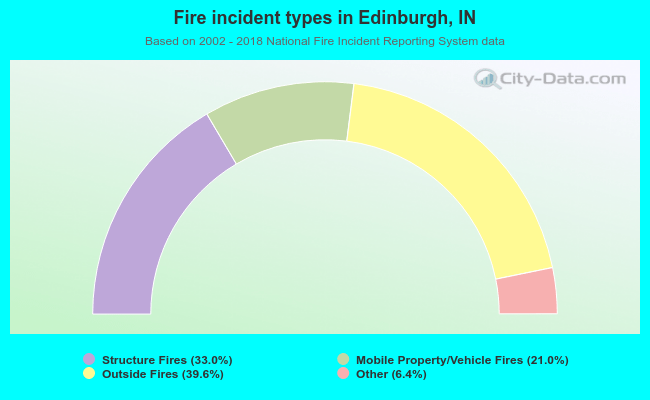 When looking into fire subcategories, the most incidents belonged to: Outside Fires (39.6%), and Structure Fires (33.0%).