Spring Lake Heights, New Jersey Submit your own pictures of this borough and show them to the world
OSM Map
General Map
Google Map
MSN Map
OSM Map
General Map
Google Map
MSN Map
OSM Map
General Map
Google Map
MSN Map
OSM Map
General Map
Google Map
MSN Map
Please wait while loading the map...
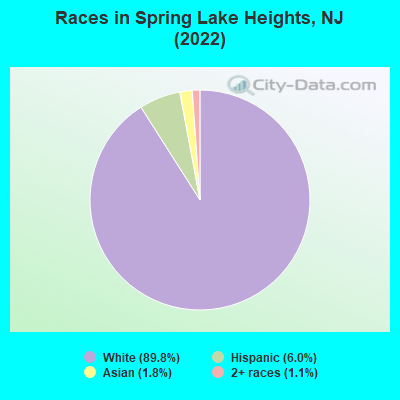
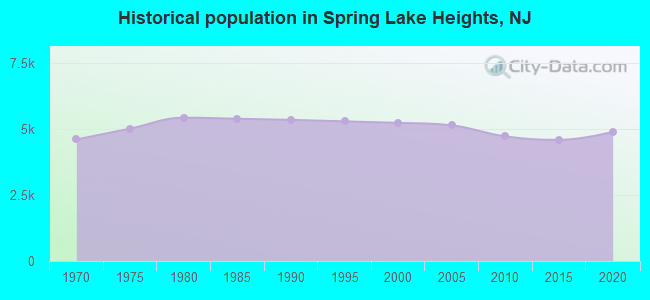
Population in 2022: 4,865 (100% urban, 0% rural). Population change since 2000: -6.9%Males: 2,201 Females: 2,664
March 2022 cost of living index in Spring Lake Heights: 122.3 (high, U.S. average is 100) Percentage of residents living in poverty in 2022: 3.7%for White Non-Hispanic residents , 22.3% for Hispanic or Latino residents , 22.9% for two or more races residents )Business Search - 14 Million verified businesses
Data:
Median household income ($)
Median household income (% change since 2000)
Household income diversity
Ratio of average income to average house value (%)
Ratio of average income to average rent
Median household income ($) - White
Median household income ($) - Black or African American
Median household income ($) - Asian
Median household income ($) - Hispanic or Latino
Median household income ($) - American Indian and Alaska Native
Median household income ($) - Multirace
Median household income ($) - Other Race
Median household income for houses/condos with a mortgage ($)
Median household income for apartments without a mortgage ($)
Races - White alone (%)
Races - White alone (% change since 2000)
Races - Black alone (%)
Races - Black alone (% change since 2000)
Races - American Indian alone (%)
Races - American Indian alone (% change since 2000)
Races - Asian alone (%)
Races - Asian alone (% change since 2000)
Races - Hispanic (%)
Races - Hispanic (% change since 2000)
Races - Native Hawaiian and Other Pacific Islander alone (%)
Races - Native Hawaiian and Other Pacific Islander alone (% change since 2000)
Races - Two or more races (%)
Races - Two or more races (% change since 2000)
Races - Other race alone (%)
Races - Other race alone (% change since 2000)
Racial diversity
Unemployment (%)
Unemployment (% change since 2000)
Unemployment (%) - White
Unemployment (%) - Black or African American
Unemployment (%) - Asian
Unemployment (%) - Hispanic or Latino
Unemployment (%) - American Indian and Alaska Native
Unemployment (%) - Multirace
Unemployment (%) - Other Race
Population density (people per square mile)
Population - Males (%)
Population - Females (%)
Population - Males (%) - White
Population - Males (%) - Black or African American
Population - Males (%) - Asian
Population - Males (%) - Hispanic or Latino
Population - Males (%) - American Indian and Alaska Native
Population - Males (%) - Multirace
Population - Males (%) - Other Race
Population - Females (%) - White
Population - Females (%) - Black or African American
Population - Females (%) - Asian
Population - Females (%) - Hispanic or Latino
Population - Females (%) - American Indian and Alaska Native
Population - Females (%) - Multirace
Population - Females (%) - Other Race
Coronavirus confirmed cases (Jun 10, 2024)
Deaths caused by coronavirus (Jun 10, 2024)
Coronavirus confirmed cases (per 100k population) (Jun 10, 2024)
Deaths caused by coronavirus (per 100k population) (Jun 10, 2024)
Daily increase in number of cases (Jun 10, 2024)
Weekly increase in number of cases (Jun 10, 2024)
Cases doubled (in days) (Jun 10, 2024)
Hospitalized patients (Apr 18, 2022)
Negative test results (Apr 18, 2022)
Total test results (Apr 18, 2022)
COVID Vaccine doses distributed (per 100k population) (Sep 19, 2023)
COVID Vaccine doses administered (per 100k population) (Sep 19, 2023)
COVID Vaccine doses distributed (Sep 19, 2023)
COVID Vaccine doses administered (Sep 19, 2023)
Likely homosexual households (%)
Likely homosexual households (% change since 2000)
Likely homosexual households - Lesbian couples (%)
Likely homosexual households - Lesbian couples (% change since 2000)
Likely homosexual households - Gay men (%)
Likely homosexual households - Gay men (% change since 2000)
Cost of living index
Median gross rent ($)
Median contract rent ($)
Median monthly housing costs ($)
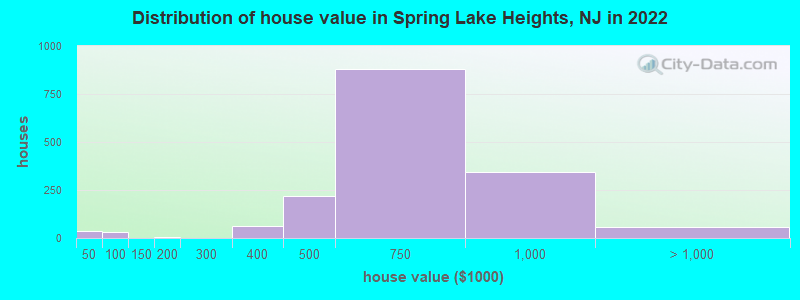
Median house or condo value ($)
Median house or condo value ($ change since 2000)
Mean house or condo value by units in structure - 1, detached ($)
Mean house or condo value by units in structure - 1, attached ($)
Mean house or condo value by units in structure - 2 ($)
Mean house or condo value by units in structure by units in structure - 3 or 4 ($)
Mean house or condo value by units in structure - 5 or more ($)
Mean house or condo value by units in structure - Boat, RV, van, etc. ($)
Mean house or condo value by units in structure - Mobile home ($)
Median house or condo value ($) - White
Median house or condo value ($) - Black or African American
Median house or condo value ($) - Asian
Median house or condo value ($) - Hispanic or Latino
Median house or condo value ($) - American Indian and Alaska Native
Median house or condo value ($) - Multirace
Median house or condo value ($) - Other Race
Median resident age
Resident age diversity
Median resident age - Males
Median resident age - Females
Median resident age - White
Median resident age - Black or African American
Median resident age - Asian
Median resident age - Hispanic or Latino
Median resident age - American Indian and Alaska Native
Median resident age - Multirace
Median resident age - Other Race
Median resident age - Males - White
Median resident age - Males - Black or African American
Median resident age - Males - Asian
Median resident age - Males - Hispanic or Latino
Median resident age - Males - American Indian and Alaska Native
Median resident age - Males - Multirace
Median resident age - Males - Other Race
Median resident age - Females - White
Median resident age - Females - Black or African American
Median resident age - Females - Asian
Median resident age - Females - Hispanic or Latino
Median resident age - Females - American Indian and Alaska Native
Median resident age - Females - Multirace
Median resident age - Females - Other Race
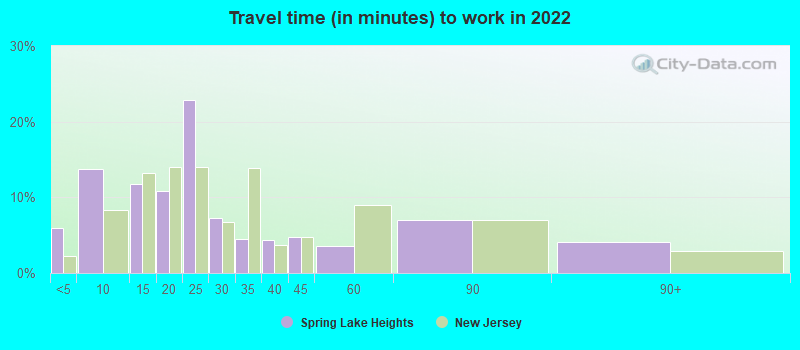
Commute - mean travel time to work (minutes)
Travel time to work - Less than 5 minutes (%)
Travel time to work - Less than 5 minutes (% change since 2000)
Travel time to work - 5 to 9 minutes (%)
Travel time to work - 5 to 9 minutes (% change since 2000)
Travel time to work - 10 to 19 minutes (%)
Travel time to work - 10 to 19 minutes (% change since 2000)
Travel time to work - 20 to 29 minutes (%)
Travel time to work - 20 to 29 minutes (% change since 2000)
Travel time to work - 30 to 39 minutes (%)
Travel time to work - 30 to 39 minutes (% change since 2000)
Travel time to work - 40 to 59 minutes (%)
Travel time to work - 40 to 59 minutes (% change since 2000)
Travel time to work - 60 to 89 minutes (%)
Travel time to work - 60 to 89 minutes (% change since 2000)
Travel time to work - 90 or more minutes (%)
Travel time to work - 90 or more minutes (% change since 2000)
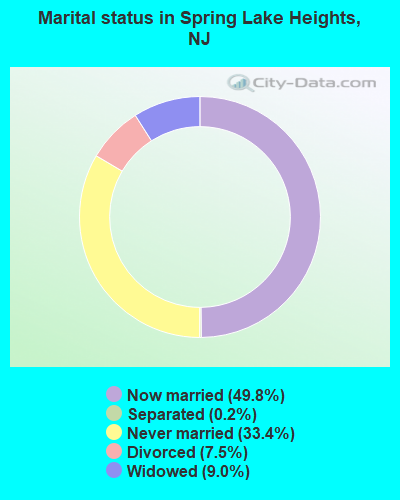
Marital status - Never married (%)
Marital status - Now married (%)
Marital status - Separated (%)
Marital status - Widowed (%)
Marital status - Divorced (%)
Median family income ($)
Median family income (% change since 2000)
Median non-family income ($)
Median non-family income (% change since 2000)
Median per capita income ($)
Median per capita income (% change since 2000)
Median family income ($) - White
Median family income ($) - Black or African American
Median family income ($) - Asian
Median family income ($) - Hispanic or Latino
Median family income ($) - American Indian and Alaska Native
Median family income ($) - Multirace
Median family income ($) - Other Race
Median year house/condo built
Median year apartment built
Year house built - Built 2005 or later (%)
Year house built - Built 2000 to 2004 (%)
Year house built - Built 1990 to 1999 (%)
Year house built - Built 1980 to 1989 (%)
Year house built - Built 1970 to 1979 (%)
Year house built - Built 1960 to 1969 (%)
Year house built - Built 1950 to 1959 (%)
Year house built - Built 1940 to 1949 (%)
Year house built - Built 1939 or earlier (%)
Average household size
Household density (households per square mile)
Average household size - White
Average household size - Black or African American
Average household size - Asian
Average household size - Hispanic or Latino
Average household size - American Indian and Alaska Native
Average household size - Multirace
Average household size - Other Race
Occupied housing units (%)
Vacant housing units (%)
Owner occupied housing units (%)
Renter occupied housing units (%)
Vacancy status - For rent (%)
Vacancy status - For sale only (%)
Vacancy status - Rented or sold, not occupied (%)
Vacancy status - For seasonal, recreational, or occasional use (%)
Vacancy status - For migrant workers (%)
Vacancy status - Other vacant (%)
Residents with income below the poverty level (%)
Residents with income below 50% of the poverty level (%)
Children below poverty level (%)
Poor families by family type - Married-couple family (%)
Poor families by family type - Male, no wife present (%)
Poor families by family type - Female, no husband present (%)
Poverty status for native-born residents (%)
Poverty status for foreign-born residents (%)
Poverty among high school graduates not in families (%)
Poverty among people who did not graduate high school not in families (%)
Residents with income below the poverty level (%) - White
Residents with income below the poverty level (%) - Black or African American
Residents with income below the poverty level (%) - Asian
Residents with income below the poverty level (%) - Hispanic or Latino
Residents with income below the poverty level (%) - American Indian and Alaska Native
Residents with income below the poverty level (%) - Multirace
Residents with income below the poverty level (%) - Other Race
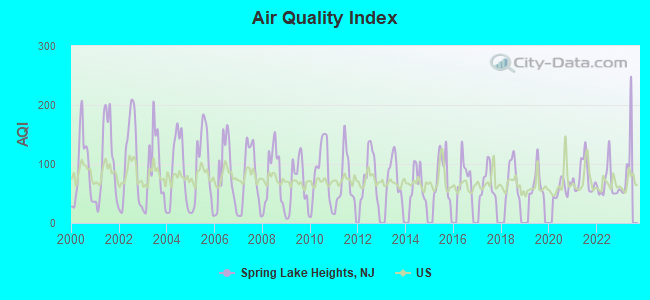
Air pollution - Air Quality Index (AQI)
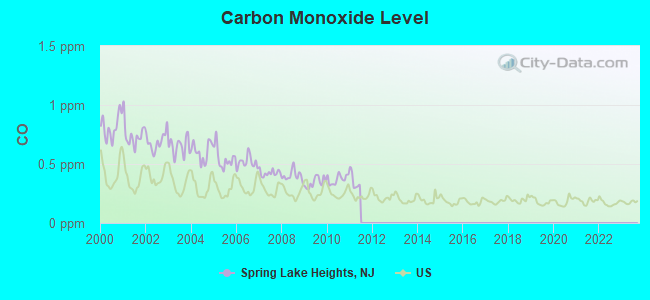
Air pollution - CO
Air pollution - NO2
Air pollution - SO2
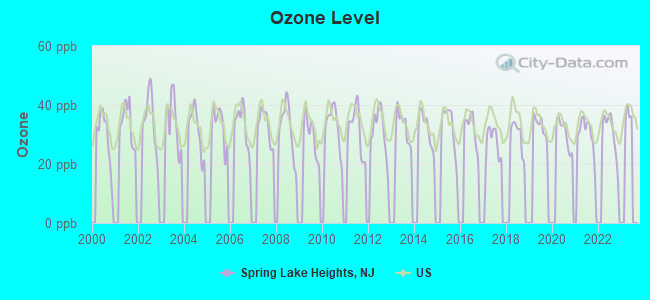
Air pollution - Ozone
Air pollution - PM10
Air pollution - PM25
Air pollution - Pb
Crime - Murders per 100,000 population
Crime - Rapes per 100,000 population
Crime - Robberies per 100,000 population
Crime - Assaults per 100,000 population
Crime - Burglaries per 100,000 population
Crime - Thefts per 100,000 population
Crime - Auto thefts per 100,000 population
Crime - Arson per 100,000 population
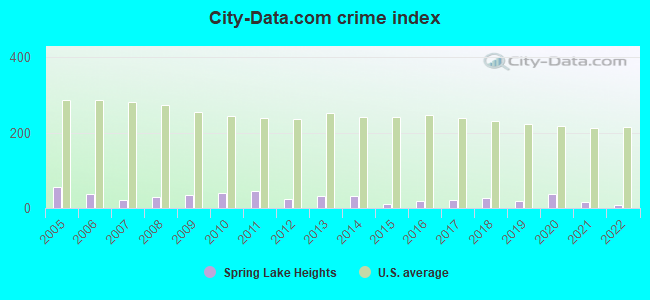
Crime - City-data.com crime index
Crime - Violent crime index
Crime - Property crime index
Crime - Murders per 100,000 population (5 year average)
Crime - Rapes per 100,000 population (5 year average)
Crime - Robberies per 100,000 population (5 year average)
Crime - Assaults per 100,000 population (5 year average)
Crime - Burglaries per 100,000 population (5 year average)
Crime - Thefts per 100,000 population (5 year average)
Crime - Auto thefts per 100,000 population (5 year average)
Crime - Arson per 100,000 population (5 year average)
Crime - City-data.com crime index (5 year average)
Crime - Violent crime index (5 year average)
Crime - Property crime index (5 year average)
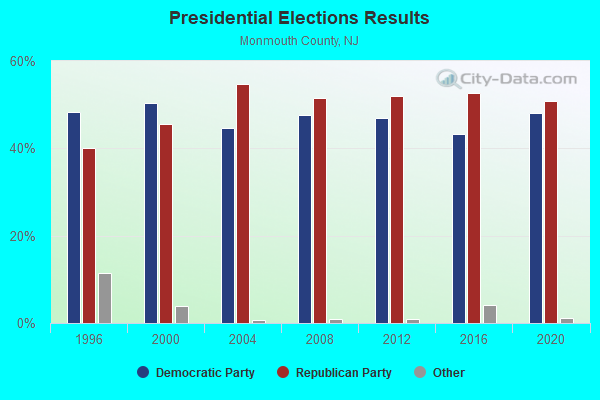
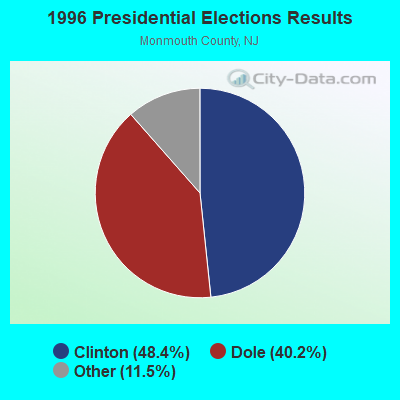
1996 Presidential Elections Results (%) - Democratic Party (Clinton)
1996 Presidential Elections Results (%) - Republican Party (Dole)
1996 Presidential Elections Results (%) - Other
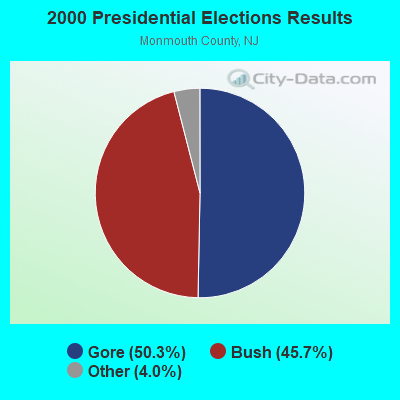
2000 Presidential Elections Results (%) - Democratic Party (Gore)
2000 Presidential Elections Results (%) - Republican Party (Bush)
2000 Presidential Elections Results (%) - Other
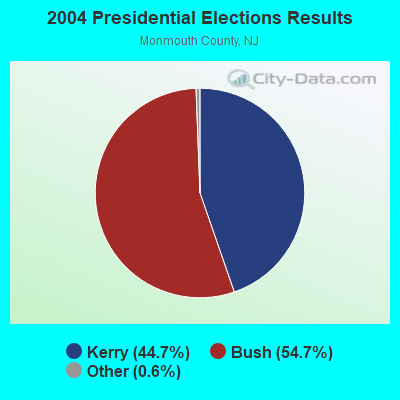
2004 Presidential Elections Results (%) - Democratic Party (Kerry)
2004 Presidential Elections Results (%) - Republican Party (Bush)
2004 Presidential Elections Results (%) - Other
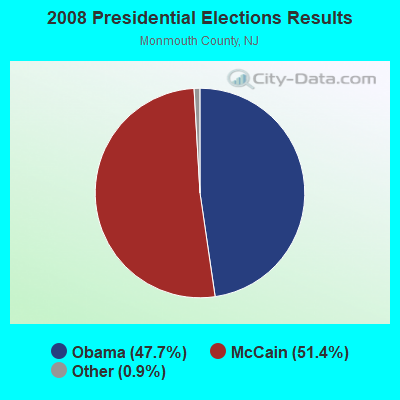
2008 Presidential Elections Results (%) - Democratic Party (Obama)
2008 Presidential Elections Results (%) - Republican Party (McCain)
2008 Presidential Elections Results (%) - Other
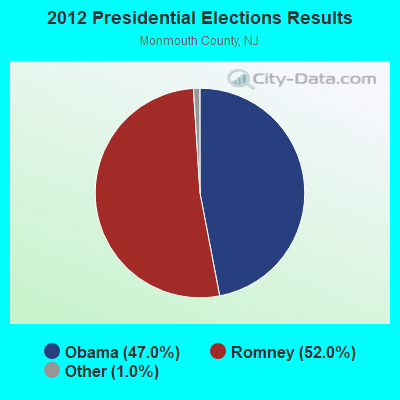
2012 Presidential Elections Results (%) - Democratic Party (Obama)
2012 Presidential Elections Results (%) - Republican Party (Romney)
2012 Presidential Elections Results (%) - Other
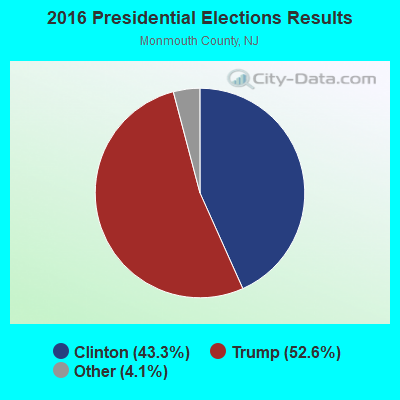
2016 Presidential Elections Results (%) - Democratic Party (Clinton)
2016 Presidential Elections Results (%) - Republican Party (Trump)
2016 Presidential Elections Results (%) - Other
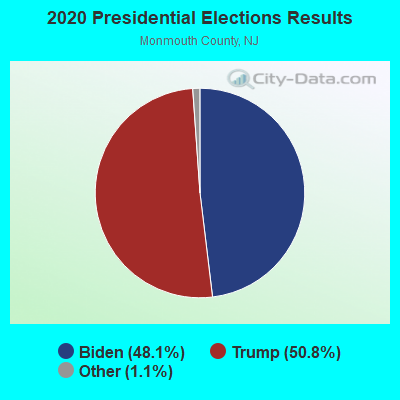
2020 Presidential Elections Results (%) - Democratic Party (Biden)
2020 Presidential Elections Results (%) - Republican Party (Trump)
2020 Presidential Elections Results (%) - Other
Ancestries Reported - Arab (%)
Ancestries Reported - Czech (%)
Ancestries Reported - Danish (%)
Ancestries Reported - Dutch (%)
Ancestries Reported - English (%)
Ancestries Reported - French (%)
Ancestries Reported - French Canadian (%)
Ancestries Reported - German (%)
Ancestries Reported - Greek (%)
Ancestries Reported - Hungarian (%)
Ancestries Reported - Irish (%)
Ancestries Reported - Italian (%)
Ancestries Reported - Lithuanian (%)
Ancestries Reported - Norwegian (%)
Ancestries Reported - Polish (%)
Ancestries Reported - Portuguese (%)
Ancestries Reported - Russian (%)
Ancestries Reported - Scotch-Irish (%)
Ancestries Reported - Scottish (%)
Ancestries Reported - Slovak (%)
Ancestries Reported - Subsaharan African (%)
Ancestries Reported - Swedish (%)
Ancestries Reported - Swiss (%)
Ancestries Reported - Ukrainian (%)
Ancestries Reported - United States (%)
Ancestries Reported - Welsh (%)
Ancestries Reported - West Indian (%)
Ancestries Reported - Other (%)
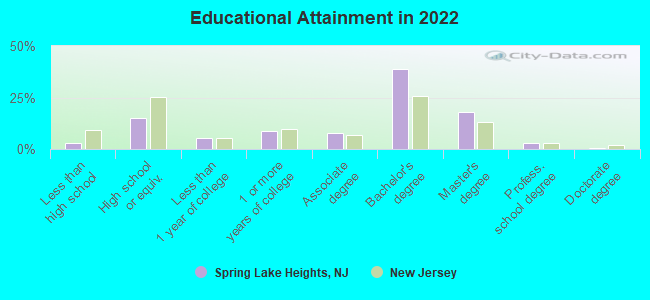
Educational Attainment - No schooling completed (%)
Educational Attainment - Less than high school (%)
Educational Attainment - High school or equivalent (%)
Educational Attainment - Less than 1 year of college (%)
Educational Attainment - 1 or more years of college (%)
Educational Attainment - Associate degree (%)
Educational Attainment - Bachelor's degree (%)
Educational Attainment - Master's degree (%)
Educational Attainment - Professional school degree (%)
Educational Attainment - Doctorate degree (%)
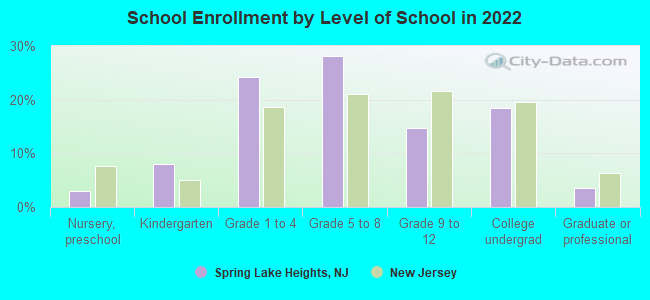
School Enrollment - Nursery, preschool (%)
School Enrollment - Kindergarten (%)
School Enrollment - Grade 1 to 4 (%)
School Enrollment - Grade 5 to 8 (%)
School Enrollment - Grade 9 to 12 (%)
School Enrollment - College undergrad (%)
School Enrollment - Graduate or professional (%)
School Enrollment - Not enrolled in school (%)
School enrollment - Public schools (%)
School enrollment - Private schools (%)
School enrollment - Not enrolled (%)
Median number of rooms in houses and condos
Median number of rooms in apartments
Housing units lacking complete plumbing facilities (%)
Housing units lacking complete kitchen facilities (%)
Density of houses
Urban houses (%)
Rural houses (%)
Households with people 60 years and over (%)
Households with people 65 years and over (%)
Households with people 75 years and over (%)
Households with one or more nonrelatives (%)
Households with no nonrelatives (%)
Population in households (%)
Family households (%)
Nonfamily households (%)
Population in families (%)
Family households with own children (%)
Median number of bedrooms in owner occupied houses
Mean number of bedrooms in owner occupied houses
Median number of bedrooms in renter occupied houses
Mean number of bedrooms in renter occupied houses
Median number of vehichles in owner occupied houses
Mean number of vehichles in owner occupied houses
Median number of vehichles in renter occupied houses
Mean number of vehichles in renter occupied houses
Mortgage status - with mortgage (%)
Mortgage status - with second mortgage (%)
Mortgage status - with home equity loan (%)
Mortgage status - with both second mortgage and home equity loan (%)
Mortgage status - without a mortgage (%)
Average family size
Average family size - White
Average family size - Black or African American
Average family size - Asian
Average family size - Hispanic or Latino
Average family size - American Indian and Alaska Native
Average family size - Multirace
Average family size - Other Race
Geographical mobility - Same house 1 year ago (%)
Geographical mobility - Moved within same county (%)
Geographical mobility - Moved from different county within same state (%)
Geographical mobility - Moved from different state (%)
Geographical mobility - Moved from abroad (%)
Place of birth - Born in state of residence (%)
Place of birth - Born in other state (%)
Place of birth - Native, outside of US (%)
Place of birth - Foreign born (%)
Housing units in structures - 1, detached (%)
Housing units in structures - 1, attached (%)
Housing units in structures - 2 (%)
Housing units in structures - 3 or 4 (%)
Housing units in structures - 5 to 9 (%)
Housing units in structures - 10 to 19 (%)
Housing units in structures - 20 to 49 (%)
Housing units in structures - 50 or more (%)
Housing units in structures - Mobile home (%)
Housing units in structures - Boat, RV, van, etc. (%)
House/condo owner moved in on average (years ago)
Renter moved in on average (years ago)
Year householder moved into unit - Moved in 1999 to March 2000 (%)
Year householder moved into unit - Moved in 1995 to 1998 (%)
Year householder moved into unit - Moved in 1990 to 1994 (%)
Year householder moved into unit - Moved in 1980 to 1989 (%)
Year householder moved into unit - Moved in 1970 to 1979 (%)
Year householder moved into unit - Moved in 1969 or earlier (%)
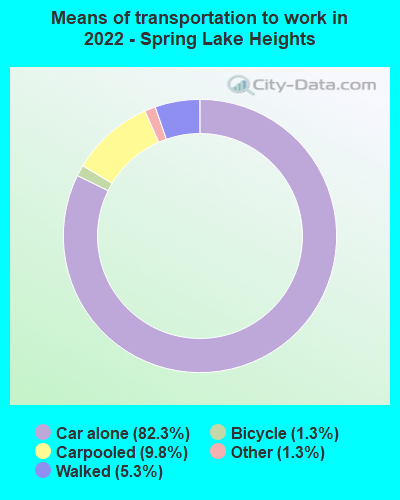
Means of transportation to work - Drove car alone (%)
Means of transportation to work - Carpooled (%)
Means of transportation to work - Public transportation (%)
Means of transportation to work - Bus or trolley bus (%)
Means of transportation to work - Streetcar or trolley car (%)
Means of transportation to work - Subway or elevated (%)
Means of transportation to work - Railroad (%)
Means of transportation to work - Ferryboat (%)
Means of transportation to work - Taxicab (%)
Means of transportation to work - Motorcycle (%)
Means of transportation to work - Bicycle (%)
Means of transportation to work - Walked (%)
Means of transportation to work - Other means (%)
Working at home (%)
Industry diversity
Most Common Industries - Agriculture, forestry, fishing and hunting, and mining (%)
Most Common Industries - Agriculture, forestry, fishing and hunting (%)
Most Common Industries - Mining, quarrying, and oil and gas extraction (%)
Most Common Industries - Construction (%)
Most Common Industries - Manufacturing (%)
Most Common Industries - Wholesale trade (%)
Most Common Industries - Retail trade (%)
Most Common Industries - Transportation and warehousing, and utilities (%)
Most Common Industries - Transportation and warehousing (%)
Most Common Industries - Utilities (%)
Most Common Industries - Information (%)
Most Common Industries - Finance and insurance, and real estate and rental and leasing (%)
Most Common Industries - Finance and insurance (%)
Most Common Industries - Real estate and rental and leasing (%)
Most Common Industries - Professional, scientific, and management, and administrative and waste management services (%)
Most Common Industries - Professional, scientific, and technical services (%)
Most Common Industries - Management of companies and enterprises (%)
Most Common Industries - Administrative and support and waste management services (%)
Most Common Industries - Educational services, and health care and social assistance (%)
Most Common Industries - Educational services (%)
Most Common Industries - Health care and social assistance (%)
Most Common Industries - Arts, entertainment, and recreation, and accommodation and food services (%)
Most Common Industries - Arts, entertainment, and recreation (%)
Most Common Industries - Accommodation and food services (%)
Most Common Industries - Other services, except public administration (%)
Most Common Industries - Public administration (%)
Occupation diversity
Most Common Occupations - Management, business, science, and arts occupations (%)
Most Common Occupations - Management, business, and financial occupations (%)
Most Common Occupations - Management occupations (%)
Most Common Occupations - Business and financial operations occupations (%)
Most Common Occupations - Computer, engineering, and science occupations (%)
Most Common Occupations - Computer and mathematical occupations (%)
Most Common Occupations - Architecture and engineering occupations (%)
Most Common Occupations - Life, physical, and social science occupations (%)
Most Common Occupations - Education, legal, community service, arts, and media occupations (%)
Most Common Occupations - Community and social service occupations (%)
Most Common Occupations - Legal occupations (%)
Most Common Occupations - Education, training, and library occupations (%)
Most Common Occupations - Arts, design, entertainment, sports, and media occupations (%)
Most Common Occupations - Healthcare practitioners and technical occupations (%)
Most Common Occupations - Health diagnosing and treating practitioners and other technical occupations (%)
Most Common Occupations - Health technologists and technicians (%)
Most Common Occupations - Service occupations (%)
Most Common Occupations - Healthcare support occupations (%)
Most Common Occupations - Protective service occupations (%)
Most Common Occupations - Fire fighting and prevention, and other protective service workers including supervisors (%)
Most Common Occupations - Law enforcement workers including supervisors (%)
Most Common Occupations - Food preparation and serving related occupations (%)
Most Common Occupations - Building and grounds cleaning and maintenance occupations (%)
Most Common Occupations - Personal care and service occupations (%)
Most Common Occupations - Sales and office occupations (%)
Most Common Occupations - Sales and related occupations (%)
Most Common Occupations - Office and administrative support occupations (%)
Most Common Occupations - Natural resources, construction, and maintenance occupations (%)
Most Common Occupations - Farming, fishing, and forestry occupations (%)
Most Common Occupations - Construction and extraction occupations (%)
Most Common Occupations - Installation, maintenance, and repair occupations (%)
Most Common Occupations - Production, transportation, and material moving occupations (%)
Most Common Occupations - Production occupations (%)
Most Common Occupations - Transportation occupations (%)
Most Common Occupations - Material moving occupations (%)
People in Group quarters - Institutionalized population (%)
People in Group quarters - Correctional institutions (%)
People in Group quarters - Federal prisons and detention centers (%)
People in Group quarters - Halfway houses (%)
People in Group quarters - Local jails and other confinement facilities (including police lockups) (%)
People in Group quarters - Military disciplinary barracks (%)
People in Group quarters - State prisons (%)
People in Group quarters - Other types of correctional institutions (%)
People in Group quarters - Nursing homes (%)
People in Group quarters - Hospitals/wards, hospices, and schools for the handicapped (%)
People in Group quarters - Hospitals/wards and hospices for chronically ill (%)
People in Group quarters - Hospices or homes for chronically ill (%)
People in Group quarters - Military hospitals or wards for chronically ill (%)
People in Group quarters - Other hospitals or wards for chronically ill (%)
People in Group quarters - Hospitals or wards for drug/alcohol abuse (%)
People in Group quarters - Mental (Psychiatric) hospitals or wards (%)
People in Group quarters - Schools, hospitals, or wards for the mentally retarded (%)
People in Group quarters - Schools, hospitals, or wards for the physically handicapped (%)
People in Group quarters - Institutions for the deaf (%)
People in Group quarters - Institutions for the blind (%)
People in Group quarters - Orthopedic wards and institutions for the physically handicapped (%)
People in Group quarters - Wards in general hospitals for patients who have no usual home elsewhere (%)
People in Group quarters - Wards in military hospitals for patients who have no usual home elsewhere (%)
People in Group quarters - Juvenile institutions (%)
People in Group quarters - Long-term care (%)
People in Group quarters - Homes for abused, dependent, and neglected children (%)
People in Group quarters - Residential treatment centers for emotionally disturbed children (%)
People in Group quarters - Training schools for juvenile delinquents (%)
People in Group quarters - Short-term care, detention or diagnostic centers for delinquent children (%)
People in Group quarters - Type of juvenile institution unknown (%)
People in Group quarters - Noninstitutionalized population (%)
People in Group quarters - College dormitories (includes college quarters off campus) (%)
People in Group quarters - Military quarters (%)
People in Group quarters - On base (%)
People in Group quarters - Barracks, unaccompanied personnel housing (UPH), (Enlisted/Officer), ;and similar group living quarters for military personnel (%)
People in Group quarters - Transient quarters for temporary residents (%)
People in Group quarters - Military ships (%)
People in Group quarters - Group homes (%)
People in Group quarters - Homes or halfway houses for drug/alcohol abuse (%)
People in Group quarters - Homes for the mentally ill (%)
People in Group quarters - Homes for the mentally retarded (%)
People in Group quarters - Homes for the physically handicapped (%)
People in Group quarters - Other group homes (%)
People in Group quarters - Religious group quarters (%)
People in Group quarters - Dormitories (%)
People in Group quarters - Agriculture workers' dormitories on farms (%)
People in Group quarters - Job Corps and vocational training facilities (%)
People in Group quarters - Other workers' dormitories (%)
People in Group quarters - Crews of maritime vessels (%)
People in Group quarters - Other nonhousehold living situations (%)
People in Group quarters - Other noninstitutional group quarters (%)
Residents speaking English at home (%)
Residents speaking English at home - Born in the United States (%)
Residents speaking English at home - Native, born elsewhere (%)
Residents speaking English at home - Foreign born (%)
Residents speaking Spanish at home (%)
Residents speaking Spanish at home - Born in the United States (%)
Residents speaking Spanish at home - Native, born elsewhere (%)
Residents speaking Spanish at home - Foreign born (%)
Residents speaking other language at home (%)
Residents speaking other language at home - Born in the United States (%)
Residents speaking other language at home - Native, born elsewhere (%)
Residents speaking other language at home - Foreign born (%)
Class of Workers - Employee of private company (%)
Class of Workers - Self-employed in own incorporated business (%)
Class of Workers - Private not-for-profit wage and salary workers (%)
Class of Workers - Local government workers (%)
Class of Workers - State government workers (%)
Class of Workers - Federal government workers (%)
Class of Workers - Self-employed workers in own not incorporated business and Unpaid family workers (%)
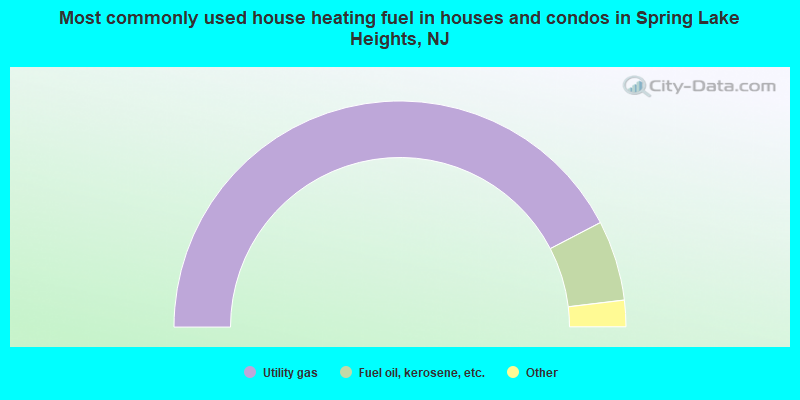
House heating fuel used in houses and condos - Utility gas (%)
House heating fuel used in houses and condos - Bottled, tank, or LP gas (%)
House heating fuel used in houses and condos - Electricity (%)
House heating fuel used in houses and condos - Fuel oil, kerosene, etc. (%)
House heating fuel used in houses and condos - Coal or coke (%)
House heating fuel used in houses and condos - Wood (%)
House heating fuel used in houses and condos - Solar energy (%)
House heating fuel used in houses and condos - Other fuel (%)
House heating fuel used in houses and condos - No fuel used (%)
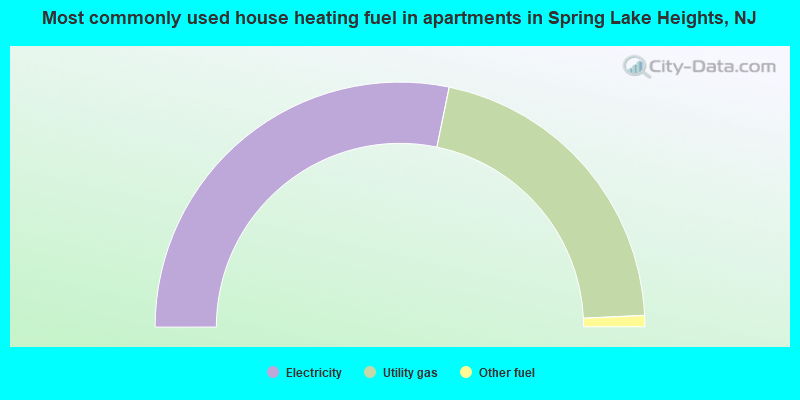
House heating fuel used in apartments - Utility gas (%)
House heating fuel used in apartments - Bottled, tank, or LP gas (%)
House heating fuel used in apartments - Electricity (%)
House heating fuel used in apartments - Fuel oil, kerosene, etc. (%)
House heating fuel used in apartments - Coal or coke (%)
House heating fuel used in apartments - Wood (%)
House heating fuel used in apartments - Solar energy (%)
House heating fuel used in apartments - Other fuel (%)
House heating fuel used in apartments - No fuel used (%)
Armed forces status - In Armed Forces (%)
Armed forces status - Civilian (%)
Armed forces status - Civilian - Veteran (%)
Armed forces status - Civilian - Nonveteran (%)
Fatal accidents locations in years 2005-2021
Fatal accidents locations in 2005
Fatal accidents locations in 2006
Fatal accidents locations in 2007
Fatal accidents locations in 2008
Fatal accidents locations in 2009
Fatal accidents locations in 2010
Fatal accidents locations in 2011
Fatal accidents locations in 2012
Fatal accidents locations in 2013
Fatal accidents locations in 2014
Fatal accidents locations in 2015
Fatal accidents locations in 2016
Fatal accidents locations in 2017
Fatal accidents locations in 2018
Fatal accidents locations in 2019
Fatal accidents locations in 2020
Fatal accidents locations in 2021
Alcohol use - People drinking some alcohol every month (%)
Alcohol use - People not drinking at all (%)
Alcohol use - Average days/month drinking alcohol
Alcohol use - Average drinks/week
Alcohol use - Average days/year people drink much
Audiometry - Average condition of hearing (%)
Audiometry - People that can hear a whisper from across a quiet room (%)
Audiometry - People that can hear normal voice from across a quiet room (%)
Audiometry - Ears ringing, roaring, buzzing (%)
Audiometry - Had a job exposure to loud noise (%)
Audiometry - Had off-work exposure to loud noise (%)
Blood Pressure & Cholesterol - Has high blood pressure (%)
Blood Pressure & Cholesterol - Checking blood pressure at home (%)
Blood Pressure & Cholesterol - Frequently checking blood cholesterol (%)
Blood Pressure & Cholesterol - Has high cholesterol level (%)
Consumer Behavior - Money monthly spent on food at supermarket/grocery store
Consumer Behavior - Money monthly spent on food at other stores
Consumer Behavior - Money monthly spent on eating out
Consumer Behavior - Money monthly spent on carryout/delivered foods
Consumer Behavior - Income spent on food at supermarket/grocery store (%)
Consumer Behavior - Income spent on food at other stores (%)
Consumer Behavior - Income spent on eating out (%)
Consumer Behavior - Income spent on carryout/delivered foods (%)
Current Health Status - General health condition (%)
Current Health Status - Blood donors (%)
Current Health Status - Has blood ever tested for HIV virus (%)
Current Health Status - Left-handed people (%)
Dermatology - People using sunscreen (%)
Diabetes - Diabetics (%)
Diabetes - Had a blood test for high blood sugar (%)
Diabetes - People taking insulin (%)
Diet Behavior & Nutrition - Diet health (%)
Diet Behavior & Nutrition - Milk product consumption (# of products/month)
Diet Behavior & Nutrition - Meals not home prepared (#/week)
Diet Behavior & Nutrition - Meals from fast food or pizza place (#/week)
Diet Behavior & Nutrition - Ready-to-eat foods (#/month)
Diet Behavior & Nutrition - Frozen meals/pizza (#/month)
Drug Use - People that ever used marijuana or hashish (%)
Drug Use - Ever used hard drugs (%)
Drug Use - Ever used any form of cocaine (%)
Drug Use - Ever used heroin (%)
Drug Use - Ever used methamphetamine (%)
Health Insurance - People covered by health insurance (%)
Kidney Conditions-Urology - Avg. # of times urinating at night
Medical Conditions - People with asthma (%)
Medical Conditions - People with anemia (%)
Medical Conditions - People with psoriasis (%)
Medical Conditions - People with overweight (%)
Medical Conditions - Elderly people having difficulties in thinking or remembering (%)
Medical Conditions - People who ever received blood transfusion (%)
Medical Conditions - People having trouble seeing even with glass/contacts (%)
Medical Conditions - People with arthritis (%)
Medical Conditions - People with gout (%)
Medical Conditions - People with congestive heart failure (%)
Medical Conditions - People with coronary heart disease (%)
Medical Conditions - People with angina pectoris (%)
Medical Conditions - People who ever had heart attack (%)
Medical Conditions - People who ever had stroke (%)
Medical Conditions - People with emphysema (%)
Medical Conditions - People with thyroid problem (%)
Medical Conditions - People with chronic bronchitis (%)
Medical Conditions - People with any liver condition (%)
Medical Conditions - People who ever had cancer or malignancy (%)
Mental Health - People who have little interest in doing things (%)
Mental Health - People feeling down, depressed, or hopeless (%)
Mental Health - People who have trouble sleeping or sleeping too much (%)
Mental Health - People feeling tired or having little energy (%)
Mental Health - People with poor appetite or overeating (%)
Mental Health - People feeling bad about themself (%)
Mental Health - People who have trouble concentrating on things (%)
Mental Health - People moving or speaking slowly or too fast (%)
Mental Health - People having thoughts they would be better off dead (%)
Oral Health - Average years since last visit a dentist
Oral Health - People embarrassed because of mouth (%)
Oral Health - People with gum disease (%)
Oral Health - General health of teeth and gums (%)
Oral Health - Average days a week using dental floss/device
Oral Health - Average days a week using mouthwash for dental problem
Oral Health - Average number of teeth
Pesticide Use - Households using pesticides to control insects (%)
Pesticide Use - Households using pesticides to kill weeds (%)
Physical Activity - People doing vigorous-intensity work activities (%)
Physical Activity - People doing moderate-intensity work activities (%)
Physical Activity - People walking or bicycling (%)
Physical Activity - People doing vigorous-intensity recreational activities (%)
Physical Activity - People doing moderate-intensity recreational activities (%)
Physical Activity - Average hours a day doing sedentary activities
Physical Activity - Average hours a day watching TV or videos
Physical Activity - Average hours a day using computer
Physical Functioning - People having limitations keeping them from working (%)
Physical Functioning - People limited in amount of work they can do (%)
Physical Functioning - People that need special equipment to walk (%)
Physical Functioning - People experiencing confusion/memory problems (%)
Physical Functioning - People requiring special healthcare equipment (%)
Prescription Medications - Average number of prescription medicines taking
Preventive Aspirin Use - Adults 40+ taking low-dose aspirin (%)
Reproductive Health - Vaginal deliveries (%)
Reproductive Health - Cesarean deliveries (%)
Reproductive Health - Deliveries resulted in a live birth (%)
Reproductive Health - Pregnancies resulted in a delivery (%)
Reproductive Health - Women breastfeeding newborns (%)
Reproductive Health - Women that had a hysterectomy (%)
Reproductive Health - Women that had both ovaries removed (%)
Reproductive Health - Women that have ever taken birth control pills (%)
Reproductive Health - Women taking birth control pills (%)
Reproductive Health - Women that have ever used Depo-Provera or injectables (%)
Reproductive Health - Women that have ever used female hormones (%)
Sexual Behavior - People 18+ that ever had sex (vaginal, anal, or oral) (%)
Sexual Behavior - Males 18+ that ever had vaginal sex with a woman (%)
Sexual Behavior - Males 18+ that ever performed oral sex on a woman (%)
Sexual Behavior - Males 18+ that ever had anal sex with a woman (%)
Sexual Behavior - Males 18+ that ever had any sex with a man (%)
Sexual Behavior - Females 18+ that ever had vaginal sex with a man (%)
Sexual Behavior - Females 18+ that ever performed oral sex on a man (%)
Sexual Behavior - Females 18+ that ever had anal sex with a man (%)
Sexual Behavior - Females 18+ that ever had any kind of sex with a woman (%)
Sexual Behavior - Average age people first had sex
Sexual Behavior - Average number of female sex partners in lifetime (males 18+)
Sexual Behavior - Average number of female vaginal sex partners in lifetime (males 18+)
Sexual Behavior - Average age people first performed oral sex on a woman (18+)
Sexual Behavior - Average number of woman performed oral sex on in lifetime (18+)
Sexual Behavior - Average number of male sex partners in lifetime (males 18+)
Sexual Behavior - Average number of male anal sex partners in lifetime (males 18+)
Sexual Behavior - Average age people first performed oral sex on a man (18+)
Sexual Behavior - Average number of male oral sex partners in lifetime (18+)
Sexual Behavior - People using protection when performing oral sex (%)
Sexual Behavior - Average number of times people have vaginal or anal sex a year
Sexual Behavior - People having sex without condom (%)
Sexual Behavior - Average number of male sex partners in lifetime (females 18+)
Sexual Behavior - Average number of male vaginal sex partners in lifetime (females 18+)
Sexual Behavior - Average number of female sex partners in lifetime (females 18+)
Sexual Behavior - Circumcised males 18+ (%)
Sleep Disorders - Average hours sleeping at night
Sleep Disorders - People that has trouble sleeping (%)
Smoking-Cigarette Use - People smoking cigarettes (%)
Taste & Smell - People 40+ having problems with smell (%)
Taste & Smell - People 40+ having problems with taste (%)
Taste & Smell - People 40+ that ever had wisdom teeth removed (%)
Taste & Smell - People 40+ that ever had tonsils teeth removed (%)
Taste & Smell - People 40+ that ever had a loss of consciousness because of a head injury (%)
Taste & Smell - People 40+ that ever had a broken nose or other serious injury to face or skull (%)
Taste & Smell - People 40+ that ever had two or more sinus infections (%)
Weight - Average height (inches)
Weight - Average weight (pounds)
Weight - Average BMI
Weight - People that are obese (%)
Weight - People that ever were obese (%)
Weight - People trying to lose weight (%)
Officers per 1,000 residents here:
3.35New Jersey average:
5.53
Latest news from Spring Lake Heights, NJ collected exclusively by city-data.com from local newspapers, TV, and radio stations
Ancestries: Irish (33.6%), Italian (25.5%), English (10.7%), Polish (4.9%), Lebanese (2.7%), American (2.6%).
Current Local Time:
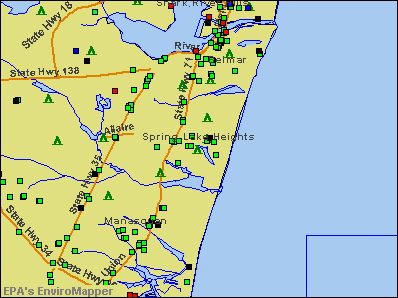
Land area: 1.32 square miles.
Population density: 3,674 people per square mile (average).
289 residents are foreign born (2.5% Asia , 1.6% Latin America , 0.7% Oceania , 0.6% Europe ).
This borough:
5.9%New Jersey:
23.2%
Median real estate property taxes paid for housing units with mortgages in 2022: $8,189 (1.2%)Median real estate property taxes paid for housing units with no mortgage in 2022: $8,002 (1.2%)
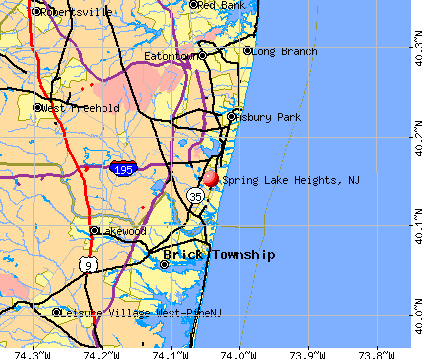
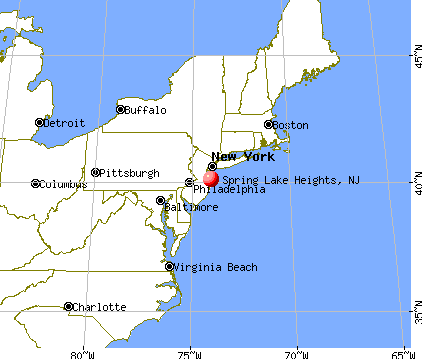
Nearest city with pop. 50,000+: Toms River, NJ
Nearest city with pop. 200,000+: Staten Island, NY
Nearest city with pop. 1,000,000+: Brooklyn, NY
Nearest cities:
Latitude: 40.15 N, Longitude: 74.04 W
Area code commonly used in this area: 732
Unemployment in December 2023:
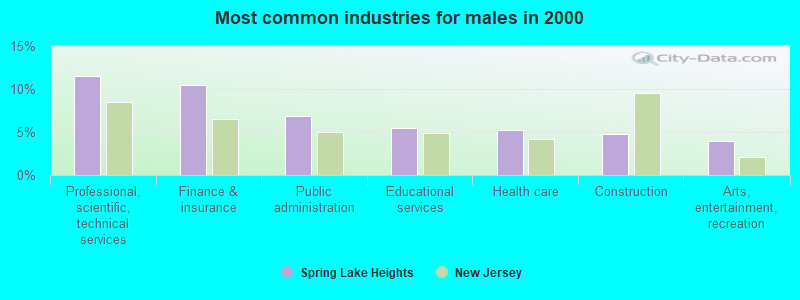
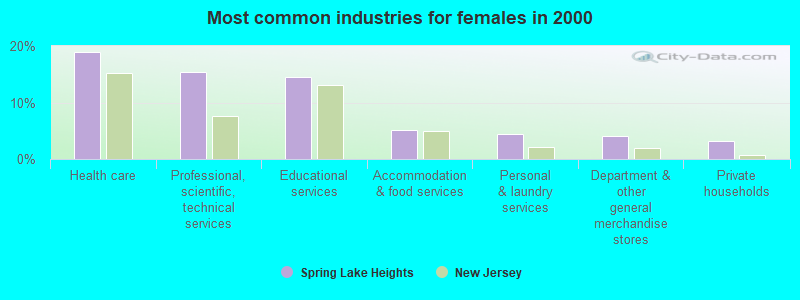
Most common industries in Spring Lake Heights, NJ (%)
Both Males Females
Professional, scientific, technical services (13.3%)
Health care (11.8%)
Educational services (9.8%)
Finance & insurance (6.9%)
Public administration (4.5%)
Accommodation & food services (3.6%)
Publishing, motion picture & sound recording industries (2.8%)
Professional, scientific, technical services (11.5%)
Finance & insurance (10.5%)
Public administration (6.9%)
Educational services (5.4%)
Health care (5.2%)
Construction (4.7%)
Arts, entertainment, recreation (3.9%)
Health care (18.9%)
Professional, scientific, technical services (15.3%)
Educational services (14.5%)
Accommodation & food services (5.2%)
Personal & laundry services (4.5%)
Department & other general merchandise stores (4.0%)
Private households (3.3%)
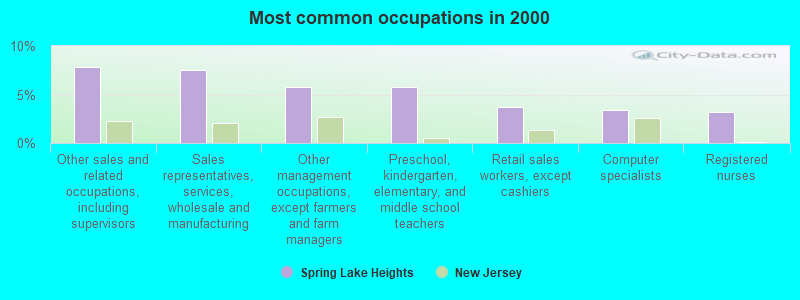
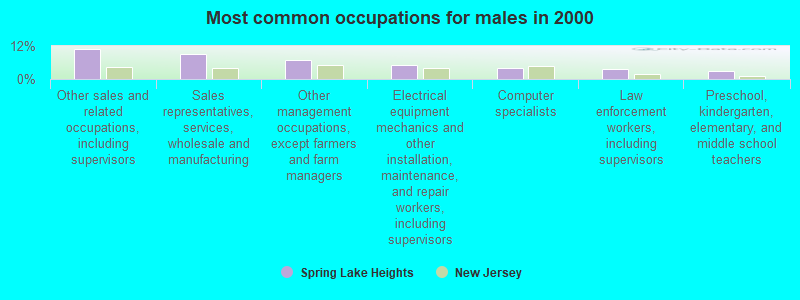
Most common occupations in Spring Lake Heights, NJ (%)
Both Males Females
Other sales and related occupations, including supervisors (7.9%)
Sales representatives, services, wholesale and manufacturing (7.5%)
Other management occupations, except farmers and farm managers (5.8%)
Preschool, kindergarten, elementary, and middle school teachers (5.8%)
Retail sales workers, except cashiers (3.7%)
Computer specialists (3.4%)
Registered nurses (3.2%)
Other sales and related occupations, including supervisors (10.9%)
Sales representatives, services, wholesale and manufacturing (9.1%)
Other management occupations, except farmers and farm managers (6.9%)
Electrical equipment mechanics and other installation, maintenance, and repair workers, including supervisors (5.0%)
Computer specialists (3.9%)
Law enforcement workers, including supervisors (3.5%)
Preschool, kindergarten, elementary, and middle school teachers (3.0%)
Preschool, kindergarten, elementary, and middle school teachers (8.7%)
Registered nurses (6.6%)
Sales representatives, services, wholesale and manufacturing (5.8%)
Other management occupations, except farmers and farm managers (4.7%)
Other sales and related occupations, including supervisors (4.6%)
Retail sales workers, except cashiers (4.4%)
Nursing, psychiatric, and home health aides (4.1%)
Tornado activity:
Spring Lake Heights-area historical tornado activity is below New Jersey state average. It is 52% smaller than the overall U.S. average.
On 7/21/1983, a category F3 (max. wind speeds 158-206 mph) tornado 35.7 miles away from the Spring Lake Heights borough center caused between $500,000 and $5,000,000 in damages.
On 10/16/1955, a category F2 (max. wind speeds 113-157 mph) tornado 10.4 miles away from the borough center .
Earthquake activity:
Spring Lake Heights-area historical earthquake activity is significantly above New Jersey state average. It is 70% smaller than the overall U.S. average. On 8/23/2011 at 17:51:04, a magnitude 5.8 (5.8 MW, Depth: 3.7 mi, Class: Moderate, Intensity: VI - VII) earthquake occurred 260.4 miles away from Spring Lake Heights center On 1/16/1994 at 01:49:16, a magnitude 4.6 (4.6 MB, 4.6 LG, Depth: 3.1 mi, Class: Light, Intensity: IV - V) earthquake occurred 106.0 miles away from the city center On 10/7/1983 at 10:18:46, a magnitude 5.3 (5.1 MB, 5.3 LG, 5.1 ML) earthquake occurred 263.3 miles away from Spring Lake Heights center On 4/20/2002 at 10:50:47, a magnitude 5.3 (5.3 ML, Depth: 3.0 mi) earthquake occurred 302.1 miles away from Spring Lake Heights center On 8/22/1992 at 12:20:32, a magnitude 4.8 (4.8 MB, 3.8 MS, 4.7 LG, Depth: 6.2 mi) earthquake occurred 211.1 miles away from the city center On 1/16/1994 at 00:42:43, a magnitude 4.2 (4.2 MB, 4.0 LG, Depth: 3.1 mi) earthquake occurred 104.4 miles away from Spring Lake Heights center Magnitude types: regional Lg-wave magnitude (LG), body-wave magnitude (MB), local magnitude (ML), surface-wave magnitude (MS), moment magnitude (MW) Natural disasters: The number of natural disasters in Monmouth County (24) is greater than the US average (15).Major Disasters (Presidential) Declared: 15Emergencies Declared: 9Hurricanes: 7, Floods: 5, Storms: 5, Snowstorms: 3, Blizzards: 2, Heavy Rains: 2, Water Shortages: 2, Winter Storms: 2, Tropical Storm: 1, Wind: 1, Other: 3 (Note: some incidents may be assigned to more than one category). Hospitals and medical centers near Spring Lake Heights: BRANDYWINE SENIOR LIVING AT WALL (Nursing Home, about 2 miles away; WALL, NJ)
CARE ONE AT HOLMDEL (Nursing Home, about 3 miles away; HOLMDEL, NJ)
HOLMDEL NURSING HOME (Nursing Home, about 3 miles away; HOLMDEL, NJ)
TOWER LODGE CARE CENTER (Nursing Home, about 4 miles away; WALL, NJ)
TOWER LODGE NURSING HOME (Nursing Home, about 4 miles away; WALL, NJ)
SUNNYSIDE MANOR (Nursing Home, about 4 miles away; MANASQUAN, NJ)
MEDICENTER (Nursing Home, about 4 miles away; NEPTUNE CITY, NJ)
Colleges/universities with over 2000 students nearest to Spring Lake Heights:
Monmouth University (about 10 miles; West Long Branch, NJ ; Full-time enrollment: 5,986)
Beth Medrash Govoha (about 11 miles; Lakewood, NJ ; FT enrollment: 6,700)
Ocean County College (about 12 miles; Toms River, NJ ; FT enrollment: 7,471)
Brookdale Community College (about 13 miles; Lincroft, NJ ; FT enrollment: 10,879)
Middlesex County College (about 30 miles; Edison, NJ ; FT enrollment: 9,849)
CUNY Kingsborough Community College (about 30 miles; Brooklyn, NY ; FT enrollment: 13,402)
College of Staten Island CUNY (about 32 miles; Staten Island, NY ; FT enrollment: 11,684)
Public elementary/middle school in Spring Lake Heights:
See full list of schools located in Spring Lake Heights Birthplace of: Balls Mahoney - Professional wrestler, Todd Rinaldo - College football player (Bucknell Bison).
Monmouth County has a predicted average indoor radon screening level greater than 4 pCi/L (pico curies per liter) - Highest Potential Drinking water stations with addresses in Spring Lake Heights and their reported violations in the past:
BOROUGH OF SPRINGLAKE HEIGHTS (Population served: 5,500, Purch surface water):
Past monitoring violations:
Monitoring of Treatment (SWTR-Filter) - In MAY-2014. Follow-up actions: St Formal NOV issued (JUN-16-2014), St Compliance achieved (JUN-20-2014)
Average household size: This borough:
2.0 peopleNew Jersey:
2.7 people
Percentage of family households: This borough:
51.9%Whole state:
69.3%
Percentage of households with unmarried partners: This borough:
5.1%Whole state:
5.9%
Likely homosexual households (counted as self-reported same-sex unmarried-partner households)
Lesbian couples: 0.3% of all households Gay men: 0.2% of all households
101 people in other noninstitutional group quarters in 2000
For population 15 years and over in Spring Lake Heights:
Never married: 33.4%Now married: 49.8%Separated: 0.2%Widowed: 9.0%Divorced: 7.5% For population 25 years and over in Spring Lake Heights:
High school or higher: 97.2%Bachelor's degree or higher: 57.6%Graduate or professional degree: 20.6%Unemployed: 7.2%Mean travel time to work (commute): 23.8 minutes
Education Gini index (Inequality in education) Here:
9.3New Jersey average:
12.8
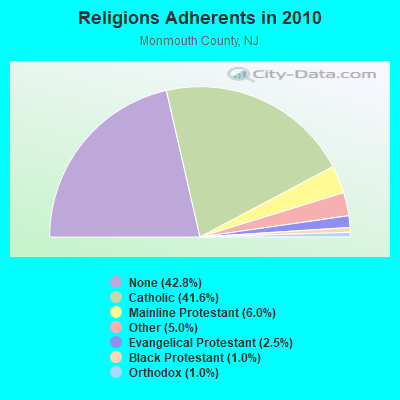
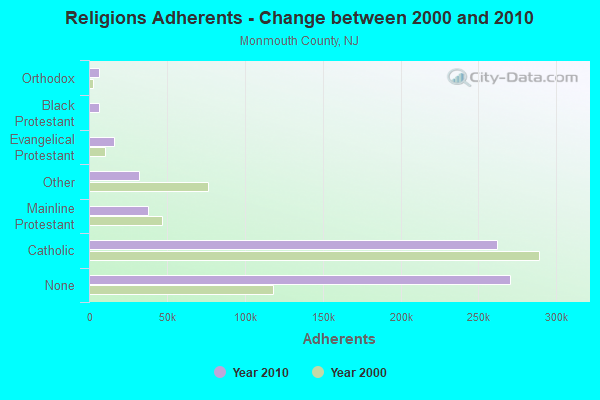
Religion statistics for Spring Lake Heights, NJ (based on Monmouth County data)
Religion Adherents Congregations Catholic 262,031 48 Mainline Protestant 37,657 131 Other 31,794 70 Evangelical Protestant 16,025 106 Black Protestant 6,507 33 Orthodox 6,377 9 None 269,989 -
Source: Clifford Grammich, Kirk Hadaway, Richard Houseal, Dale E.Jones, Alexei Krindatch, Richie Stanley and Richard H.Taylor. 2012. 2010 U.S.Religion Census: Religious Congregations & Membership Study. Association of Statisticians of American Religious Bodies. Jones, Dale E., et al. 2002. Congregations and Membership in the United States 2000. Nashville, TN: Glenmary Research Center. Graphs represent county-level data
Food Environment Statistics: Number of grocery stores : 165Here :
2.57 / 10,000 pop.New Jersey :
2.90 / 10,000 pop.
Number of supercenters and club stores : 5Monmouth County :
0.08 / 10,000 pop.New Jersey :
0.06 / 10,000 pop.
Number of convenience stores (no gas) : 117Monmouth County :
1.82 / 10,000 pop.New Jersey :
1.76 / 10,000 pop.
Number of convenience stores (with gas) : 51This county :
0.80 / 10,000 pop.New Jersey :
0.81 / 10,000 pop.
Number of full-service restaurants : 623Here :
9.71 / 10,000 pop.New Jersey :
7.15 / 10,000 pop.
Adult diabetes rate : Monmouth County :
7.6%New Jersey :
8.3%
Adult obesity rate : Monmouth County :
20.4%New Jersey :
23.3%
Low-income preschool obesity rate : This county :
21.8%New Jersey :
18.0%
Health and Nutrition: Healthy diet rate : Spring Lake Heights:
54.7%New Jersey:
50.6%
Average overall health of teeth and gums : Spring Lake Heights:
50.8%New Jersey:
48.5%
Average BMI : Spring Lake Heights:
28.4New Jersey:
28.5
People feeling badly about themselves : Here:
18.4%New Jersey:
20.0%
People not drinking alcohol at all : This city:
5.5%New Jersey:
11.1%
Average hours sleeping at night : Spring Lake Heights:
6.9New Jersey:
6.8
Overweight people : This city:
31.4%State:
33.6%
General health condition : Spring Lake Heights:
60.0%State:
56.9%
Average condition of hearing : Here:
74.8%New Jersey:
80.0%
More about Health and Nutrition of Spring Lake Heights, NJ Residents
Local government employment and payroll (March 2022)
Function
Full-time employees
Monthly full-time payroll
Average yearly full-time wage
Part-time employees
Monthly part-time payroll
Police Protection - Officers
12 $154,803 $154,803 0 $0 Solid Waste Management
8 $54,064 $81,096 3 $4,799 Financial Administration
3 $20,092 $80,368 3 $5,239 Other Government Administration
2 $16,864 $101,184 9 $5,545 Sewerage
2 $17,971 $107,826 0 $0 Streets and Highways
1 $6,720 $80,640 0 $0 Judicial and Legal
0 $0 1 $697 Police - Other
0 $0 10 $5,144 Firefighters
0 $0 1 $1,532 Water Supply
0 $0 1 $1,366 Parks and Recreation
0 $0 1 $1,324
Totals for Government
28 $270,515 $115,935 29 $25,646
Spring Lake Heights government finances - Expenditure in 2017 (per resident):
Construction - General - Other: $68,000 ($13.98)
Parks and Recreation: $7,000 ($1.44)Current Operations - General - Other: $1,906,000 ($391.78)
Police Protection: $1,570,000 ($322.71)Sewerage: $666,000 ($136.90)Water Utilities: $565,000 ($116.14)Judicial and Legal Services: $245,000 ($50.36)Central Staff Services: $233,000 ($47.89)Regular Highways: $200,000 ($41.11)Financial Administration: $169,000 ($34.74)Solid Waste Management: $157,000 ($32.27)Protective Inspection and Regulation - Other: $21,000 ($4.32)Public Welfare - Other: $9,000 ($1.85)Local Fire Protection: $2,000 ($0.41)General - Interest on Debt: $105,000 ($21.58)
Intergovernmental to Local - Other - Sewerage: $1,135,000 ($233.30)
Other Capital Outlay - General - Other: $8,000 ($1.64)
Total Salaries and Wages: $2,475,000 ($508.74)
Spring Lake Heights government finances - Revenue in 2017 (per resident):
Charges - Sewerage: $936,000 ($192.39)
Miscellaneous - Rents: $116,000 ($23.84)
Fines and Forfeits: $112,000 ($23.02)General Revenue - Other: $74,000 ($15.21)Interest Earnings: $10,000 ($2.06)Revenue - Water Utilities: $936,000 ($192.39)
State Intergovernmental - General Local Government Support: $384,000 ($78.93)
Public Welfare: $4,000 ($0.82)Tax - Property: $4,341,000 ($892.29)
Other License: $121,000 ($24.87)Alcoholic Beverage License: $23,000 ($4.73)
Spring Lake Heights government finances - Debt in 2017 (per resident):
Long Term Debt - Beginning Outstanding - Unspecified Public Purpose: $2,617,000 ($537.92)
Outstanding Unspecified Public Purpose: $2,492,000 ($512.23)Retired Unspecified Public Purpose: $125,000 ($25.69)
Spring Lake Heights government finances - Cash and Securities in 2017 (per resident):
Bond Funds - Cash and Securities: $655,000 ($134.64)
Other Funds - Cash and Securities: $3,944,000 ($810.69)
5.93% of this county's 2020 resident taxpayers moved to other counties in 2021 ($112,522 average adjusted gross income )
Here:
5.93%New Jersey average:
7.02%
0.01% of residents moved to foreign countries ($114 average AGI )Monmouth County:
0.01%New Jersey average:
0.02%
Top counties to which taxpayers relocated from this county between 2020 and 2021: Businesses in Spring Lake Heights, NJ
Strongest AM radio stations in Spring Lake Heights:
WOBM (1160 AM; 9 kW; LAKEWOOD TOWNSHIP, NJ; Owner: NORTH SHORE BROADCASTING CORP.)
WADB (1310 AM; 2 kW; ASBURY PARK, NJ; Owner: MILLENNIUM SHORE LICENSE HOLDCO, LLC)
WMCA (570 AM; 50 kW; NEW YORK, NY; Owner: SALEM MEDIA OF NEW YORK, LLC)
WOR (710 AM; 50 kW; NEW YORK, NY; Owner: BUCKLEY BROADCASTING CORPORATION)
WFAN (660 AM; 50 kW; NEW YORK, NY; Owner: INFINITY BROADCASTING OPERATIONS, INC.)
WABC (770 AM; 50 kW; NEW YORK, NY; Owner: WABC-AM RADIO, INC.)
WINS (1010 AM; 50 kW; NEW YORK, NY; Owner: INFINITY BROADCASTING OPERATIONS, INC.)
WEPN (1050 AM; 50 kW; NEW YORK, NY; Owner: NEW YORK AM RADIO, LLC)
WCBS (880 AM; 50 kW; NEW YORK, NY; Owner: INFINITY BROADCASTING OPERATIONS, INC.)
WBBR (1130 AM; 50 kW; NEW YORK, NY; Owner: BLOOMBERG COMMUNICATIONS INC.)
WQEW (1560 AM; 50 kW; NEW YORK, NY; Owner: THE NEW YORK TIMES ELECTRONIC MEDIA COMPANY)
WADO (1280 AM; 50 kW; NEW YORK, NY; Owner: WADO-AM LICENSE CORP.)
WWJZ (640 AM; 50 kW; MOUNT HOLLY, NJ; Owner: ABC, INC.)
Strongest FM radio stations in Spring Lake Heights:
WRAT (95.9 FM; POINT PLEASANT, NJ; Owner: THE SENTINEL PUBLISHING CO.)
WJLK-FM (94.3 FM; ASBURY PARK, NJ; Owner: MILLENNIUM SHORE LICENSE HOLDCO, LLC)
WHTG-FM (106.3 FM; EATONTOWN, NJ; Owner: PRESS COMMUNICATIONS, LLC)
WYGG (88.1 FM; ASBURY PARK, NJ; Owner: MINORITY BUSINESS & HOUSING DEVELOPMENT, INC)
WBJB-FM (90.5 FM; LINCROFT, NJ; Owner: BROOKDALE COMMUNITY COLLEGE)
WWZY (107.1 FM; LONG BRANCH, NJ; Owner: PRESS COMMUNICATIONS, LLC)
WNYC-FM (93.9 FM; NEW YORK, NY; Owner: WNYC RADIO)
WPAT-FM (93.1 FM; PATERSON, NJ; Owner: WPAT LICENSING, INC.)
WQCD (101.9 FM; NEW YORK, NY; Owner: EMMIS RADIO LICENSE CORPORATION)
WKTU (103.5 FM; LAKE SUCCESS, NY; Owner: AMFM RADIO LICENSES, LLC)
WCAA (105.9 FM; NEWARK, NJ; Owner: WADO-AM LICENSE CORP. ("WADO"))
WBAI (99.5 FM; NEW YORK, NY; Owner: PACIFICA FOUNDATION, INC.)
WBLS (107.5 FM; NEW YORK, NY; Owner: ICBC BROADCAST HOLDINGS-NY, INC.)
WLTW (106.7 FM; NEW YORK, NY; Owner: AMFM NEW YORK LICENSES, LLC)
WQXR-FM (96.3 FM; NEW YORK, NY; Owner: THE NEW YORK TIMES ELECTRONIC MEDIA COMPANY)
WSKQ-FM (97.9 FM; NEW YORK, NY; Owner: WSKQ LICENSING, INC.)
WXRK (92.3 FM; NEW YORK, NY; Owner: INFINITY BROADCASTING OPERATIONS, INC.)
WQHT (97.1 FM; NEW YORK, NY; Owner: EMMIS LICENSE CORPORATION OF NEW YORK)
WAXQ (104.3 FM; NEW YORK, NY; Owner: AMFM NEW YORK LICENSES, LLC)
WHTZ (100.3 FM; NEWARK, NJ; Owner: AMFM RADIO LICENSES, L.L.C.)
TV broadcast stations around Spring Lake Heights:
WNJB1 (Channel 58; LONG BRANCH, NJ; Owner: NJ PUBLIC BROADCASTING AUTHORITY)
WCBS-TV (Channel 2; NEW YORK, NY; Owner: CBS BROADCASTING INC.)
WNYW (Channel 5; NEW YORK, NY; Owner: FOX TELEVISION STATIONS, INC.)
WABC-TV (Channel 7; NEW YORK, NY; Owner: AMERICAN BROADCASTING COMPANIES, INC)
WPIX (Channel 11; NEW YORK, NY; Owner: WPIX, INC.)
WWOR-TV (Channel 9; SECAUCUS, NJ; Owner: FOX TELEVISION STATIONS, INC.)
WPXN-TV (Channel 31; NEW YORK, NY; Owner: PAXSON COMMUNICATIONS LICENSE COMPANY, LLC)
WNBC (Channel 4; NEW YORK, NY; Owner: NATIONAL BROADCASTING COMPANY, INC.)
WNET (Channel 13; NEWARK, NJ; Owner: EDUCATIONAL BROADCASTING CORPORATION)
WXTV (Channel 41; PATERSON, NJ; Owner: WXTV LICENSE PARTNERSHIP, G.P.)
WNJU (Channel 47; LINDEN, NJ; Owner: WNJU LICENSE CORPORATION)
WFUT (Channel 68; NEWARK, NJ; Owner: UNIVISION NEW YORK LLC)
WXNY-LP (Channel 32; NEW YORK, NY; Owner: ISLAND BROADCASTING COMPANY)
WNYE-TV (Channel 25; NEW YORK, NY; Owner: NEW YORK CITY BOARD OF EDUCATION)
WKOB-LP (Channel 53; NEW YORK, NY; Owner: WKOB COMMUNICATIONS, INC.)
WNJT (Channel 52; TRENTON, NJ; Owner: NEW JERSEY PUBLIC BROADCASTING AUTHORITY)
WEBR-CA (Channel 17; MANHATTAN, NY; Owner: K LICENSEE INC.)
WRNN-LP (Channel 57; NYACK, NY; Owner: LP NYACK LIMITED PARTNERSHIP)
WPXO-LP (Channel 34; EAST ORANGE, NJ; Owner: PAXSON COMMUNICATIONS LPTV, INC.)
WWSI (Channel 62; ATLANTIC CITY, NJ; Owner: HISPANIC BROADCASTERS OF PHILADELPHIA, L.L.C.)
W60AI (Channel 60; NEW YORK, NY; Owner: VENTANA TELEVISION, INC.)
WLBX-LP (Channel 22; CRANFORD, NJ; Owner: RENARD COMMUNICATIONS CORP.)
FCC Registered Cell Phone Towers: 1
104 Old Mill Road (Lat: 40.149556 Lon: -74.051806), Call Sign: KNKA795Assigned Frequencies: 880.020 MHz, 880.020 MHz, 891.510 MHz, 891.510 MHz, 835.020 MHz, 835.020 MHz, 846.510 MHz, 846.510 MHzGrant Date: 10/25/2016, Expiration Date: 11/29/2026Registrant: Verizon Wireless, 5055 North Point Pkwy, Np2ne Network Engineering, Alpharetta, GA 30022, Phone: (770) 797-1070, Fax: (770) 797-1036, Email:
FCC Registered Microwave Towers: 1
NJ0081, 541 Old Mill Road (Lat: 40.149750 Lon: -74.052056), Type: Tank, Structure height: 51.8 m, Call Sign: WQNJ759, Assigned Frequencies: 10855.0 MHz, 17865.0 MHz, Grant Date: 02/25/2011, Expiration Date: 02/25/2021, Cancellation Date: 11/08/2011, Certifier: Madanraj Jothi, Registrant: Open Range Communications Inc., 6430 S. Fiddlers Green Circle, Suite 500, Greenwood Village, CO 80111, Phone: (303) 376-2112, Fax: (303) 376-2109, Email:
FCC Registered Amateur Radio Licenses: 12 (
See the full list of FCC Registered Amateur Radio Licenses in Spring Lake Heights )
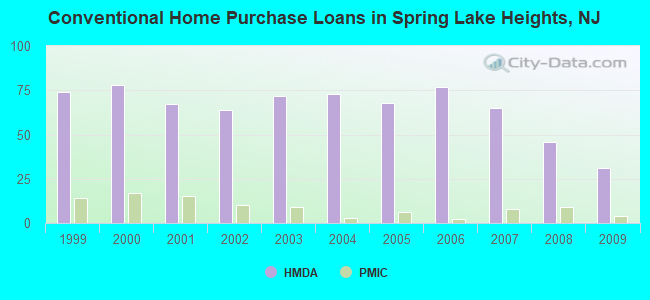
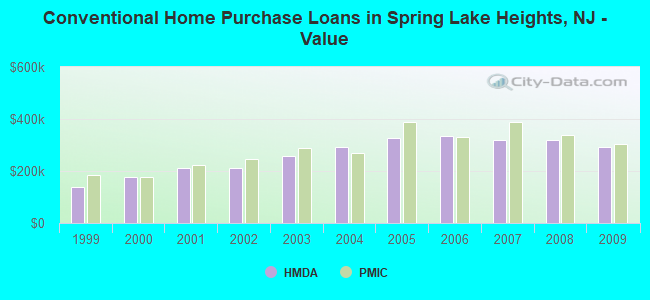
Home Mortgage Disclosure Act Aggregated Statistics For Year 2009(Based on 1 full tract) A) FHA, FSA/RHS & VA B) Conventional C) Refinancings D) Home Improvement Loans E) Loans on Dwellings For 5+ Families F) Non-occupant Loans on Number Average Value Number Average Value Number Average Value Number Average Value Number Average Value Number Average Value
LOANS ORIGINATED 3 $291,333 31 $293,645 189 $280,513 10 $141,700 1 $1,280,000 58 $303,034 APPLICATIONS APPROVED, NOT ACCEPTED 0 $0 6 $344,000 13 $233,308 3 $31,667 0 $0 6 $200,167 APPLICATIONS DENIED 0 $0 3 $255,000 41 $319,439 5 $211,400 0 $0 10 $319,900 APPLICATIONS WITHDRAWN 0 $0 4 $254,750 16 $283,812 2 $225,500 0 $0 6 $235,500 FILES CLOSED FOR INCOMPLETENESS 0 $0 3 $382,333 5 $306,800 0 $0 0 $0 1 $384,000
Aggregated Statistics For Year 2008(Based on 1 full tract) A) FHA, FSA/RHS & VA B) Conventional C) Refinancings D) Home Improvement Loans F) Non-occupant Loans on Number Average Value Number Average Value Number Average Value Number Average Value Number Average Value
LOANS ORIGINATED 3 $400,000 46 $318,370 63 $258,968 10 $49,400 24 $252,125 APPLICATIONS APPROVED, NOT ACCEPTED 0 $0 8 $336,000 11 $334,909 0 $0 3 $314,333 APPLICATIONS DENIED 0 $0 2 $255,000 30 $322,800 6 $73,500 3 $363,000 APPLICATIONS WITHDRAWN 0 $0 8 $364,875 10 $326,600 1 $265,000 6 $345,000 FILES CLOSED FOR INCOMPLETENESS 0 $0 1 $620,000 4 $343,500 0 $0 0 $0
Aggregated Statistics For Year 2007(Based on 1 full tract) B) Conventional C) Refinancings D) Home Improvement Loans F) Non-occupant Loans on Number Average Value Number Average Value Number Average Value Number Average Value
LOANS ORIGINATED 65 $320,185 93 $273,183 23 $63,696 37 $333,135 APPLICATIONS APPROVED, NOT ACCEPTED 4 $367,750 19 $228,947 4 $45,500 7 $320,857 APPLICATIONS DENIED 14 $376,571 38 $301,342 6 $113,500 13 $282,692 APPLICATIONS WITHDRAWN 5 $153,000 23 $422,826 1 $51,000 5 $207,600 FILES CLOSED FOR INCOMPLETENESS 1 $320,000 3 $524,333 1 $50,000 1 $320,000
Aggregated Statistics For Year 2006(Based on 1 full tract) B) Conventional C) Refinancings D) Home Improvement Loans F) Non-occupant Loans on Number Average Value Number Average Value Number Average Value Number Average Value
LOANS ORIGINATED 77 $336,416 112 $265,286 26 $90,538 48 $313,708 APPLICATIONS APPROVED, NOT ACCEPTED 12 $312,833 23 $259,435 4 $12,750 4 $319,250 APPLICATIONS DENIED 9 $298,111 40 $373,200 12 $153,250 12 $325,167 APPLICATIONS WITHDRAWN 5 $363,800 22 $325,091 1 $60,000 3 $283,667 FILES CLOSED FOR INCOMPLETENESS 0 $0 8 $358,000 0 $0 1 $370,000
Aggregated Statistics For Year 2005(Based on 1 full tract) B) Conventional C) Refinancings D) Home Improvement Loans E) Loans on Dwellings For 5+ Families F) Non-occupant Loans on G) Loans On Manufactured Number Average Value Number Average Value Number Average Value Number Average Value Number Average Value Number Average Value
LOANS ORIGINATED 68 $326,897 121 $267,264 24 $89,542 2 $11,300,000 38 $290,711 1 $350,000 APPLICATIONS APPROVED, NOT ACCEPTED 10 $379,400 15 $183,400 7 $75,714 0 $0 5 $279,000 0 $0 APPLICATIONS DENIED 10 $384,600 23 $342,739 4 $256,250 0 $0 8 $364,625 0 $0 APPLICATIONS WITHDRAWN 12 $386,667 36 $282,139 6 $297,333 0 $0 10 $393,100 0 $0 FILES CLOSED FOR INCOMPLETENESS 0 $0 8 $255,625 3 $56,667 0 $0 2 $227,500 0 $0
Aggregated Statistics For Year 2004(Based on 1 full tract) A) FHA, FSA/RHS & VA B) Conventional C) Refinancings D) Home Improvement Loans F) Non-occupant Loans on Number Average Value Number Average Value Number Average Value Number Average Value Number Average Value
LOANS ORIGINATED 0 $0 73 $293,370 143 $234,986 27 $65,630 46 $261,565 APPLICATIONS APPROVED, NOT ACCEPTED 0 $0 13 $339,077 10 $171,800 2 $42,500 5 $354,600 APPLICATIONS DENIED 0 $0 8 $497,750 32 $195,562 10 $84,100 3 $151,667 APPLICATIONS WITHDRAWN 0 $0 7 $371,857 23 $256,478 7 $71,143 4 $459,750 FILES CLOSED FOR INCOMPLETENESS 1 $240,000 2 $332,500 5 $227,800 0 $0 1 $440,000
Aggregated Statistics For Year 2003(Based on 1 full tract) A) FHA, FSA/RHS & VA B) Conventional C) Refinancings D) Home Improvement Loans E) Loans on Dwellings For 5+ Families F) Non-occupant Loans on Number Average Value Number Average Value Number Average Value Number Average Value Number Average Value Number Average Value
LOANS ORIGINATED 0 $0 72 $256,194 356 $181,683 12 $65,500 1 $800,000 83 $198,747 APPLICATIONS APPROVED, NOT ACCEPTED 0 $0 8 $277,750 50 $177,140 8 $50,375 0 $0 5 $195,400 APPLICATIONS DENIED 0 $0 7 $265,000 53 $208,075 12 $115,833 0 $0 6 $162,333 APPLICATIONS WITHDRAWN 1 $291,000 9 $254,667 46 $205,696 5 $72,400 0 $0 7 $209,143 FILES CLOSED FOR INCOMPLETENESS 0 $0 0 $0 13 $217,923 2 $61,500 0 $0 3 $157,667
Aggregated Statistics For Year 2002(Based on 1 full tract) A) FHA, FSA/RHS & VA B) Conventional C) Refinancings D) Home Improvement Loans F) Non-occupant Loans on Number Average Value Number Average Value Number Average Value Number Average Value Number Average Value
LOANS ORIGINATED 1 $140,000 64 $212,031 249 $174,510 29 $63,828 43 $194,233 APPLICATIONS APPROVED, NOT ACCEPTED 0 $0 9 $250,889 27 $155,741 4 $129,500 7 $178,143 APPLICATIONS DENIED 1 $217,000 6 $186,667 46 $176,022 8 $76,625 6 $143,333 APPLICATIONS WITHDRAWN 0 $0 4 $224,250 34 $1,043,588 5 $39,200 4 $121,250 FILES CLOSED FOR INCOMPLETENESS 0 $0 2 $266,000 12 $204,667 1 $30,000 1 $242,000
Aggregated Statistics For Year 2001(Based on 1 full tract) A) FHA, FSA/RHS & VA B) Conventional C) Refinancings D) Home Improvement Loans E) Loans on Dwellings For 5+ Families F) Non-occupant Loans on Number Average Value Number Average Value Number Average Value Number Average Value Number Average Value Number Average Value
LOANS ORIGINATED 1 $122,000 67 $211,672 181 $171,110 17 $41,000 0 $0 27 $182,333 APPLICATIONS APPROVED, NOT ACCEPTED 0 $0 6 $166,500 17 $163,529 6 $28,833 1 $180,000 2 $133,000 APPLICATIONS DENIED 0 $0 6 $291,000 39 $171,436 8 $20,875 0 $0 1 $10,000 APPLICATIONS WITHDRAWN 0 $0 2 $260,500 22 $125,545 3 $33,333 0 $0 1 $150,000 FILES CLOSED FOR INCOMPLETENESS 0 $0 1 $240,000 10 $174,200 1 $15,000 0 $0 0 $0
Aggregated Statistics For Year 2000(Based on 1 full tract) A) FHA, FSA/RHS & VA B) Conventional C) Refinancings D) Home Improvement Loans F) Non-occupant Loans on Number Average Value Number Average Value Number Average Value Number Average Value Number Average Value
LOANS ORIGINATED 0 $0 78 $176,872 49 $139,163 28 $39,286 15 $163,533 APPLICATIONS APPROVED, NOT ACCEPTED 1 $152,000 7 $141,143 16 $99,500 2 $27,500 0 $0 APPLICATIONS DENIED 0 $0 12 $165,250 20 $162,150 14 $59,143 2 $49,000 APPLICATIONS WITHDRAWN 0 $0 5 $149,200 11 $147,091 6 $41,667 2 $45,000 FILES CLOSED FOR INCOMPLETENESS 0 $0 1 $60,000 3 $158,667 1 $150,000 0 $0
Aggregated Statistics For Year 1999(Based on 1 full tract) A) FHA, FSA/RHS & VA B) Conventional C) Refinancings D) Home Improvement Loans F) Non-occupant Loans on Number Average Value Number Average Value Number Average Value Number Average Value Number Average Value
LOANS ORIGINATED 5 $119,960 74 $138,167 97 $114,129 17 $31,125 28 $128,768 APPLICATIONS APPROVED, NOT ACCEPTED 2 $177,650 6 $113,180 14 $127,779 7 $42,297 2 $358,165 APPLICATIONS DENIED 0 $0 11 $193,885 38 $136,881 16 $34,562 4 $120,105 APPLICATIONS WITHDRAWN 1 $166,190 4 $98,375 28 $101,411 1 $42,980 0 $0 FILES CLOSED FOR INCOMPLETENESS 0 $0 3 $143,903 8 $147,921 2 $18,145 0 $0
Detailed HMDA statistics for the following Tracts:
8089.00
Private Mortgage Insurance Companies Aggregated Statistics For Year 2009(Based on 1 full tract) A) Conventional B) Refinancings C) Non-occupant Loans on Number Average Value Number Average Value Number Average Value
LOANS ORIGINATED 4 $304,500 1 $350,000 1 $401,000 APPLICATIONS APPROVED, NOT ACCEPTED 3 $399,000 1 $374,000 3 $362,667 APPLICATIONS DENIED 4 $348,500 0 $0 2 $401,000 APPLICATIONS WITHDRAWN 0 $0 1 $295,000 0 $0 FILES CLOSED FOR INCOMPLETENESS 0 $0 0 $0 0 $0
Aggregated Statistics For Year 2008(Based on 1 full tract) A) Conventional B) Refinancings C) Non-occupant Loans on Number Average Value Number Average Value Number Average Value
LOANS ORIGINATED 9 $337,222 0 $0 1 $313,000 APPLICATIONS APPROVED, NOT ACCEPTED 5 $348,400 1 $396,000 0 $0 APPLICATIONS DENIED 2 $195,000 0 $0 1 $190,000 APPLICATIONS WITHDRAWN 1 $374,000 1 $385,000 0 $0 FILES CLOSED FOR INCOMPLETENESS 0 $0 0 $0 0 $0
Aggregated Statistics For Year 2007(Based on 1 full tract) A) Conventional B) Refinancings C) Non-occupant Loans on Number Average Value Number Average Value Number Average Value
LOANS ORIGINATED 8 $390,000 1 $387,000 2 $353,000 APPLICATIONS APPROVED, NOT ACCEPTED 1 $489,000 1 $387,000 0 $0 APPLICATIONS DENIED 0 $0 0 $0 0 $0 APPLICATIONS WITHDRAWN 0 $0 0 $0 0 $0 FILES CLOSED FOR INCOMPLETENESS 0 $0 1 $387,000 0 $0
Aggregated Statistics For Year 2006(Based on 1 full tract) A) Conventional B) Refinancings C) Non-occupant Loans on Number Average Value Number Average Value Number Average Value
LOANS ORIGINATED 2 $331,000 1 $512,000 2 $331,000 APPLICATIONS APPROVED, NOT ACCEPTED 0 $0 0 $0 0 $0 APPLICATIONS DENIED 0 $0 0 $0 0 $0 APPLICATIONS WITHDRAWN 1 $387,000 0 $0 1 $387,000 FILES CLOSED FOR INCOMPLETENESS 0 $0 0 $0 0 $0
Aggregated Statistics For Year 2005(Based on 1 full tract) A) Conventional B) Refinancings C) Non-occupant Loans on Number Average Value Number Average Value Number Average Value
LOANS ORIGINATED 6 $388,833 0 $0 1 $356,000 APPLICATIONS APPROVED, NOT ACCEPTED 3 $477,667 2 $486,000 2 $403,000 APPLICATIONS DENIED 0 $0 0 $0 0 $0 APPLICATIONS WITHDRAWN 0 $0 0 $0 0 $0 FILES CLOSED FOR INCOMPLETENESS 0 $0 0 $0 0 $0
Aggregated Statistics For Year 2004(Based on 1 full tract) A) Conventional B) Refinancings C) Non-occupant Loans on Number Average Value Number Average Value Number Average Value
LOANS ORIGINATED 3 $271,000 2 $297,500 2 $219,000 APPLICATIONS APPROVED, NOT ACCEPTED 2 $295,500 0 $0 0 $0 APPLICATIONS DENIED 0 $0 0 $0 0 $0 APPLICATIONS WITHDRAWN 0 $0 0 $0 0 $0 FILES CLOSED FOR INCOMPLETENESS 0 $0 0 $0 0 $0
Aggregated Statistics For Year 2003(Based on 1 full tract) A) Conventional B) Refinancings C) Non-occupant Loans on Number Average Value Number Average Value Number Average Value
LOANS ORIGINATED 9 $286,889 9 $260,778 2 $218,000 APPLICATIONS APPROVED, NOT ACCEPTED 0 $0 3 $270,667 0 $0 APPLICATIONS DENIED 0 $0 1 $143,000 0 $0 APPLICATIONS WITHDRAWN 0 $0 1 $368,000 0 $0 FILES CLOSED FOR INCOMPLETENESS 0 $0 0 $0 0 $0
Aggregated Statistics For Year 2002(Based on 1 full tract) A) Conventional B) Refinancings C) Non-occupant Loans on Number Average Value Number Average Value Number Average Value
LOANS ORIGINATED 10 $244,300 2 $267,000 2 $132,500 APPLICATIONS APPROVED, NOT ACCEPTED 3 $233,000 1 $225,000 0 $0 APPLICATIONS DENIED 0 $0 0 $0 0 $0 APPLICATIONS WITHDRAWN 0 $0 0 $0 0 $0 FILES CLOSED FOR INCOMPLETENESS 0 $0 0 $0 0 $0
Aggregated Statistics For Year 2001(Based on 1 full tract) A) Conventional B) Refinancings C) Non-occupant Loans on Number Average Value Number Average Value Number Average Value
LOANS ORIGINATED 15 $222,067 4 $226,000 2 $158,000 APPLICATIONS APPROVED, NOT ACCEPTED 1 $341,000 0 $0 0 $0 APPLICATIONS DENIED 0 $0 0 $0 0 $0 APPLICATIONS WITHDRAWN 0 $0 0 $0 0 $0 FILES CLOSED FOR INCOMPLETENESS 0 $0 0 $0 0 $0
Aggregated Statistics For Year 2000(Based on 1 full tract) A) Conventional B) Refinancings C) Non-occupant Loans on Number Average Value Number Average Value Number Average Value
LOANS ORIGINATED 17 $175,882 3 $233,333 6 $188,500 APPLICATIONS APPROVED, NOT ACCEPTED 3 $170,667 0 $0 0 $0 APPLICATIONS DENIED 1 $223,000 2 $283,500 0 $0 APPLICATIONS WITHDRAWN 1 $223,000 0 $0 0 $0 FILES CLOSED FOR INCOMPLETENESS 0 $0 0 $0 0 $0
Aggregated Statistics For Year 1999(Based on 1 full tract) A) Conventional B) Refinancings Number Average Value Number Average Value
LOANS ORIGINATED 14 $184,266 2 $150,905 APPLICATIONS APPROVED, NOT ACCEPTED 4 $168,815 0 $0 APPLICATIONS DENIED 0 $0 0 $0 APPLICATIONS WITHDRAWN 1 $125,120 0 $0 FILES CLOSED FOR INCOMPLETENESS 0 $0 0 $0
Detailed PMIC statistics for the following Tracts:
8089.00
Spring Lake Heights compared to New Jersey state average:
Median house value above state average. Unemployed percentage below state average. Black race population percentage significantly below state average. Hispanic race population percentage significantly below state average. Median age significantly above state average. Foreign-born population percentage significantly below state average. Length of stay since moving in significantly above state average. Number of college students below state average. Percentage of population with a bachelor's degree or higher above state average. Spring Lake Heights on our top lists :
#33 on the list of "Top 101 cities with the most residents born in Ireland (population 500+)"
#32 (07762) on the list of "Top 101 zip codes with the largest percentage of Irish first ancestries (pop 5,000+)"
#13 on the list of "Top 101 counties with the lowest number of infant deaths per 1000 residents 2007-2013 (pop. 50,000+)"
#16 on the list of "Top 101 counties with the lowest percentage of residents that keep firearms around their homes"
#26 on the list of "Top 101 counties with the lowest percentage of residents relocating to foreign countries in 2011"
#33 on the list of "Top 101 counties with the largest decrease in the number of births per 1000 residents 2000-2006 to 2007-2013 (pop 50,000+)"
#39 on the list of "Top 101 counties with the highest percentage of residents that visited a dentist within the past year"
Top Patent Applicants
Raymond O'Neill (3)
Elizabeth Davino (2)
Walter Babbitt (2)
Stacy Weber (2)
Luke Dennis Pearsall (1)
Total of 9 patent applications in 2008-2024.


 Recent articles from our blog. Our writers, many of them Ph.D. graduates or candidates, create easy-to-read articles on a wide variety of topics.

 (13.7 miles
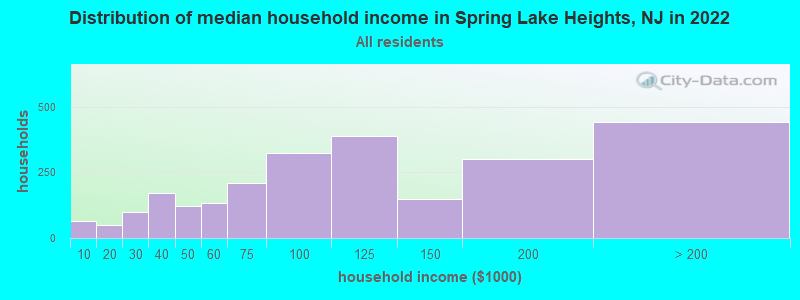


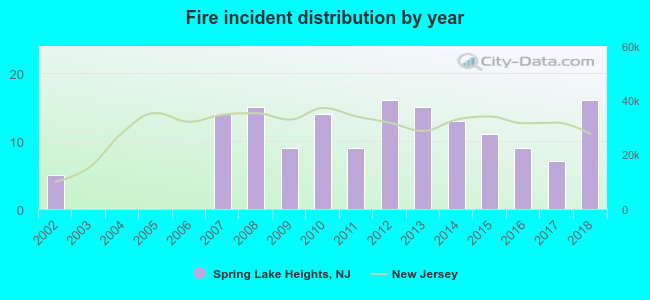 According to the data from the years 2002 - 2018 the average number of fires per year is 9. The highest number of fires - 16 took place in 2012, and the least - 0 in 2003. The data has an increasing trend.
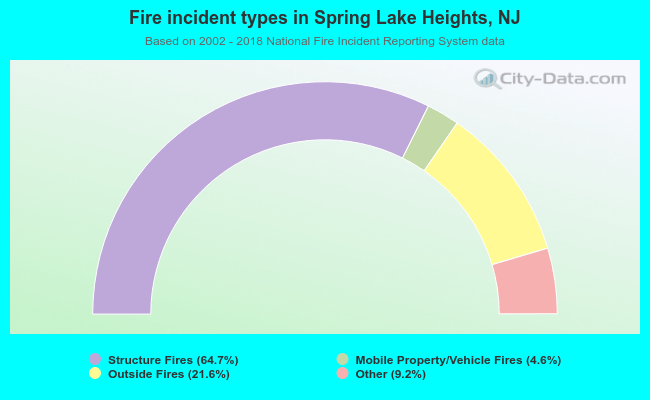 When looking into fire subcategories, the most incidents belonged to: Structure Fires (64.7%), and Outside Fires (21.6%).