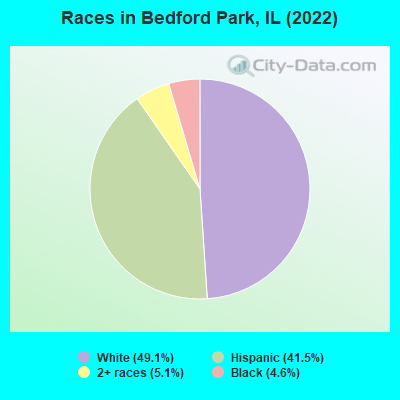
Percentage of residents living in poverty in 2022: 8.7%
(1.9% for White Non-Hispanic residents, 23.1% for Black residents, 15.4% for Hispanic or Latino residents, 36.5% for other race residents)
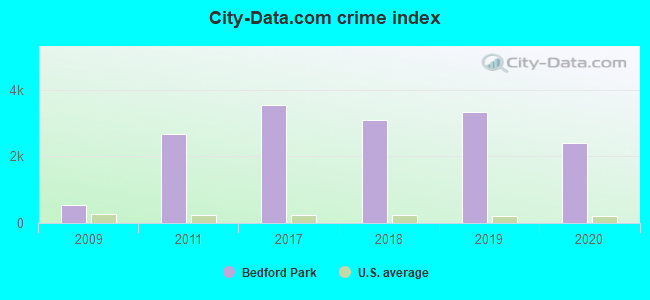
The City-Data.com crime index weighs serious crimes and violent crimes more heavily. Higher means more crime, U.S. average is 246.1. It adjusts for the number of visitors and daily workers commuting into cities.
Latest news from Bedford Park, IL collected exclusively by city-data.com from local newspapers, TV, and radio stations
Ancestries: Polish (15.6%), Irish (9.2%), German (5.3%), Italian (4.4%), American (3.3%), Greek (3.1%).
Current Local Time: CST time zone
Incorporated on 05/01/1940
Elevation: 612 feet
Land area: 5.97 square miles.
Population density: 98 people per square mile (very low).
82 residents are foreign born (7.4% Latin America, 5.8% Europe).
This village:
13.6%
Illinois:
14.1%
Median real estate property taxes paid for housing units with mortgages in 2022: $5,578 (2.2%) Median real estate property taxes paid for housing units with no mortgage in 2022: $6,697 (2.5%)
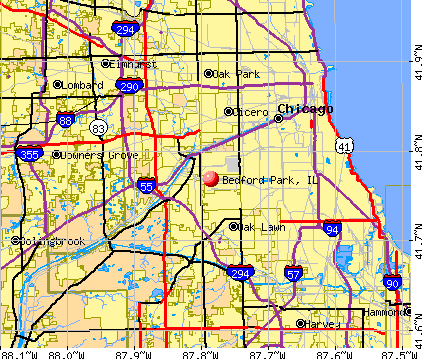
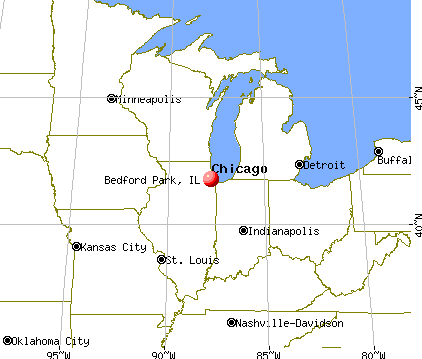
Nearest city with pop. 50,000+: Oak Lawn, IL (4.1 miles , pop. 55,245).
Nearest city with pop. 200,000+: Chicago, IL (7.4 miles , pop. 2,896,016).
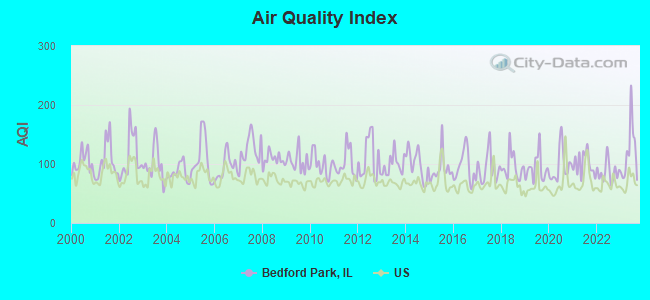
Air Quality Index (AQI) level in 2023 was 119. This is significantly worse than average.
City:
119
U.S.:
73
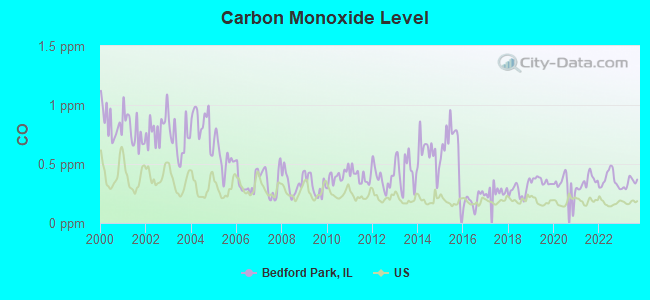
Carbon Monoxide (CO) [ppm] level in 2023 was 0.339. This is worse than average.Closest monitor was 3.1 miles away from the city center.
City:
0.339
U.S.:
0.251
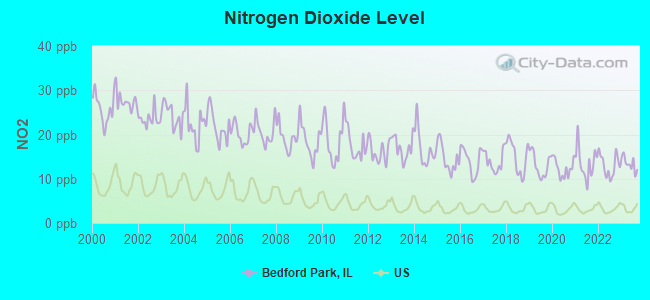
Nitrogen Dioxide (NO2) [ppb] level in 2023 was 13.4. This is significantly worse than average.Closest monitor was 0.9 miles away from the city center.
City:
13.4
U.S.:
5.1
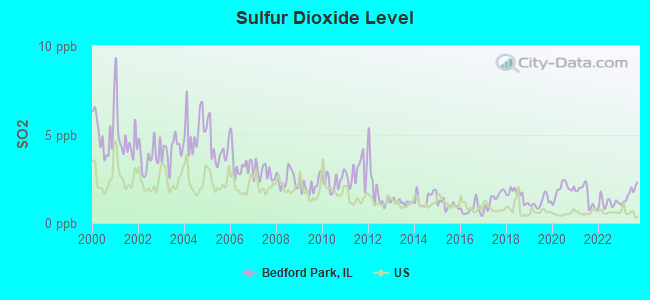
Sulfur Dioxide (SO2) [ppb] level in 2023 was 1.64. This is about average.Closest monitor was 0.9 miles away from the city center.
City:
1.64
U.S.:
1.51
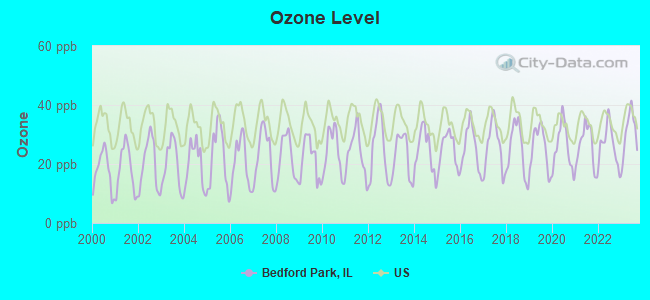
Ozone [ppb] level in 2023 was 30.7. This is about average.Closest monitor was 1.4 miles away from the city center.
City:
30.7
U.S.:
33.3
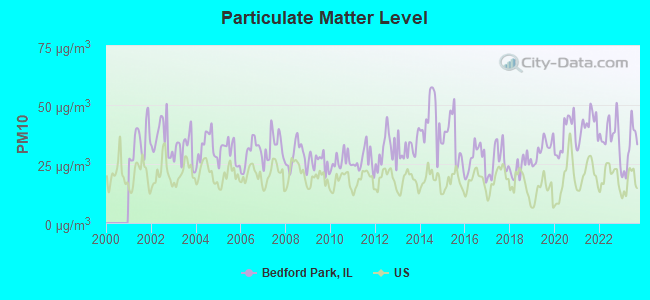
Particulate Matter (PM10) [µg/m3] level in 2023 was 31.2. This is significantly worse than average.Closest monitor was 1.4 miles away from the city center.
City:
31.2
U.S.:
19.2
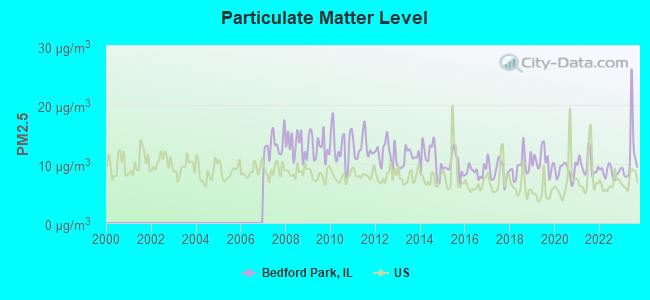
Particulate Matter (PM2.5) [µg/m3] level in 2023 was 11.4. This is significantly worse than average.Closest monitor was 1.4 miles away from the city center.
City:
11.4
U.S.:
8.1
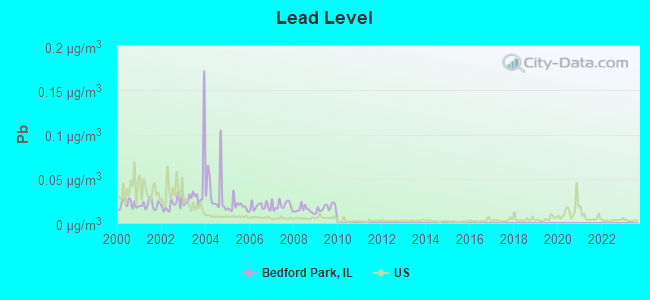
Lead (Pb) [µg/m3] level in 2009 was 0.0171. This is significantly worse than average.Closest monitor was 0.9 miles away from the city center.
City:
0.0171
U.S.:
0.0093
Tornado activity:
Bedford Park-area historical tornado activity is slightly below Illinois state average. It is 51% greater than the overall U.S. average.
On 8/28/1990, a category F5 (max. wind speeds 261-318 mph) tornado 23.6 miles away from the Bedford Park village center killed 29 peopleand injured 350 peopleand causedbetween $50,000 and $500,000 in damages.
On 4/21/1967, a category F4 (max. wind speeds 207-260 mph) tornado 7.2 miles away from the village center killed 33 peopleand injured 500 peopleand causedbetween $5,000,000 and $50,000,000 in damages.
Earthquake activity:
Bedford Park-area historical earthquake activity is significantly above Illinois state average. It is 42% greater than the overall U.S. average.
On 4/18/2008 at 09:36:59, a magnitude 5.4 (5.1 MB, 4.8 MS, 5.4 MW, 5.2 MW, Class: Moderate, Intensity: VI - VII) earthquake occurred 229.5 miles away from Bedford Park center On 6/10/1987 at 23:48:54, a magnitude 5.1 (4.9 MB, 4.4 MS, 4.6 MS, 5.1 LG) earthquake occurred 203.9 miles away from the city center On 4/18/2008 at 09:36:59, a magnitude 5.2 (5.2 MW, Depth: 8.9 mi) earthquake occurred 229.5 miles away from Bedford Park center On 6/28/2004 at 06:10:52, a magnitude 4.2 (4.2 MW, Depth: 6.2 mi, Class: Light, Intensity: IV - V) earthquake occurred 61.4 miles away from the city center On 6/18/2002 at 17:37:15, a magnitude 5.0 (4.3 MB, 4.6 MW, 5.0 LG) earthquake occurred 261.6 miles away from the city center On 4/18/2008 at 15:14:16, a magnitude 4.8 (4.5 MB, 4.8 MW, 4.6 MW) earthquake occurred 227.8 miles away from the city center Magnitude types: regional Lg-wave magnitude (LG), body-wave magnitude (MB), surface-wave magnitude (MS), moment magnitude (MW)
Natural disasters:
The number of natural disasters in Cook County (20) is greater than the US average (15). Major Disasters (Presidential) Declared: 15 Emergencies Declared: 4
Causes of natural disasters: Floods: 13, Storms: 12, Tornadoes: 3, Snowstorms: 2, Winter Storms: 2, Blizzard: 1, Hurricane: 1, Snow: 1, Wind: 1, Other: 1 (Note: some incidents may be assigned to more than one category).
Hospitals and medical centers near Bedford Park:
PREMIER HOME HEALTH CARE (Home Health Center, about 1 miles away; CHICAGO, IL)
FMC - MIDWAY DIALYSIS (Dialysis Facility, about 1 miles away; CHICAGO, IL)
MIDWEST PEARL HOME HEALTH CARE INC (Home Health Center, about 1 miles away; CHICAGO, IL)
ARDENT HOME HEALTH CARE INC (Home Health Center, about 1 miles away; CHICAGO, IL)
HELPING HAND IC FACILITY (Hospital, about 2 miles away; SUMMIT, IL)
EXCEPTIONAL CARE, LLC (Nursing Home, about 2 miles away; BURBANK, IL)
SUNSET HOUSE (Nursing Home, about 2 miles away; BURBANK, IL)
Amtrak stations near Bedford Park:
3 miles: SUMMIT (ARCHER & CENTER AVE.) . Services: public payphones, free short-term parking, free long-term parking, call for taxi service, public transit connection.
6 miles: LA GRANGE ROAD (LA GRANGE, 25 W. BURLINGTON AVE.) . Services: enclosed waiting area, public payphones, taxi stand, public transit connection.
11 miles: CHICAGO (225 S. CANAL ST.) . Services: ticket office, partially wheelchair accessible, enclosed waiting area, public restrooms, public payphones, snack bar, paid short-term parking, paid long-term parking, call for car rental service, taxi stand, public transit connection.
Colleges/Universities in Bedford Park:
Everest College-Bedford Park (Full-time enrollment: 1,341; Location: 7414 South Cicero Avenue; Private, for-profit; Website: www.everest.edu/campus/bedford_park)
Fox College (Full-time enrollment: 411; Location: 6640 S. Cicero; Private, for-profit; Website: www.foxcollege.edu)
Colleges/universities with over 2000 students nearest to Bedford Park:
City Colleges of Chicago-Richard J Daley College (about 4 miles; Chicago, IL; Full-time enrollment: 7,497)
Morton College (about 5 miles; Cicero, IL; FT enrollment: 3,236)
Saint Xavier University (about 6 miles; Chicago, IL; FT enrollment: 3,576)
Moraine Valley Community College (about 6 miles; Palos Hills, IL; FT enrollment: 12,008)
City Colleges of Chicago-Kennedy-King College (about 8 miles; Chicago, IL; FT enrollment: 5,044)
Concordia University-Chicago (about 10 miles; River Forest, IL; FT enrollment: 3,944)
Illinois Institute of Technology (about 10 miles; Chicago, IL; FT enrollment: 5,450)
BEDFORD PARK PUBLIC LIBRARY DISTRICT (Operating income: $1,108,150; Location: 7816 WEST 65TH PLACE; 96,712 books; 3,183 audio materials; 1,616 video materials; 1 local licensed databases; 2 state licensed databases; 200 print serial subscriptions; 203 electronic serial subscriptions)
Notable locations in Bedford Park: Nalco Company Fire Department (A), Bedford Park Fire Department Station 3 (B), Bedford Park Fire Department Station 2 (C), Bedford Park Fire Department Station 1 (D). Display/hide their locations on the map
Hotels: Hampton Inn-Midway Airport (6540 South Cicero Avenue) (1), Holiday Inn Express & Suites CHGO Midway Airport (6500 South Cicero Avenue) (2), Fairfield Inn by Marriott - Chicago-Midway Airport (6630 South Cicero Avenue) (3). Display/hide their approximate locations on the map
Cook County has a predicted average indoor radon screening level between 2 and 4 pCi/L (pico curies per liter) - Moderate Potential
Drinking water stations with addresses in Bedford Park that have no violations reported:
BEDFORD PARK (Address: 6701 S ARCHER AVE , Population served: 1,000,Primary Water Source Type: Purch surface water)
Average household size:
This village:
2.8 people
Illinois:
2.6 people
Percentage of family households:
This village:
72.9%
Whole state:
65.8%
Percentage of households with unmarried partners:
This village:
5.7%
Whole state:
6.3%
Likely homosexual households (counted as self-reported same-sex unmarried-partner households)
Lesbian couples: 0.5% of all households
Gay men: 0.0% of all households
Banks with branches in Bedford Park (2011 data):
TCF National Bank: Bedford Park #2087 Branch at 7400 South Cicero, branch established on 2004/09/20. Info updated 2009/11/23: Bank assets: $19,007.0 mil, Deposits: $12,377.0 mil, headquarters in Sioux Falls, SD, positive income, Commercial Lending Specialization, 441 total offices, Holding Company: Tcf Financial Corporation
Religion statistics for Bedford Park, IL (based on Cook County data)
Religion
Adherents
Congregations
Catholic
1,947,223
376
Evangelical Protestant
432,975
1,484
Other
312,636
403
Mainline Protestant
202,114
630
Black Protestant
148,895
395
Orthodox
53,276
66
None
2,097,556
-
Source: Clifford Grammich, Kirk Hadaway, Richard Houseal, Dale E.Jones, Alexei Krindatch, Richie Stanley and Richard H.Taylor. 2012. 2010 U.S.Religion Census: Religious Congregations & Membership Study. Association of Statisticians of American Religious Bodies. Jones, Dale E., et al. 2002. Congregations and Membership in the United States 2000. Nashville, TN: Glenmary Research Center. Graphs represent county-level data
Call Sign: N9LAK, Licensee ID: L00328347, Grant Date: 02/27/2001, Expiration Date: 04/23/2011, Cancellation Date: 04/24/2013, Registrant: Lawrence F Drozdz, 7720 W 66th Pl, Bedford Park, IL 60501
Call Sign: N9UXL, Grant Date: 09/26/1994, Expiration Date: 09/21/2003, Cancellation Date: 09/22/2005, Registrant: James Z Rapacz, Bedford Park, IL 60499
Call Sign: WB9DZN, Grant Date: 02/24/1998, Expiration Date: 02/24/2008, Cancellation Date: 02/25/2010, Registrant: Donald E Bojanowski, 7802 W 66th Pl, Bedford Park, IL 60501-1902
FAA Registered Aircraft:
1
Aircraft: BOMBARDIER INC BD-100-1A10 (Category: Land, Engines: 2, Seats: 8, Weight: 20,000+ Pounds), Engine: HONEYWELL AS907-1-1A (6944 Pounds of Thrust) (Turbo-fan) N-Number: 247FS, N247FS, N-247FS, Serial Number: 20068, Year manufactured: 2005, Airworthiness Date: 12/29/2005, Certificate Issue Date: 12/30/2015 Registrant (LLC): Freon Holdings LLC, 5701 W 73rd St, Bedford Park, IL 60638
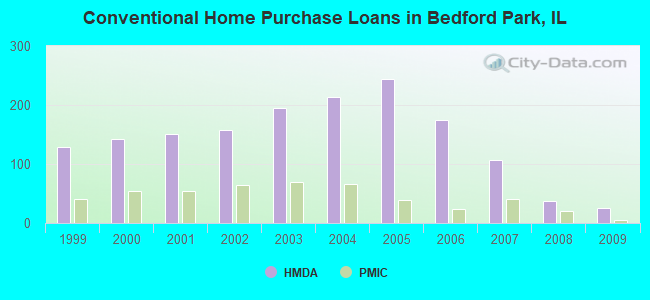
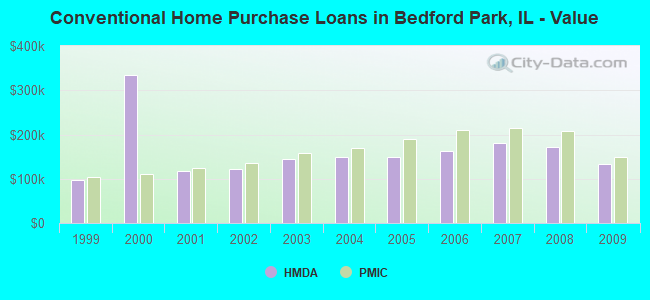
Home Mortgage Disclosure Act Aggregated Statistics For Year 2009 (Based on 4 partial tracts)
A) FHA, FSA/RHS & VA Home Purchase Loans
B) Conventional Home Purchase Loans
C) Refinancings
D) Home Improvement Loans
E) Loans on Dwellings For 5+ Families
F) Non-occupant Loans on < 5 Family Dwellings (A B C & D)
Number
Average Value
Number
Average Value
Number
Average Value
Number
Average Value
Number
Average Value
Number
Average Value
LOANS ORIGINATED
41
$166,169
25
$132,935
144
$160,389
8
$73,840
2
$630,745
4
$118,580
APPLICATIONS APPROVED, NOT ACCEPTED
3
$210,087
4
$192,382
14
$184,799
1
$15,770
0
$0
0
$0
APPLICATIONS DENIED
12
$183,524
8
$165,926
74
$191,369
4
$52,388
0
$0
3
$161,580
APPLICATIONS WITHDRAWN
4
$185,118
4
$120,038
23
$182,426
1
$218,480
0
$0
4
$149,805
FILES CLOSED FOR INCOMPLETENESS
2
$148,915
2
$118,750
15
$171,207
2
$109,945
0
$0
1
$154,720
Aggregated Statistics For Year 2008 (Based on 4 partial tracts)
A) FHA, FSA/RHS & VA Home Purchase Loans
B) Conventional Home Purchase Loans
C) Refinancings
D) Home Improvement Loans
F) Non-occupant Loans on < 5 Family Dwellings (A B C & D)
Number
Average Value
Number
Average Value
Number
Average Value
Number
Average Value
Number
Average Value
LOANS ORIGINATED
17
$207,964
38
$172,663
117
$176,852
12
$42,303
6
$120,715
APPLICATIONS APPROVED, NOT ACCEPTED
0
$0
4
$180,588
19
$173,828
4
$54,440
1
$131,060
APPLICATIONS DENIED
5
$198,656
21
$206,115
104
$211,722
14
$57,480
6
$213,582
APPLICATIONS WITHDRAWN
4
$198,842
8
$202,465
27
$199,442
1
$197,400
0
$0
FILES CLOSED FOR INCOMPLETENESS
1
$156,260
2
$218,100
15
$167,199
3
$78,473
1
$100,750
Aggregated Statistics For Year 2007 (Based on 4 partial tracts)
A) FHA, FSA/RHS & VA Home Purchase Loans
B) Conventional Home Purchase Loans
C) Refinancings
D) Home Improvement Loans
E) Loans on Dwellings For 5+ Families
F) Non-occupant Loans on < 5 Family Dwellings (A B C & D)
G) Loans On Manufactured Home Dwelling (A B C & D)
Number
Average Value
Number
Average Value
Number
Average Value
Number
Average Value
Number
Average Value
Number
Average Value
Number
Average Value
LOANS ORIGINATED
6
$214,182
107
$181,908
234
$165,952
24
$87,076
1
$213,980
17
$144,048
0
$0
APPLICATIONS APPROVED, NOT ACCEPTED
0
$0
16
$150,314
39
$165,637
6
$86,685
0
$0
3
$126,023
0
$0
APPLICATIONS DENIED
1
$164,990
44
$198,041
157
$178,958
23
$86,179
0
$0
10
$182,969
2
$25,810
APPLICATIONS WITHDRAWN
0
$0
14
$139,469
46
$201,854
4
$132,570
0
$0
3
$238,360
0
$0
FILES CLOSED FOR INCOMPLETENESS
0
$0
7
$180,629
23
$223,148
1
$82,760
0
$0
0
$0
0
$0
Aggregated Statistics For Year 2006 (Based on 4 partial tracts)
A) FHA, FSA/RHS & VA Home Purchase Loans
B) Conventional Home Purchase Loans
C) Refinancings
D) Home Improvement Loans
E) Loans on Dwellings For 5+ Families
F) Non-occupant Loans on < 5 Family Dwellings (A B C & D)
Number
Average Value
Number
Average Value
Number
Average Value
Number
Average Value
Number
Average Value
Number
Average Value
LOANS ORIGINATED
2
$190,670
175
$162,888
241
$162,316
34
$67,741
1
$554,150
17
$164,662
APPLICATIONS APPROVED, NOT ACCEPTED
0
$0
24
$176,050
50
$181,092
8
$98,794
0
$0
2
$375,965
APPLICATIONS DENIED
0
$0
57
$181,500
122
$176,800
23
$79,415
0
$0
10
$157,037
APPLICATIONS WITHDRAWN
1
$126,580
28
$158,462
62
$185,601
4
$79,745
0
$0
6
$169,932
FILES CLOSED FOR INCOMPLETENESS
0
$0
6
$128,370
18
$162,663
2
$60,260
0
$0
0
$0
Aggregated Statistics For Year 2005 (Based on 4 partial tracts)
A) FHA, FSA/RHS & VA Home Purchase Loans
B) Conventional Home Purchase Loans
C) Refinancings
D) Home Improvement Loans
E) Loans on Dwellings For 5+ Families
F) Non-occupant Loans on < 5 Family Dwellings (A B C & D)
G) Loans On Manufactured Home Dwelling (A B C & D)
Number
Average Value
Number
Average Value
Number
Average Value
Number
Average Value
Number
Average Value
Number
Average Value
Number
Average Value
LOANS ORIGINATED
2
$187,840
244
$149,994
321
$150,252
36
$83,147
3
$405,953
30
$157,602
0
$0
APPLICATIONS APPROVED, NOT ACCEPTED
0
$0
39
$149,180
45
$145,926
9
$80,370
0
$0
2
$95,105
0
$0
APPLICATIONS DENIED
1
$95,420
65
$140,185
149
$160,042
27
$46,120
0
$0
11
$132,318
1
$36,140
APPLICATIONS WITHDRAWN
0
$0
37
$159,680
85
$177,930
8
$66,006
0
$0
8
$152,088
0
$0
FILES CLOSED FOR INCOMPLETENESS
0
$0
7
$132,386
26
$153,408
0
$0
0
$0
1
$50,780
0
$0
Aggregated Statistics For Year 2004 (Based on 4 partial tracts)
A) FHA, FSA/RHS & VA Home Purchase Loans
B) Conventional Home Purchase Loans
C) Refinancings
D) Home Improvement Loans
E) Loans on Dwellings For 5+ Families
F) Non-occupant Loans on < 5 Family Dwellings (A B C & D)
G) Loans On Manufactured Home Dwelling (A B C & D)
Number
Average Value
Number
Average Value
Number
Average Value
Number
Average Value
Number
Average Value
Number
Average Value
Number
Average Value
LOANS ORIGINATED
10
$176,910
213
$149,707
335
$139,633
35
$68,851
3
$288,513
20
$137,747
1
$8,190
APPLICATIONS APPROVED, NOT ACCEPTED
0
$0
28
$132,434
55
$137,408
5
$35,638
0
$0
4
$115,452
0
$0
APPLICATIONS DENIED
0
$0
43
$146,758
145
$154,136
40
$63,887
0
$0
4
$159,352
2
$56,750
APPLICATIONS WITHDRAWN
1
$136,600
24
$131,496
107
$149,293
6
$78,543
0
$0
1
$209,140
0
$0
FILES CLOSED FOR INCOMPLETENESS
2
$193,850
6
$102,182
27
$168,969
1
$176,490
0
$0
0
$0
0
$0
Aggregated Statistics For Year 2003 (Based on 4 partial tracts)
A) FHA, FSA/RHS & VA Home Purchase Loans
B) Conventional Home Purchase Loans
C) Refinancings
D) Home Improvement Loans
E) Loans on Dwellings For 5+ Families
F) Non-occupant Loans on < 5 Family Dwellings (A B C & D)
Number
Average Value
Number
Average Value
Number
Average Value
Number
Average Value
Number
Average Value
Number
Average Value
LOANS ORIGINATED
22
$179,872
195
$144,705
555
$117,328
41
$44,811
7
$295,657
19
$109,105
APPLICATIONS APPROVED, NOT ACCEPTED
2
$113,650
15
$159,146
63
$126,927
5
$61,948
0
$0
4
$116,550
APPLICATIONS DENIED
0
$0
23
$152,617
161
$124,009
22
$31,550
0
$0
4
$127,102
APPLICATIONS WITHDRAWN
1
$111,930
19
$139,957
125
$129,238
8
$39,188
1
$276,190
1
$93,300
FILES CLOSED FOR INCOMPLETENESS
0
$0
6
$152,178
16
$122,842
0
$0
0
$0
0
$0
Aggregated Statistics For Year 2002 (Based on 4 partial tracts)
A) FHA, FSA/RHS & VA Home Purchase Loans
B) Conventional Home Purchase Loans
C) Refinancings
D) Home Improvement Loans
E) Loans on Dwellings For 5+ Families
F) Non-occupant Loans on < 5 Family Dwellings (A B C & D)
Number
Average Value
Number
Average Value
Number
Average Value
Number
Average Value
Number
Average Value
Number
Average Value
LOANS ORIGINATED
23
$144,748
158
$122,938
356
$111,905
18
$27,938
4
$297,285
17
$109,761
APPLICATIONS APPROVED, NOT ACCEPTED
2
$172,130
16
$130,235
53
$107,441
7
$21,561
0
$0
2
$75,690
APPLICATIONS DENIED
1
$148,860
21
$130,286
134
$111,149
13
$20,762
0
$0
4
$113,108
APPLICATIONS WITHDRAWN
1
$155,750
11
$119,433
63
$117,529
3
$17,070
0
$0
0
$0
FILES CLOSED FOR INCOMPLETENESS
1
$165,640
4
$133,055
22
$115,785
0
$0
0
$0
0
$0
Aggregated Statistics For Year 2001 (Based on 4 partial tracts)
A) FHA, FSA/RHS & VA Home Purchase Loans
B) Conventional Home Purchase Loans
C) Refinancings
D) Home Improvement Loans
E) Loans on Dwellings For 5+ Families
F) Non-occupant Loans on < 5 Family Dwellings (A B C & D)
Number
Average Value
Number
Average Value
Number
Average Value
Number
Average Value
Number
Average Value
Number
Average Value
LOANS ORIGINATED
30
$140,260
151
$117,024
316
$104,631
27
$20,964
5
$254,192
11
$118,803
APPLICATIONS APPROVED, NOT ACCEPTED
2
$120,130
9
$129,849
41
$93,650
6
$11,582
0
$0
2
$98,995
APPLICATIONS DENIED
0
$0
13
$97,072
98
$96,233
21
$17,362
1
$147,440
2
$110,990
APPLICATIONS WITHDRAWN
4
$158,410
10
$117,732
62
$103,812
4
$28,790
0
$0
1
$72,080
FILES CLOSED FOR INCOMPLETENESS
0
$0
4
$141,378
15
$109,703
2
$11,980
0
$0
0
$0
Aggregated Statistics For Year 2000 (Based on 4 partial tracts)
A) FHA, FSA/RHS & VA Home Purchase Loans
B) Conventional Home Purchase Loans
C) Refinancings
D) Home Improvement Loans
E) Loans on Dwellings For 5+ Families
F) Non-occupant Loans on < 5 Family Dwellings (A B C & D)
Number
Average Value
Number
Average Value
Number
Average Value
Number
Average Value
Number
Average Value
Number
Average Value
LOANS ORIGINATED
35
$122,747
143
$334,105
105
$80,333
26
$21,793
1
$261,690
6
$81,355
APPLICATIONS APPROVED, NOT ACCEPTED
2
$106,140
7
$127,054
29
$82,655
6
$21,238
0
$0
1
$49,500
APPLICATIONS DENIED
3
$127,047
26
$98,585
76
$80,010
27
$19,029
0
$0
2
$33,425
APPLICATIONS WITHDRAWN
4
$116,962
8
$109,085
38
$79,971
4
$12,285
0
$0
1
$65,770
FILES CLOSED FOR INCOMPLETENESS
2
$98,730
4
$111,808
18
$94,489
0
$0
0
$0
0
$0
Aggregated Statistics For Year 1999 (Based on 4 partial tracts)
A) FHA, FSA/RHS & VA Home Purchase Loans
B) Conventional Home Purchase Loans
C) Refinancings
D) Home Improvement Loans
E) Loans on Dwellings For 5+ Families
F) Non-occupant Loans on < 5 Family Dwellings (A B C & D)
2003 - 2018 National Fire Incident Reporting System (NFIRS) incidents
Based on the data from the years 2003 - 2018 the average number of fires per year is 56. The highest number of reported fires - 97 took place in 2004, and the least - 9 in 2003. The data has a growing trend.
When looking into fire subcategories, the most reports belonged to: Structure Fires (54.5%), and Outside Fires (20.6%).
Fire incident types reported to NFIRS in Bedford Park, IL


 Recent articles from our blog. Our writers, many of them Ph.D. graduates or candidates, create easy-to-read articles on a wide variety of topics.

 (4.1 miles


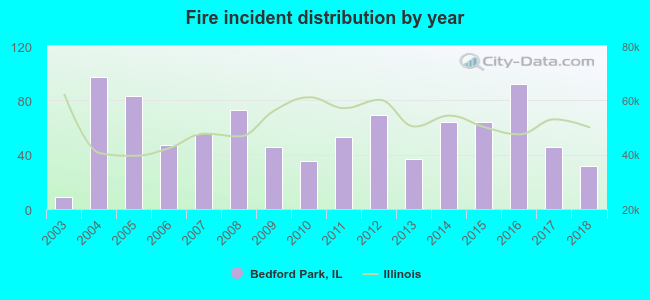 Based on the data from the years 2003 - 2018 the average number of fires per year is 56. The highest number of reported fires - 97 took place in 2004, and the least - 9 in 2003. The data has a growing trend.
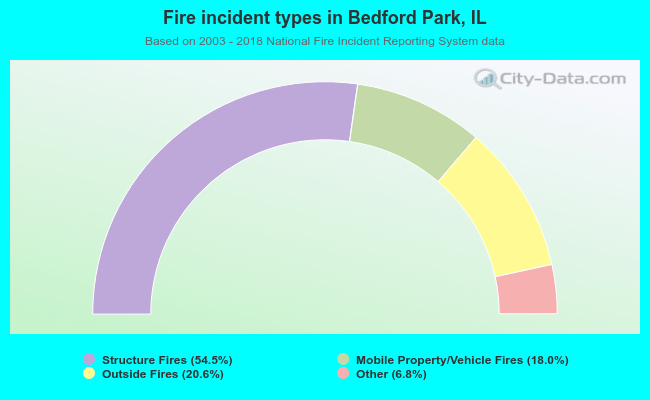 When looking into fire subcategories, the most reports belonged to: Structure Fires (54.5%), and Outside Fires (20.6%).