Boulder City, Nevada Submit your own pictures of this city and show them to the world
OSM Map
General Map
Google Map
MSN Map
OSM Map
General Map
Google Map
MSN Map
OSM Map
General Map
Google Map
MSN Map
OSM Map
General Map
Google Map
MSN Map
Please wait while loading the map...
Population in 2022: 14,890 (94% urban, 6% rural). Population change since 2000: -0.5%Males: 7,460 Females: 7,430
March 2022 cost of living index in Boulder City: 99.2 (near average, U.S. average is 100) Percentage of residents living in poverty in 2022: 10.6%for White Non-Hispanic residents , 17.8% for Black residents , 21.0% for Hispanic or Latino residents , 10.3% for American Indian residents , 19.7% for other race residents , 4.2% for two or more races residents )
Profiles of local businesses
Business Search - 14 Million verified businesses
Data:
Median household income ($)
Median household income (% change since 2000)
Household income diversity
Ratio of average income to average house value (%)
Ratio of average income to average rent
Median household income ($) - White
Median household income ($) - Black or African American
Median household income ($) - Asian
Median household income ($) - Hispanic or Latino
Median household income ($) - American Indian and Alaska Native
Median household income ($) - Multirace
Median household income ($) - Other Race
Median household income for houses/condos with a mortgage ($)
Median household income for apartments without a mortgage ($)
Races - White alone (%)
Races - White alone (% change since 2000)
Races - Black alone (%)
Races - Black alone (% change since 2000)
Races - American Indian alone (%)
Races - American Indian alone (% change since 2000)
Races - Asian alone (%)
Races - Asian alone (% change since 2000)
Races - Hispanic (%)
Races - Hispanic (% change since 2000)
Races - Native Hawaiian and Other Pacific Islander alone (%)
Races - Native Hawaiian and Other Pacific Islander alone (% change since 2000)
Races - Two or more races (%)
Races - Two or more races (% change since 2000)
Races - Other race alone (%)
Races - Other race alone (% change since 2000)
Racial diversity
Unemployment (%)
Unemployment (% change since 2000)
Unemployment (%) - White
Unemployment (%) - Black or African American
Unemployment (%) - Asian
Unemployment (%) - Hispanic or Latino
Unemployment (%) - American Indian and Alaska Native
Unemployment (%) - Multirace
Unemployment (%) - Other Race
Population density (people per square mile)
Population - Males (%)
Population - Females (%)
Population - Males (%) - White
Population - Males (%) - Black or African American
Population - Males (%) - Asian
Population - Males (%) - Hispanic or Latino
Population - Males (%) - American Indian and Alaska Native
Population - Males (%) - Multirace
Population - Males (%) - Other Race
Population - Females (%) - White
Population - Females (%) - Black or African American
Population - Females (%) - Asian
Population - Females (%) - Hispanic or Latino
Population - Females (%) - American Indian and Alaska Native
Population - Females (%) - Multirace
Population - Females (%) - Other Race
Coronavirus confirmed cases (Apr 26, 2024)
Deaths caused by coronavirus (Apr 26, 2024)
Coronavirus confirmed cases (per 100k population) (Apr 26, 2024)
Deaths caused by coronavirus (per 100k population) (Apr 26, 2024)
Daily increase in number of cases (Apr 26, 2024)
Weekly increase in number of cases (Apr 26, 2024)
Cases doubled (in days) (Apr 26, 2024)
Hospitalized patients (Apr 18, 2022)
Negative test results (Apr 18, 2022)
Total test results (Apr 18, 2022)
COVID Vaccine doses distributed (per 100k population) (Sep 19, 2023)
COVID Vaccine doses administered (per 100k population) (Sep 19, 2023)
COVID Vaccine doses distributed (Sep 19, 2023)
COVID Vaccine doses administered (Sep 19, 2023)
Likely homosexual households (%)
Likely homosexual households (% change since 2000)
Likely homosexual households - Lesbian couples (%)
Likely homosexual households - Lesbian couples (% change since 2000)
Likely homosexual households - Gay men (%)
Likely homosexual households - Gay men (% change since 2000)
Cost of living index
Median gross rent ($)
Median contract rent ($)
Median monthly housing costs ($)
Median house or condo value ($)
Median house or condo value ($ change since 2000)
Mean house or condo value by units in structure - 1, detached ($)
Mean house or condo value by units in structure - 1, attached ($)
Mean house or condo value by units in structure - 2 ($)
Mean house or condo value by units in structure by units in structure - 3 or 4 ($)
Mean house or condo value by units in structure - 5 or more ($)
Mean house or condo value by units in structure - Boat, RV, van, etc. ($)
Mean house or condo value by units in structure - Mobile home ($)
Median house or condo value ($) - White
Median house or condo value ($) - Black or African American
Median house or condo value ($) - Asian
Median house or condo value ($) - Hispanic or Latino
Median house or condo value ($) - American Indian and Alaska Native
Median house or condo value ($) - Multirace
Median house or condo value ($) - Other Race
Median resident age
Resident age diversity
Median resident age - Males
Median resident age - Females
Median resident age - White
Median resident age - Black or African American
Median resident age - Asian
Median resident age - Hispanic or Latino
Median resident age - American Indian and Alaska Native
Median resident age - Multirace
Median resident age - Other Race
Median resident age - Males - White
Median resident age - Males - Black or African American
Median resident age - Males - Asian
Median resident age - Males - Hispanic or Latino
Median resident age - Males - American Indian and Alaska Native
Median resident age - Males - Multirace
Median resident age - Males - Other Race
Median resident age - Females - White
Median resident age - Females - Black or African American
Median resident age - Females - Asian
Median resident age - Females - Hispanic or Latino
Median resident age - Females - American Indian and Alaska Native
Median resident age - Females - Multirace
Median resident age - Females - Other Race
Commute - mean travel time to work (minutes)
Travel time to work - Less than 5 minutes (%)
Travel time to work - Less than 5 minutes (% change since 2000)
Travel time to work - 5 to 9 minutes (%)
Travel time to work - 5 to 9 minutes (% change since 2000)
Travel time to work - 10 to 19 minutes (%)
Travel time to work - 10 to 19 minutes (% change since 2000)
Travel time to work - 20 to 29 minutes (%)
Travel time to work - 20 to 29 minutes (% change since 2000)
Travel time to work - 30 to 39 minutes (%)
Travel time to work - 30 to 39 minutes (% change since 2000)
Travel time to work - 40 to 59 minutes (%)
Travel time to work - 40 to 59 minutes (% change since 2000)
Travel time to work - 60 to 89 minutes (%)
Travel time to work - 60 to 89 minutes (% change since 2000)
Travel time to work - 90 or more minutes (%)
Travel time to work - 90 or more minutes (% change since 2000)
Marital status - Never married (%)
Marital status - Now married (%)
Marital status - Separated (%)
Marital status - Widowed (%)
Marital status - Divorced (%)
Median family income ($)
Median family income (% change since 2000)
Median non-family income ($)
Median non-family income (% change since 2000)
Median per capita income ($)
Median per capita income (% change since 2000)
Median family income ($) - White
Median family income ($) - Black or African American
Median family income ($) - Asian
Median family income ($) - Hispanic or Latino
Median family income ($) - American Indian and Alaska Native
Median family income ($) - Multirace
Median family income ($) - Other Race
Median year house/condo built
Median year apartment built
Year house built - Built 2005 or later (%)
Year house built - Built 2000 to 2004 (%)
Year house built - Built 1990 to 1999 (%)
Year house built - Built 1980 to 1989 (%)
Year house built - Built 1970 to 1979 (%)
Year house built - Built 1960 to 1969 (%)
Year house built - Built 1950 to 1959 (%)
Year house built - Built 1940 to 1949 (%)
Year house built - Built 1939 or earlier (%)
Average household size
Household density (households per square mile)
Average household size - White
Average household size - Black or African American
Average household size - Asian
Average household size - Hispanic or Latino
Average household size - American Indian and Alaska Native
Average household size - Multirace
Average household size - Other Race
Occupied housing units (%)
Vacant housing units (%)
Owner occupied housing units (%)
Renter occupied housing units (%)
Vacancy status - For rent (%)
Vacancy status - For sale only (%)
Vacancy status - Rented or sold, not occupied (%)
Vacancy status - For seasonal, recreational, or occasional use (%)
Vacancy status - For migrant workers (%)
Vacancy status - Other vacant (%)
Residents with income below the poverty level (%)
Residents with income below 50% of the poverty level (%)
Children below poverty level (%)
Poor families by family type - Married-couple family (%)
Poor families by family type - Male, no wife present (%)
Poor families by family type - Female, no husband present (%)
Poverty status for native-born residents (%)
Poverty status for foreign-born residents (%)
Poverty among high school graduates not in families (%)
Poverty among people who did not graduate high school not in families (%)
Residents with income below the poverty level (%) - White
Residents with income below the poverty level (%) - Black or African American
Residents with income below the poverty level (%) - Asian
Residents with income below the poverty level (%) - Hispanic or Latino
Residents with income below the poverty level (%) - American Indian and Alaska Native
Residents with income below the poverty level (%) - Multirace
Residents with income below the poverty level (%) - Other Race
Air pollution - Air Quality Index (AQI)
Air pollution - CO
Air pollution - NO2
Air pollution - SO2
Air pollution - Ozone
Air pollution - PM10
Air pollution - PM25
Air pollution - Pb
Crime - Murders per 100,000 population
Crime - Rapes per 100,000 population
Crime - Robberies per 100,000 population
Crime - Assaults per 100,000 population
Crime - Burglaries per 100,000 population
Crime - Thefts per 100,000 population
Crime - Auto thefts per 100,000 population
Crime - Arson per 100,000 population
Crime - City-data.com crime index
Crime - Violent crime index
Crime - Property crime index
Crime - Murders per 100,000 population (5 year average)
Crime - Rapes per 100,000 population (5 year average)
Crime - Robberies per 100,000 population (5 year average)
Crime - Assaults per 100,000 population (5 year average)
Crime - Burglaries per 100,000 population (5 year average)
Crime - Thefts per 100,000 population (5 year average)
Crime - Auto thefts per 100,000 population (5 year average)
Crime - Arson per 100,000 population (5 year average)
Crime - City-data.com crime index (5 year average)
Crime - Violent crime index (5 year average)
Crime - Property crime index (5 year average)
1996 Presidential Elections Results (%) - Democratic Party (Clinton)
1996 Presidential Elections Results (%) - Republican Party (Dole)
1996 Presidential Elections Results (%) - Other
2000 Presidential Elections Results (%) - Democratic Party (Gore)
2000 Presidential Elections Results (%) - Republican Party (Bush)
2000 Presidential Elections Results (%) - Other
2004 Presidential Elections Results (%) - Democratic Party (Kerry)
2004 Presidential Elections Results (%) - Republican Party (Bush)
2004 Presidential Elections Results (%) - Other
2008 Presidential Elections Results (%) - Democratic Party (Obama)
2008 Presidential Elections Results (%) - Republican Party (McCain)
2008 Presidential Elections Results (%) - Other
2012 Presidential Elections Results (%) - Democratic Party (Obama)
2012 Presidential Elections Results (%) - Republican Party (Romney)
2012 Presidential Elections Results (%) - Other
2016 Presidential Elections Results (%) - Democratic Party (Clinton)
2016 Presidential Elections Results (%) - Republican Party (Trump)
2016 Presidential Elections Results (%) - Other
2020 Presidential Elections Results (%) - Democratic Party (Biden)
2020 Presidential Elections Results (%) - Republican Party (Trump)
2020 Presidential Elections Results (%) - Other
Ancestries Reported - Arab (%)
Ancestries Reported - Czech (%)
Ancestries Reported - Danish (%)
Ancestries Reported - Dutch (%)
Ancestries Reported - English (%)
Ancestries Reported - French (%)
Ancestries Reported - French Canadian (%)
Ancestries Reported - German (%)
Ancestries Reported - Greek (%)
Ancestries Reported - Hungarian (%)
Ancestries Reported - Irish (%)
Ancestries Reported - Italian (%)
Ancestries Reported - Lithuanian (%)
Ancestries Reported - Norwegian (%)
Ancestries Reported - Polish (%)
Ancestries Reported - Portuguese (%)
Ancestries Reported - Russian (%)
Ancestries Reported - Scotch-Irish (%)
Ancestries Reported - Scottish (%)
Ancestries Reported - Slovak (%)
Ancestries Reported - Subsaharan African (%)
Ancestries Reported - Swedish (%)
Ancestries Reported - Swiss (%)
Ancestries Reported - Ukrainian (%)
Ancestries Reported - United States (%)
Ancestries Reported - Welsh (%)
Ancestries Reported - West Indian (%)
Ancestries Reported - Other (%)
Educational Attainment - No schooling completed (%)
Educational Attainment - Less than high school (%)
Educational Attainment - High school or equivalent (%)
Educational Attainment - Less than 1 year of college (%)
Educational Attainment - 1 or more years of college (%)
Educational Attainment - Associate degree (%)
Educational Attainment - Bachelor's degree (%)
Educational Attainment - Master's degree (%)
Educational Attainment - Professional school degree (%)
Educational Attainment - Doctorate degree (%)
School Enrollment - Nursery, preschool (%)
School Enrollment - Kindergarten (%)
School Enrollment - Grade 1 to 4 (%)
School Enrollment - Grade 5 to 8 (%)
School Enrollment - Grade 9 to 12 (%)
School Enrollment - College undergrad (%)
School Enrollment - Graduate or professional (%)
School Enrollment - Not enrolled in school (%)
School enrollment - Public schools (%)
School enrollment - Private schools (%)
School enrollment - Not enrolled (%)
Median number of rooms in houses and condos
Median number of rooms in apartments
Housing units lacking complete plumbing facilities (%)
Housing units lacking complete kitchen facilities (%)
Density of houses
Urban houses (%)
Rural houses (%)
Households with people 60 years and over (%)
Households with people 65 years and over (%)
Households with people 75 years and over (%)
Households with one or more nonrelatives (%)
Households with no nonrelatives (%)
Population in households (%)
Family households (%)
Nonfamily households (%)
Population in families (%)
Family households with own children (%)
Median number of bedrooms in owner occupied houses
Mean number of bedrooms in owner occupied houses
Median number of bedrooms in renter occupied houses
Mean number of bedrooms in renter occupied houses
Median number of vehichles in owner occupied houses
Mean number of vehichles in owner occupied houses
Median number of vehichles in renter occupied houses
Mean number of vehichles in renter occupied houses
Mortgage status - with mortgage (%)
Mortgage status - with second mortgage (%)
Mortgage status - with home equity loan (%)
Mortgage status - with both second mortgage and home equity loan (%)
Mortgage status - without a mortgage (%)
Average family size
Average family size - White
Average family size - Black or African American
Average family size - Asian
Average family size - Hispanic or Latino
Average family size - American Indian and Alaska Native
Average family size - Multirace
Average family size - Other Race
Geographical mobility - Same house 1 year ago (%)
Geographical mobility - Moved within same county (%)
Geographical mobility - Moved from different county within same state (%)
Geographical mobility - Moved from different state (%)
Geographical mobility - Moved from abroad (%)
Place of birth - Born in state of residence (%)
Place of birth - Born in other state (%)
Place of birth - Native, outside of US (%)
Place of birth - Foreign born (%)
Housing units in structures - 1, detached (%)
Housing units in structures - 1, attached (%)
Housing units in structures - 2 (%)
Housing units in structures - 3 or 4 (%)
Housing units in structures - 5 to 9 (%)
Housing units in structures - 10 to 19 (%)
Housing units in structures - 20 to 49 (%)
Housing units in structures - 50 or more (%)
Housing units in structures - Mobile home (%)
Housing units in structures - Boat, RV, van, etc. (%)
House/condo owner moved in on average (years ago)
Renter moved in on average (years ago)
Year householder moved into unit - Moved in 1999 to March 2000 (%)
Year householder moved into unit - Moved in 1995 to 1998 (%)
Year householder moved into unit - Moved in 1990 to 1994 (%)
Year householder moved into unit - Moved in 1980 to 1989 (%)
Year householder moved into unit - Moved in 1970 to 1979 (%)
Year householder moved into unit - Moved in 1969 or earlier (%)
Means of transportation to work - Drove car alone (%)
Means of transportation to work - Carpooled (%)
Means of transportation to work - Public transportation (%)
Means of transportation to work - Bus or trolley bus (%)
Means of transportation to work - Streetcar or trolley car (%)
Means of transportation to work - Subway or elevated (%)
Means of transportation to work - Railroad (%)
Means of transportation to work - Ferryboat (%)
Means of transportation to work - Taxicab (%)
Means of transportation to work - Motorcycle (%)
Means of transportation to work - Bicycle (%)
Means of transportation to work - Walked (%)
Means of transportation to work - Other means (%)
Working at home (%)
Industry diversity
Most Common Industries - Agriculture, forestry, fishing and hunting, and mining (%)
Most Common Industries - Agriculture, forestry, fishing and hunting (%)
Most Common Industries - Mining, quarrying, and oil and gas extraction (%)
Most Common Industries - Construction (%)
Most Common Industries - Manufacturing (%)
Most Common Industries - Wholesale trade (%)
Most Common Industries - Retail trade (%)
Most Common Industries - Transportation and warehousing, and utilities (%)
Most Common Industries - Transportation and warehousing (%)
Most Common Industries - Utilities (%)
Most Common Industries - Information (%)
Most Common Industries - Finance and insurance, and real estate and rental and leasing (%)
Most Common Industries - Finance and insurance (%)
Most Common Industries - Real estate and rental and leasing (%)
Most Common Industries - Professional, scientific, and management, and administrative and waste management services (%)
Most Common Industries - Professional, scientific, and technical services (%)
Most Common Industries - Management of companies and enterprises (%)
Most Common Industries - Administrative and support and waste management services (%)
Most Common Industries - Educational services, and health care and social assistance (%)
Most Common Industries - Educational services (%)
Most Common Industries - Health care and social assistance (%)
Most Common Industries - Arts, entertainment, and recreation, and accommodation and food services (%)
Most Common Industries - Arts, entertainment, and recreation (%)
Most Common Industries - Accommodation and food services (%)
Most Common Industries - Other services, except public administration (%)
Most Common Industries - Public administration (%)
Occupation diversity
Most Common Occupations - Management, business, science, and arts occupations (%)
Most Common Occupations - Management, business, and financial occupations (%)
Most Common Occupations - Management occupations (%)
Most Common Occupations - Business and financial operations occupations (%)
Most Common Occupations - Computer, engineering, and science occupations (%)
Most Common Occupations - Computer and mathematical occupations (%)
Most Common Occupations - Architecture and engineering occupations (%)
Most Common Occupations - Life, physical, and social science occupations (%)
Most Common Occupations - Education, legal, community service, arts, and media occupations (%)
Most Common Occupations - Community and social service occupations (%)
Most Common Occupations - Legal occupations (%)
Most Common Occupations - Education, training, and library occupations (%)
Most Common Occupations - Arts, design, entertainment, sports, and media occupations (%)
Most Common Occupations - Healthcare practitioners and technical occupations (%)
Most Common Occupations - Health diagnosing and treating practitioners and other technical occupations (%)
Most Common Occupations - Health technologists and technicians (%)
Most Common Occupations - Service occupations (%)
Most Common Occupations - Healthcare support occupations (%)
Most Common Occupations - Protective service occupations (%)
Most Common Occupations - Fire fighting and prevention, and other protective service workers including supervisors (%)
Most Common Occupations - Law enforcement workers including supervisors (%)
Most Common Occupations - Food preparation and serving related occupations (%)
Most Common Occupations - Building and grounds cleaning and maintenance occupations (%)
Most Common Occupations - Personal care and service occupations (%)
Most Common Occupations - Sales and office occupations (%)
Most Common Occupations - Sales and related occupations (%)
Most Common Occupations - Office and administrative support occupations (%)
Most Common Occupations - Natural resources, construction, and maintenance occupations (%)
Most Common Occupations - Farming, fishing, and forestry occupations (%)
Most Common Occupations - Construction and extraction occupations (%)
Most Common Occupations - Installation, maintenance, and repair occupations (%)
Most Common Occupations - Production, transportation, and material moving occupations (%)
Most Common Occupations - Production occupations (%)
Most Common Occupations - Transportation occupations (%)
Most Common Occupations - Material moving occupations (%)
People in Group quarters - Institutionalized population (%)
People in Group quarters - Correctional institutions (%)
People in Group quarters - Federal prisons and detention centers (%)
People in Group quarters - Halfway houses (%)
People in Group quarters - Local jails and other confinement facilities (including police lockups) (%)
People in Group quarters - Military disciplinary barracks (%)
People in Group quarters - State prisons (%)
People in Group quarters - Other types of correctional institutions (%)
People in Group quarters - Nursing homes (%)
People in Group quarters - Hospitals/wards, hospices, and schools for the handicapped (%)
People in Group quarters - Hospitals/wards and hospices for chronically ill (%)
People in Group quarters - Hospices or homes for chronically ill (%)
People in Group quarters - Military hospitals or wards for chronically ill (%)
People in Group quarters - Other hospitals or wards for chronically ill (%)
People in Group quarters - Hospitals or wards for drug/alcohol abuse (%)
People in Group quarters - Mental (Psychiatric) hospitals or wards (%)
People in Group quarters - Schools, hospitals, or wards for the mentally retarded (%)
People in Group quarters - Schools, hospitals, or wards for the physically handicapped (%)
People in Group quarters - Institutions for the deaf (%)
People in Group quarters - Institutions for the blind (%)
People in Group quarters - Orthopedic wards and institutions for the physically handicapped (%)
People in Group quarters - Wards in general hospitals for patients who have no usual home elsewhere (%)
People in Group quarters - Wards in military hospitals for patients who have no usual home elsewhere (%)
People in Group quarters - Juvenile institutions (%)
People in Group quarters - Long-term care (%)
People in Group quarters - Homes for abused, dependent, and neglected children (%)
People in Group quarters - Residential treatment centers for emotionally disturbed children (%)
People in Group quarters - Training schools for juvenile delinquents (%)
People in Group quarters - Short-term care, detention or diagnostic centers for delinquent children (%)
People in Group quarters - Type of juvenile institution unknown (%)
People in Group quarters - Noninstitutionalized population (%)
People in Group quarters - College dormitories (includes college quarters off campus) (%)
People in Group quarters - Military quarters (%)
People in Group quarters - On base (%)
People in Group quarters - Barracks, unaccompanied personnel housing (UPH), (Enlisted/Officer), ;and similar group living quarters for military personnel (%)
People in Group quarters - Transient quarters for temporary residents (%)
People in Group quarters - Military ships (%)
People in Group quarters - Group homes (%)
People in Group quarters - Homes or halfway houses for drug/alcohol abuse (%)
People in Group quarters - Homes for the mentally ill (%)
People in Group quarters - Homes for the mentally retarded (%)
People in Group quarters - Homes for the physically handicapped (%)
People in Group quarters - Other group homes (%)
People in Group quarters - Religious group quarters (%)
People in Group quarters - Dormitories (%)
People in Group quarters - Agriculture workers' dormitories on farms (%)
People in Group quarters - Job Corps and vocational training facilities (%)
People in Group quarters - Other workers' dormitories (%)
People in Group quarters - Crews of maritime vessels (%)
People in Group quarters - Other nonhousehold living situations (%)
People in Group quarters - Other noninstitutional group quarters (%)
Residents speaking English at home (%)
Residents speaking English at home - Born in the United States (%)
Residents speaking English at home - Native, born elsewhere (%)
Residents speaking English at home - Foreign born (%)
Residents speaking Spanish at home (%)
Residents speaking Spanish at home - Born in the United States (%)
Residents speaking Spanish at home - Native, born elsewhere (%)
Residents speaking Spanish at home - Foreign born (%)
Residents speaking other language at home (%)
Residents speaking other language at home - Born in the United States (%)
Residents speaking other language at home - Native, born elsewhere (%)
Residents speaking other language at home - Foreign born (%)
Class of Workers - Employee of private company (%)
Class of Workers - Self-employed in own incorporated business (%)
Class of Workers - Private not-for-profit wage and salary workers (%)
Class of Workers - Local government workers (%)
Class of Workers - State government workers (%)
Class of Workers - Federal government workers (%)
Class of Workers - Self-employed workers in own not incorporated business and Unpaid family workers (%)
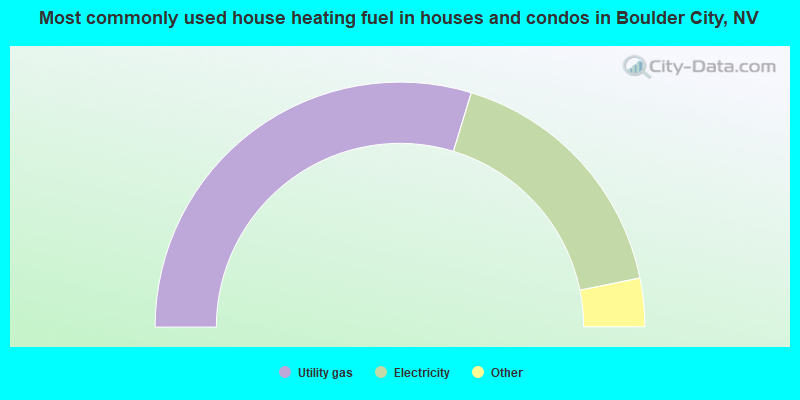
House heating fuel used in houses and condos - Utility gas (%)
House heating fuel used in houses and condos - Bottled, tank, or LP gas (%)
House heating fuel used in houses and condos - Electricity (%)
House heating fuel used in houses and condos - Fuel oil, kerosene, etc. (%)
House heating fuel used in houses and condos - Coal or coke (%)
House heating fuel used in houses and condos - Wood (%)
House heating fuel used in houses and condos - Solar energy (%)
House heating fuel used in houses and condos - Other fuel (%)
House heating fuel used in houses and condos - No fuel used (%)
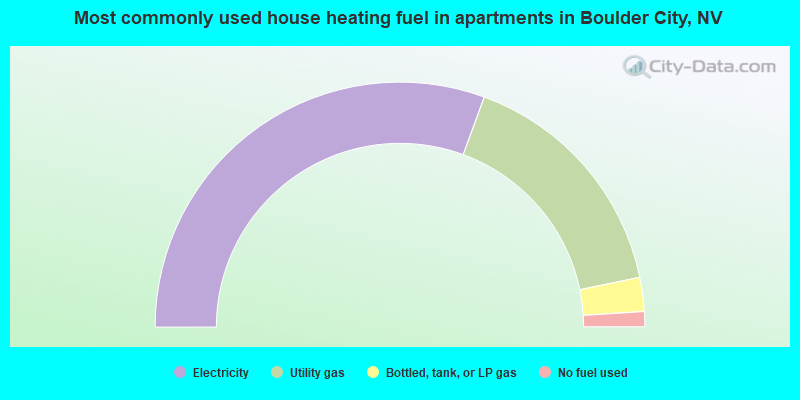
House heating fuel used in apartments - Utility gas (%)
House heating fuel used in apartments - Bottled, tank, or LP gas (%)
House heating fuel used in apartments - Electricity (%)
House heating fuel used in apartments - Fuel oil, kerosene, etc. (%)
House heating fuel used in apartments - Coal or coke (%)
House heating fuel used in apartments - Wood (%)
House heating fuel used in apartments - Solar energy (%)
House heating fuel used in apartments - Other fuel (%)
House heating fuel used in apartments - No fuel used (%)
Armed forces status - In Armed Forces (%)
Armed forces status - Civilian (%)
Armed forces status - Civilian - Veteran (%)
Armed forces status - Civilian - Nonveteran (%)
Fatal accidents locations in years 2005-2021
Fatal accidents locations in 2005
Fatal accidents locations in 2006
Fatal accidents locations in 2007
Fatal accidents locations in 2008
Fatal accidents locations in 2009
Fatal accidents locations in 2010
Fatal accidents locations in 2011
Fatal accidents locations in 2012
Fatal accidents locations in 2013
Fatal accidents locations in 2014
Fatal accidents locations in 2015
Fatal accidents locations in 2016
Fatal accidents locations in 2017
Fatal accidents locations in 2018
Fatal accidents locations in 2019
Fatal accidents locations in 2020
Fatal accidents locations in 2021
Alcohol use - People drinking some alcohol every month (%)
Alcohol use - People not drinking at all (%)
Alcohol use - Average days/month drinking alcohol
Alcohol use - Average drinks/week
Alcohol use - Average days/year people drink much
Audiometry - Average condition of hearing (%)
Audiometry - People that can hear a whisper from across a quiet room (%)
Audiometry - People that can hear normal voice from across a quiet room (%)
Audiometry - Ears ringing, roaring, buzzing (%)
Audiometry - Had a job exposure to loud noise (%)
Audiometry - Had off-work exposure to loud noise (%)
Blood Pressure & Cholesterol - Has high blood pressure (%)
Blood Pressure & Cholesterol - Checking blood pressure at home (%)
Blood Pressure & Cholesterol - Frequently checking blood cholesterol (%)
Blood Pressure & Cholesterol - Has high cholesterol level (%)
Consumer Behavior - Money monthly spent on food at supermarket/grocery store
Consumer Behavior - Money monthly spent on food at other stores
Consumer Behavior - Money monthly spent on eating out
Consumer Behavior - Money monthly spent on carryout/delivered foods
Consumer Behavior - Income spent on food at supermarket/grocery store (%)
Consumer Behavior - Income spent on food at other stores (%)
Consumer Behavior - Income spent on eating out (%)
Consumer Behavior - Income spent on carryout/delivered foods (%)
Current Health Status - General health condition (%)
Current Health Status - Blood donors (%)
Current Health Status - Has blood ever tested for HIV virus (%)
Current Health Status - Left-handed people (%)
Dermatology - People using sunscreen (%)
Diabetes - Diabetics (%)
Diabetes - Had a blood test for high blood sugar (%)
Diabetes - People taking insulin (%)
Diet Behavior & Nutrition - Diet health (%)
Diet Behavior & Nutrition - Milk product consumption (# of products/month)
Diet Behavior & Nutrition - Meals not home prepared (#/week)
Diet Behavior & Nutrition - Meals from fast food or pizza place (#/week)
Diet Behavior & Nutrition - Ready-to-eat foods (#/month)
Diet Behavior & Nutrition - Frozen meals/pizza (#/month)
Drug Use - People that ever used marijuana or hashish (%)
Drug Use - Ever used hard drugs (%)
Drug Use - Ever used any form of cocaine (%)
Drug Use - Ever used heroin (%)
Drug Use - Ever used methamphetamine (%)
Health Insurance - People covered by health insurance (%)
Kidney Conditions-Urology - Avg. # of times urinating at night
Medical Conditions - People with asthma (%)
Medical Conditions - People with anemia (%)
Medical Conditions - People with psoriasis (%)
Medical Conditions - People with overweight (%)
Medical Conditions - Elderly people having difficulties in thinking or remembering (%)
Medical Conditions - People who ever received blood transfusion (%)
Medical Conditions - People having trouble seeing even with glass/contacts (%)
Medical Conditions - People with arthritis (%)
Medical Conditions - People with gout (%)
Medical Conditions - People with congestive heart failure (%)
Medical Conditions - People with coronary heart disease (%)
Medical Conditions - People with angina pectoris (%)
Medical Conditions - People who ever had heart attack (%)
Medical Conditions - People who ever had stroke (%)
Medical Conditions - People with emphysema (%)
Medical Conditions - People with thyroid problem (%)
Medical Conditions - People with chronic bronchitis (%)
Medical Conditions - People with any liver condition (%)
Medical Conditions - People who ever had cancer or malignancy (%)
Mental Health - People who have little interest in doing things (%)
Mental Health - People feeling down, depressed, or hopeless (%)
Mental Health - People who have trouble sleeping or sleeping too much (%)
Mental Health - People feeling tired or having little energy (%)
Mental Health - People with poor appetite or overeating (%)
Mental Health - People feeling bad about themself (%)
Mental Health - People who have trouble concentrating on things (%)
Mental Health - People moving or speaking slowly or too fast (%)
Mental Health - People having thoughts they would be better off dead (%)
Oral Health - Average years since last visit a dentist
Oral Health - People embarrassed because of mouth (%)
Oral Health - People with gum disease (%)
Oral Health - General health of teeth and gums (%)
Oral Health - Average days a week using dental floss/device
Oral Health - Average days a week using mouthwash for dental problem
Oral Health - Average number of teeth
Pesticide Use - Households using pesticides to control insects (%)
Pesticide Use - Households using pesticides to kill weeds (%)
Physical Activity - People doing vigorous-intensity work activities (%)
Physical Activity - People doing moderate-intensity work activities (%)
Physical Activity - People walking or bicycling (%)
Physical Activity - People doing vigorous-intensity recreational activities (%)
Physical Activity - People doing moderate-intensity recreational activities (%)
Physical Activity - Average hours a day doing sedentary activities
Physical Activity - Average hours a day watching TV or videos
Physical Activity - Average hours a day using computer
Physical Functioning - People having limitations keeping them from working (%)
Physical Functioning - People limited in amount of work they can do (%)
Physical Functioning - People that need special equipment to walk (%)
Physical Functioning - People experiencing confusion/memory problems (%)
Physical Functioning - People requiring special healthcare equipment (%)
Prescription Medications - Average number of prescription medicines taking
Preventive Aspirin Use - Adults 40+ taking low-dose aspirin (%)
Reproductive Health - Vaginal deliveries (%)
Reproductive Health - Cesarean deliveries (%)
Reproductive Health - Deliveries resulted in a live birth (%)
Reproductive Health - Pregnancies resulted in a delivery (%)
Reproductive Health - Women breastfeeding newborns (%)
Reproductive Health - Women that had a hysterectomy (%)
Reproductive Health - Women that had both ovaries removed (%)
Reproductive Health - Women that have ever taken birth control pills (%)
Reproductive Health - Women taking birth control pills (%)
Reproductive Health - Women that have ever used Depo-Provera or injectables (%)
Reproductive Health - Women that have ever used female hormones (%)
Sexual Behavior - People 18+ that ever had sex (vaginal, anal, or oral) (%)
Sexual Behavior - Males 18+ that ever had vaginal sex with a woman (%)
Sexual Behavior - Males 18+ that ever performed oral sex on a woman (%)
Sexual Behavior - Males 18+ that ever had anal sex with a woman (%)
Sexual Behavior - Males 18+ that ever had any sex with a man (%)
Sexual Behavior - Females 18+ that ever had vaginal sex with a man (%)
Sexual Behavior - Females 18+ that ever performed oral sex on a man (%)
Sexual Behavior - Females 18+ that ever had anal sex with a man (%)
Sexual Behavior - Females 18+ that ever had any kind of sex with a woman (%)
Sexual Behavior - Average age people first had sex
Sexual Behavior - Average number of female sex partners in lifetime (males 18+)
Sexual Behavior - Average number of female vaginal sex partners in lifetime (males 18+)
Sexual Behavior - Average age people first performed oral sex on a woman (18+)
Sexual Behavior - Average number of woman performed oral sex on in lifetime (18+)
Sexual Behavior - Average number of male sex partners in lifetime (males 18+)
Sexual Behavior - Average number of male anal sex partners in lifetime (males 18+)
Sexual Behavior - Average age people first performed oral sex on a man (18+)
Sexual Behavior - Average number of male oral sex partners in lifetime (18+)
Sexual Behavior - People using protection when performing oral sex (%)
Sexual Behavior - Average number of times people have vaginal or anal sex a year
Sexual Behavior - People having sex without condom (%)
Sexual Behavior - Average number of male sex partners in lifetime (females 18+)
Sexual Behavior - Average number of male vaginal sex partners in lifetime (females 18+)
Sexual Behavior - Average number of female sex partners in lifetime (females 18+)
Sexual Behavior - Circumcised males 18+ (%)
Sleep Disorders - Average hours sleeping at night
Sleep Disorders - People that has trouble sleeping (%)
Smoking-Cigarette Use - People smoking cigarettes (%)
Taste & Smell - People 40+ having problems with smell (%)
Taste & Smell - People 40+ having problems with taste (%)
Taste & Smell - People 40+ that ever had wisdom teeth removed (%)
Taste & Smell - People 40+ that ever had tonsils teeth removed (%)
Taste & Smell - People 40+ that ever had a loss of consciousness because of a head injury (%)
Taste & Smell - People 40+ that ever had a broken nose or other serious injury to face or skull (%)
Taste & Smell - People 40+ that ever had two or more sinus infections (%)
Weight - Average height (inches)
Weight - Average weight (pounds)
Weight - Average BMI
Weight - People that are obese (%)
Weight - People that ever were obese (%)
Weight - People trying to lose weight (%)
According to our research of Nevada and other state lists, there were 43 registered sex offenders living in Boulder City, Nevada as of April 26, 2024 . The ratio of all residents to sex offenders in Boulder City is 372 to 1.The ratio of registered sex offenders to all residents in this city is near the state average.
Officers per 1,000 residents here:
2.23Nevada average:
2.61
Latest news from Boulder City, NV collected exclusively by city-data.com from local newspapers, TV, and radio stations
Ancestries: English (15.4%), German (14.3%), Italian (9.1%), Irish (6.1%), Polish (3.5%), European (2.7%).
Current Local Time:
Incorporated on 01/04/1960
Land area: 202.6 square miles.
Population density: 73 people per square mile (very low).
651 residents are foreign born (1.6% Europe , 1.3% Latin America , 1.3% Asia ).
This city:
4.3%Nevada:
19.1%
Median real estate property taxes paid for housing units with mortgages in 2022: $1,657 (0.3%)Median real estate property taxes paid for housing units with no mortgage in 2022: $1,477 (0.4%)
Nearest city with pop. 50,000+: Henderson, NV
Nearest city with pop. 200,000+: Las Vegas, NV
Nearest city with pop. 1,000,000+: Phoenix, AZ
Nearest cities:
Nelson, NV (4.1 miles),
Latitude: 35.94 N, Longitude: 114.89 W
Daytime population change due to commuting: -111 (-0.7%)Workers who live and work in this city: 2,710 (45.7%)
Area code commonly used in this area: 702
Boulder City tourist attractions:
Cascata Golf Course, Boulder City, Nevada ? a Rees Jones-Designed Golf Course That's Been Rated the #1 Facility in the Country Fortification Hill - Boulder City, Nevada - Extinct Volcano Overlooking Lake Mead Gold Strike Canyon Hot Springs - Boulder City, Nevada - Natural Hot Pools near Colorado River Lake Mead National Recreation Area Offers Vacation Fun Nevada Way - Boulder City, Nevada - Main Thoroughfare in a Quiet Town Red and Black Mountain Trail St. Jude's Children's Art Museum - Boulder City, Nevada - Art By, For and About Children Wilbur Square Park - Boulder City, Nevada - Historic Venue for Art Fairs and More Skydive Las Vegas - Boulder City, Nevada - Skydiving with Views of Lake Mead, Hoover Dam, and the Colorado River Single-family new house construction building permits:
2022: 20 buildings , average cost: $449,5002021: 40 buildings , average cost: $347,2002020: 34 buildings , average cost: $363,6002019: 33 buildings , average cost: $334,3002018: 74 buildings , average cost: $234,3002017: 21 buildings , average cost: $220,6002016: 3 buildings , average cost: $320,8002015: 22 buildings , average cost: $317,1002014: 15 buildings , average cost: $282,8002013: 10 buildings , average cost: $340,1002012: 9 buildings , average cost: $355,7002011: 3 buildings , average cost: $353,1002010: 11 buildings , average cost: $336,9002009: 7 buildings , average cost: $292,9002008: 9 buildings , average cost: $302,8002007: 19 buildings , average cost: $233,2002006: 13 buildings , average cost: $442,2002005: 25 buildings , average cost: $363,1002004: 45 buildings , average cost: $278,9002003: 52 buildings , average cost: $302,9002002: 46 buildings , average cost: $256,9002001: 69 buildings , average cost: $239,8002000: 52 buildings , average cost: $244,4001999: 44 buildings , average cost: $276,0001998: 60 buildings , average cost: $258,3001997: 89 buildings , average cost: $199,000Unemployment in December 2023: Population change in the 1990s: +1,235 (+9.0%).
Most common industries in Boulder City, NV (%)
Both Males Females
Construction (13.2%)
Arts, entertainment, recreation (10.8%)
Accommodation & food services (8.9%)
Public administration (8.4%)
Health care (6.9%)
Professional, scientific, technical services (5.7%)
Educational services (5.5%)
Construction (21.8%)
Arts, entertainment, recreation (11.4%)
Public administration (9.4%)
Accommodation & food services (7.3%)
Professional, scientific, technical services (5.8%)
Repair & maintenance (3.9%)
Administrative & support & waste management services (3.7%)
Health care (12.6%)
Accommodation & food services (10.9%)
Educational services (10.6%)
Arts, entertainment, recreation (10.1%)
Public administration (7.2%)
Professional, scientific, technical services (5.5%)
Personal & laundry services (4.2%)
Most common occupations in Boulder City, NV (%)
Both Males Females
Other management occupations, except farmers and farm managers (4.5%)
Other sales and related occupations, including supervisors (4.2%)
Information and record clerks, except customer service representatives (3.6%)
Building and grounds cleaning and maintenance occupations (3.5%)
Cashiers (3.1%)
Supervisors and other personal care and service workers, except child care workers (3.0%)
Preschool, kindergarten, elementary, and middle school teachers (2.7%)
Other management occupations, except farmers and farm managers (4.9%)
Electrical equipment mechanics and other installation, maintenance, and repair workers, including supervisors (4.6%)
Building and grounds cleaning and maintenance occupations (4.2%)
Vehicle and mobile equipment mechanics, installers, and repairers (3.8%)
Driver/sales workers and truck drivers (3.6%)
Electricians (3.5%)
Other sales and related occupations, including supervisors (3.4%)
Cashiers (6.4%)
Preschool, kindergarten, elementary, and middle school teachers (5.9%)
Information and record clerks, except customer service representatives (5.8%)
Secretaries and administrative assistants (5.4%)
Other sales and related occupations, including supervisors (5.1%)
Registered nurses (4.5%)
Other office and administrative support workers, including supervisors (4.4%)
Earthquake activity:
Boulder City-area historical earthquake activity is significantly above Nevada state average. It is 5660% greater than the overall U.S. average. On 6/28/1992 at 11:57:34, a magnitude 7.6 (6.2 MB, 7.6 MS, 7.3 MW, Depth: 0.7 mi, Class: Major, Intensity: VIII - XII) earthquake occurred 153.1 miles away from the city center, causing 3 deaths ( 1 shaking deaths, 2 other deaths) and 400 injuries, causing $100,000,000 total damage and $40,000,000 insured lossesOn 10/16/1999 at 09:46:44, a magnitude 7.4 (6.3 MB, 7.4 MS, 7.2 MW, 7.3 ML) earthquake occurred 131.8 miles away from Boulder City center On 7/21/1952 at 11:52:14, a magnitude 7.7 (7.7 UK) earthquake occurred 240.7 miles away from the city center, causing $50,000,000 total damage On 5/19/1940 at 04:36:40, a magnitude 7.2 (7.2 UK) earthquake occurred 193.6 miles away from the city center, causing $33,000,000 total damage On 6/28/1992 at 15:05:30, a magnitude 6.9 (6.3 MB, 6.7 MS, 6.5 MW, 6.9 ME, Depth: 3.1 mi, Class: Strong, Intensity: VII - IX) earthquake occurred 158.1 miles away from Boulder City center On 12/21/1932 at 06:10:09, a magnitude 7.2 (7.2 UK) earthquake occurred 250.2 miles away from the city center Magnitude types: body-wave magnitude (MB), energy magnitude (ME), local magnitude (ML), surface-wave magnitude (MS), moment magnitude (MW) Natural disasters: The number of natural disasters in Clark County (12) is smaller than the US average (15).Major Disasters (Presidential) Declared: 4Emergencies Declared: 3Fires: 4, Floods: 3, Heavy Rains: 2, Snows: 2, Storms: 2, Flash Flood: 1, Hurricane: 1, Other: 1 (Note: some incidents may be assigned to more than one category). Hospitals and medical centers in Boulder City: BOULDER CITY HOSPITAL (Voluntary non-profit - Private, provides emergency services, 901 ADAMS BLVD) BOULDER CITY HOSP HOME HEALTH (901 ADAMS BLVD)
BOULDER CITY HOSPITAL SNF (901 ADAMS BLVD.)
MOUNTAINVIEW CARE CENTER (601 ADAMS BOULEVARD)
NEVADA STATE VETERANS HOME - BOULDER CITY (100 VETERANS MEMORIAL DR)
Colleges/universities with over 2000 students nearest to Boulder City:
Nevada State College (about 5 miles; Henderson, NV ; Full-time enrollment: 2,346)
University of Nevada-Las Vegas (about 19 miles; Las Vegas, NV ; FT enrollment: 21,153)
College of Southern Nevada (about 25 miles; Las Vegas, NV ; FT enrollment: 18,996)
Mohave Community College (about 67 miles; Kingman, AZ ; FT enrollment: 3,309)
Dixie State University (about 109 miles; Saint George, UT ; FT enrollment: 6,485)
Barstow Community College (about 142 miles; Barstow, CA ; FT enrollment: 2,120)
Southern Utah University (about 157 miles; Cedar City, UT ; FT enrollment: 6,522)
Public high school in Boulder City:
Public elementary/middle schools in Boulder City:
Private elementary/middle school in Boulder City: GRACE CHRISTIAN ACADEMY Students: 41, Location: 1150 WYOMING ST, Grades: KG-6)
See full list of schools located in Boulder City Library in Boulder City: BOULDER CITY LIBRARY DISTRICT Operating income: $1,509,323; Location: 701 ADAMS BOULEVARD; 99,909 books ; 6,624 audio materials ; 1,848 video materials ; 30 state licensed databases ; 265 print serial subscriptions )
User-submitted facts and corrections:
christian center school is no longer in existence
Notable locations in Boulder City: (A) , Pumping Plant Number 5 (B) , Boulder City Police Station (C) , Boulder City Fire Department (D) , Boulder City City Hall (E) , Mercy Air Services 11 (F) . Display/hide their locations on the map
Reservoirs: (A) , Dry Lake Reservoir (B) , C C C Reservoir (C) . Display/hide their locations on the map
Streams, rivers, and creeks: (A) . Display/hide its location on the map
Tourist attractions: (1) , Heliqwest (Ski & Helicopter Tours; 1100 Airport Road) (2) , National Park Service (Recreation Areas; 502 Lakeshore Road) (3) , Information Centers (100 Nevada Highway) (4) , Black Canyon River Adventures (Tours & Charters; Highway 93) (5) , Leading Edge Rotor Craft (Tours & Charters; 1201 Airport Road) (6) . Display/hide their approximate locations on the map
Hotels: (1) , Starview Motel of Boulder City (1017 Nevada Highway) (2) , Best Western Lighthouse Inn (110 Ville Drive) (3) , Nevada Inn (1009 Nevada Hwy) (4) , Sands Motel of Boulder City (809 Nevada Highway) (5) , Boulder City Super 8 Motel (704 Nevada Hwy) (6) , Western Inn (921 Nevada Highway) (7) , Desert Inn of Boulder City (800 Nevada Highway) (8) , Hacienda Hotel & Casino (US 93 Highway) (9) . Display/hide their approximate locations on the map
Birthplace of: Deanna Brooks - Film actor, G. Murray Snow - Federal judge, Kathy Evison - Actress.
Clark County has a predicted average indoor radon screening level less than 2 pCi/L (pico curies per liter) - Low Potential Drinking water stations with addresses in Boulder City and their reported violations in the past:
BOULDER CITY (Population served: 15,000, Purch surface water):
Past monitoring violations:
Initial Tap Sampling for Pb and Cu - In JAN-01-1993, Contaminant: Lead and Copper Rule. Follow-up actions: St Compliance achieved (FEB-09-2005)
Address: HOOVER BUREAU OF RECLAMATION LCD 2300 Population served: 3,000, Surface water):
Past health violations:
MCL, Average - Between APR-2009 and JUN-2009, Contaminant: TTHM. Follow-up actions: St Violation/Reminder Notice (MAY-09-2008), St Public Notif requested (MAY-19-2008), St Public Notif received (JUL-13-2009), St Compliance achieved (AUG-27-2009)
MCL, Average - Between JAN-2009 and MAR-2009, Contaminant: TTHM. Follow-up actions: St Violation/Reminder Notice (MAY-09-2008), St Public Notif requested (MAY-19-2008), St Public Notif received (APR-27-2009), St Compliance achieved (AUG-27-2009)
MCL, Average - Between JUL-2008 and SEP-2008, Contaminant: TTHM. Follow-up actions: St Violation/Reminder Notice (MAY-09-2008), St Public Notif requested (MAY-19-2008), St Public Notif received (OCT-27-2008), St Compliance achieved (AUG-27-2009)
MCL, Average - Between APR-2008 and JUN-2008, Contaminant: TTHM. Follow-up actions: St Violation/Reminder Notice (MAY-09-2008), St Public Notif requested (MAY-19-2008), St Compliance achieved (AUG-27-2009)
MCL, Average - Between JAN-2008 and MAR-2008, Contaminant: TTHM. Follow-up actions: St Public Notif received (APR-09-2008), St Violation/Reminder Notice (MAY-09-2008), St Public Notif requested (MAY-19-2008), St Compliance achieved (AUG-27-2009)
MCL, Average - Between OCT-2006 and DEC-2006, Contaminant: TTHM. Follow-up actions: St Public Notif requested (JAN-13-2007), St Violation/Reminder Notice (JAN-13-2007), St Public Notif received (JAN-19-2007), St Compliance achieved (JUL-25-2007)
Population served: 1,354, Groundwater):
Past monitoring violations:
5 regular monitoring violations
Population served: 722, Purch surface water):
Past health violations:
MCL, Average - Between JUL-2010 and SEP-2010, Contaminant: TTHM. Follow-up actions: St Public Notif requested (NOV-13-2008), St Violation/Reminder Notice (NOV-13-2008), St Public Notif received (OCT-06-2010), St Compliance achieved (DEC-10-2010)
MCL, Average - Between APR-2010 and JUN-2010, Contaminant: TTHM. Follow-up actions: St Public Notif requested (NOV-13-2008), St Violation/Reminder Notice (NOV-13-2008), St Public Notif received (MAY-28-2010), St Compliance achieved (DEC-10-2010)
MCL, Average - Between JAN-2010 and MAR-2010, Contaminant: TTHM. Follow-up actions: St Public Notif requested (NOV-13-2008), St Violation/Reminder Notice (NOV-13-2008), St Public Notif received (APR-28-2010), St Compliance achieved (DEC-10-2010)
MCL, Average - Between OCT-2009 and DEC-2009, Contaminant: TTHM. Follow-up actions: St Public Notif requested (NOV-13-2008), St Violation/Reminder Notice (NOV-13-2008), St Public Notif received (DEC-11-2009), St Compliance achieved (DEC-10-2010)
MCL, Average - Between JUL-2009 and SEP-2009, Contaminant: TTHM. Follow-up actions: St Public Notif requested (NOV-13-2008), St Violation/Reminder Notice (NOV-13-2008), St Public Notif received (SEP-18-2009), St Compliance achieved (DEC-10-2010)
MCL, Average - Between APR-2009 and JUN-2009, Contaminant: TTHM. Follow-up actions: St Public Notif requested (NOV-13-2008), St Violation/Reminder Notice (NOV-13-2008), St Public Notif received (JUL-27-2009), St Compliance achieved (DEC-10-2010)
3 other older health violations
Past monitoring violations:
Monitoring and Reporting (DBP) - Between APR-2006 and JUN-2006, Contaminant: Total Haloacetic Acids (HAA5). Follow-up actions: St Public Notif requested (DEC-21-2006), St Violation/Reminder Notice (DEC-21-2006), St Compliance achieved (MAR-30-2007)
Monitoring and Reporting (DBP) - Between APR-2006 and JUN-2006, Contaminant: TTHM. Follow-up actions: St Public Notif requested (DEC-21-2006), St Violation/Reminder Notice (DEC-21-2006), St Compliance achieved (MAR-30-2007)
Monitoring and Reporting (DBP) - Between JAN-2005 and MAR-2005, Contaminant: Total Haloacetic Acids (HAA5). Follow-up actions: St Public Notif requested (MAY-27-2005), St Violation/Reminder Notice (JUN-08-2005), St Compliance achieved (JUN-27-2005), St Public Notif received (JUN-27-2005), St Compliance achieved (SEP-16-2008)
Monitoring and Reporting (DBP) - Between JAN-2005 and MAR-2005, Contaminant: TTHM. Follow-up actions: St Public Notif requested (MAY-27-2005), St Violation/Reminder Notice (JUN-08-2005), St Compliance achieved (JUN-27-2005), St Public Notif received (JUN-27-2005), St Compliance achieved (SEP-16-2008)
Population served: 250, Surface water):
Past health violations:
MCL, Average - Between JAN-2010 and MAR-2010, Contaminant: TTHM. Follow-up actions: St Public Notif requested (NOV-13-2008), St Violation/Reminder Notice (NOV-13-2008), St Public Notif received (APR-28-2010), St Compliance achieved (JUN-21-2010)
MCL, Average - Between OCT-2009 and DEC-2009, Contaminant: TTHM. Follow-up actions: St Public Notif requested (NOV-13-2008), St Violation/Reminder Notice (NOV-13-2008), St Public Notif received (DEC-11-2009), St Compliance achieved (JUN-21-2010)
MCL, Average - Between JUL-2009 and SEP-2009, Contaminant: TTHM. Follow-up actions: St Public Notif requested (NOV-13-2008), St Violation/Reminder Notice (NOV-13-2008), St Public Notif received (SEP-06-2009), St Compliance achieved (JUN-21-2010)
MCL, Average - Between APR-2009 and JUN-2009, Contaminant: TTHM. Follow-up actions: St Public Notif requested (NOV-13-2008), St Violation/Reminder Notice (NOV-13-2008), St Public Notif received (JUL-27-2009), St Compliance achieved (JUN-21-2010)
MCL, Average - Between JAN-2009 and MAR-2009, Contaminant: TTHM. Follow-up actions: St Public Notif requested (NOV-13-2008), St Violation/Reminder Notice (NOV-13-2008), St Public Notif received (MAY-14-2009), St Compliance achieved (JUN-21-2010)
MCL, Average - Between OCT-2008 and DEC-2008, Contaminant: TTHM. Follow-up actions: St Public Notif requested (FEB-03-2009), St Violation/Reminder Notice (FEB-03-2009), St Public Notif received (FEB-09-2009), St Compliance achieved (JUN-21-2010)
7 other older health violations
Past monitoring violations:
Monitoring of Treatment (SWTR-Filter) - In APR-2005. Follow-up actions: St Violation/Reminder Notice (MAY-11-2005), St Public Notif requested (MAY-11-2005), St Public Notif received (MAY-18-2005), St Site Visit (enforcement) (MAY-25-2005), St Compliance achieved (NOV-01-2010)
One regular monitoring violation
Population served: 51, Surface water):
Past health violations:
MCL, Average - Between APR-2012 and JUN-2012, Contaminant: TTHM. Follow-up actions: St Public Notif requested (MAY-08-2009), St Violation/Reminder Notice (MAY-08-2009), St Public Notif received (MAY-31-2012), St Compliance achieved (SEP-19-2012)
MCL, Average - Between JAN-2012 and MAR-2012, Contaminant: TTHM. Follow-up actions: St Public Notif requested (MAY-08-2009), St Violation/Reminder Notice (MAY-08-2009), St Public Notif received (MAR-30-2012), St Compliance achieved (SEP-19-2012)
MCL, Average - Between OCT-2011 and DEC-2011, Contaminant: TTHM. Follow-up actions: St Public Notif requested (MAY-08-2009), St Violation/Reminder Notice (MAY-08-2009), St Public Notif received (JAN-30-2012), St Compliance achieved (SEP-19-2012)
MCL, Average - Between JUL-2011 and SEP-2011, Contaminant: TTHM. Follow-up actions: St Public Notif requested (MAY-08-2009), St Violation/Reminder Notice (MAY-08-2009), St Public Notif received (SEP-06-2011), St Compliance achieved (SEP-19-2012)
MCL, Average - Between APR-2011 and JUN-2011, Contaminant: TTHM. Follow-up actions: St Public Notif requested (MAY-08-2009), St Violation/Reminder Notice (MAY-08-2009), St Public Notif received (MAY-23-2011), St Compliance achieved (SEP-19-2012)
MCL, Average - Between JAN-2011 and MAR-2011, Contaminant: TTHM. Follow-up actions: St Public Notif requested (MAY-08-2009), St Violation/Reminder Notice (MAY-08-2009), St Public Notif received (MAR-02-2011), St Compliance achieved (SEP-19-2012)
8 other older health violations
Past monitoring violations:
Monitoring of Treatment (SWTR-Filter) - In APR-2008. Follow-up actions: St Compliance achieved (APR-11-2008), St Public Notif requested (JUL-17-2008), St Violation/Reminder Notice (JUL-17-2008)
One regular monitoring violation
Drinking water stations with addresses in Boulder City that have no violations reported:
NPS LAS VEGAS BAY (Population served: 25, Primary Water Source Type: Purch surface water)
Average household size: This city:
2.3 peopleNevada:
2.6 people
Percentage of family households: This city:
62.4%Whole state:
65.3%
Percentage of households with unmarried partners: This city:
6.5%Whole state:
8.7%
Likely homosexual households (counted as self-reported same-sex unmarried-partner households)
Lesbian couples: 0.2% of all households Gay men: 0.1% of all households
People in group quarters in Boulder City in 2010:
280 people in nursing facilities/skilled-nursing facilities
54 people in workers' group living quarters and job corps centers
2 people in other noninstitutional facilities
People in group quarters in Boulder City in 2000:
115 people in nursing homes
70 people in other noninstitutional group quarters
61 people in other group homes
4 people in religious group quarters
Banks with branches in Boulder City (2011 data):
U.S. Bank National Association: Boulder City Vons Branch at 1031 Nevada Highway, branch established on 2009/08/10. Info updated 2012/01/30: Bank assets: $330,470.8 mil, Deposits: $236,091.5 mil, headquarters in Cincinnati, OH, positive income , 3121 total offices , Holding Company: U.S. Bancorp
Bank of America, National Association: Boulder City Branch at 900 Nevada Highway, branch established on 1968/08/23. Info updated 2009/11/18: Bank assets: $1,451,969.3 mil, Deposits: $1,077,176.8 mil, headquarters in Charlotte, NC, positive income , 5782 total offices , Holding Company: Bank Of America Corporation
Wells Fargo Bank, National Association: Boulder City Branch at 412 Nevada Highway, branch established on 1943/09/21. Info updated 2011/04/05: Bank assets: $1,161,490.0 mil, Deposits: $905,653.0 mil, headquarters in Sioux Falls, SD, positive income , 6395 total offices , Holding Company: Wells Fargo & Company
Nevada State Bank: Boulder City Branch at 1000 Nevada Highway, branch established on 2000/01/19. Info updated 2009/04/21: Bank assets: $4,101.1 mil, Deposits: $3,546.3 mil, headquarters in Las Vegas, NV, positive income , Commercial Lending Specialization, 53 total offices , Holding Company: Zions Bancorporation
For population 15 years and over in Boulder City:
Never married: 24.3%Now married: 54.8%Separated: 0.8%Widowed: 6.5%Divorced: 13.6% For population 25 years and over in Boulder City:
High school or higher: 95.8%Bachelor's degree or higher: 31.9%Graduate or professional degree: 12.2%Unemployed: 5.8%Mean travel time to work (commute): 19.4 minutes
Education Gini index (Inequality in education) Here:
9.7Nevada average:
12.5
Religion statistics for Boulder City, NV (based on Clark County data)
Religion Adherents Congregations Catholic 354,110 32 Evangelical Protestant 150,709 349 Other 149,167 300 Mainline Protestant 27,072 72 Black Protestant 8,550 42 Orthodox 8,191 11 None 1,253,470 -
Source: Clifford Grammich, Kirk Hadaway, Richard Houseal, Dale E.Jones, Alexei Krindatch, Richie Stanley and Richard H.Taylor. 2012. 2010 U.S.Religion Census: Religious Congregations & Membership Study. Association of Statisticians of American Religious Bodies. Jones, Dale E., et al. 2002. Congregations and Membership in the United States 2000. Nashville, TN: Glenmary Research Center. Graphs represent county-level data
Food Environment Statistics: Number of grocery stores : 258Clark County :
1.41 / 10,000 pop.Nevada :
1.50 / 10,000 pop.
Number of supercenters and club stores : 15This county :
0.08 / 10,000 pop.State :
0.10 / 10,000 pop.
Number of convenience stores (no gas) : 176Clark County :
0.96 / 10,000 pop.Nevada :
1.00 / 10,000 pop.
Number of convenience stores (with gas) : 403Clark County :
2.21 / 10,000 pop.State :
2.56 / 10,000 pop.
Number of full-service restaurants : 1,038Here :
5.68 / 10,000 pop.State :
6.14 / 10,000 pop.
Adult diabetes rate : This county :
8.7%Nevada :
8.2%
Adult obesity rate : Clark County :
24.8%Nevada :
24.5%
Low-income preschool obesity rate : This county :
13.2%State :
13.2%
Health and Nutrition: Healthy diet rate : This city:
51.7%Nevada:
48.6%
Average overall health of teeth and gums : This city:
48.0%Nevada:
45.9%
Average BMI : This city:
28.7Nevada:
28.6
People feeling badly about themselves : Boulder City:
21.3%State:
21.3%
People not drinking alcohol at all : This city:
10.0%State:
10.7%
Average hours sleeping at night : Overweight people : Boulder City:
36.5%State:
33.1%
General health condition : Boulder City:
55.5%Nevada:
55.6%
Average condition of hearing : More about Health and Nutrition of Boulder City, NV Residents
Boulder City government finances - Expenditure in 2021 (per resident):
Current Operations - Police Protection: $9,169,000 ($615.78)
Water Utilities: $8,753,000 ($587.84)Electric Utilities: $8,541,000 ($573.61)Regular Highways: $6,897,000 ($463.20)Local Fire Protection: $5,238,000 ($351.78)Central Staff Services: $3,913,000 ($262.79)Parks and Recreation: $3,626,000 ($243.52)General - Other: $3,124,000 ($209.81)Housing and Community Development: $2,263,000 ($151.98)Judicial and Legal Services: $1,085,000 ($72.87)Sewerage: $944,000 ($63.40)Solid Waste Management: $939,000 ($63.06)Air Transportation: $880,000 ($59.10)Financial Administration: $771,000 ($51.78)Miscellaneous Commercial Activities - Other: $92,000 ($6.18)General - Interest on Debt: $4,000 ($0.27)
Other Capital Outlay - Electric Utilities: $5,997,000 ($402.75)
Air Transportation: $1,553,000 ($104.30)Regular Highways: $1,254,000 ($84.22)Police Protection: $308,000 ($20.69)Water Utilities: $132,000 ($8.87)Sewerage: $96,000 ($6.45)Local Fire Protection: $10,000 ($0.67)Miscellaneous Commercial Activities - Other: $2,000 ($0.13)Total Salaries and Wages: $19,005,000 ($1276.36)
Water Utilities - Interest on Debt: $484,000 ($32.51)
Boulder City government finances - Revenue in 2021 (per resident):
Charges - Parks and Recreation: $4,087,000 ($274.48)
Sewerage: $2,617,000 ($175.76)Solid Waste Management: $1,598,000 ($107.32)Other: $770,000 ($51.71)Miscellaneous Commercial Activities: $196,000 ($13.16)Air Transportation: $83,000 ($5.57)Federal Intergovernmental - Other: $1,508,000 ($101.28)
Air Transportation: $834,000 ($56.01)Transit Utilities: $47,000 ($3.16)Local Intergovernmental - Transit Utilities: $1,381,000 ($92.75)
Other: $258,000 ($17.33)Miscellaneous - Rents: $22,621,000 ($1519.21)
Sale of Property: $2,907,000 ($195.23)Fines and Forfeits: $708,000 ($47.55)Interest Earnings: $302,000 ($20.28)General Revenue - Other: $181,000 ($12.16)Revenue - Electric Utilities: $17,070,000 ($1146.41)
Water Utilities: $14,119,000 ($948.22)State Intergovernmental - General Local Government Support: $11,930,000 ($801.21)
Other: $1,566,000 ($105.17)Highways: $448,000 ($30.09)Tax - Property: $3,059,000 ($205.44)
Other License: $2,152,000 ($144.53)General Sales and Gross Receipts: $942,000 ($63.26)Public Utilities Sales: $833,000 ($55.94)Occupation and Business License - Other: $359,000 ($24.11)Alcoholic Beverage License: $48,000 ($3.22)Other Selective Sales: $38,000 ($2.55)Motor Fuels Sales: $15,000 ($1.01)
Boulder City government finances - Debt in 2021 (per resident):
Long Term Debt - Beginning Outstanding - Public Debt for Private Purpose: $23,495,000 ($1577.90)
Outstanding Nonguaranteed - Industrial Revenue: $21,749,000 ($1460.64)Retired Unspecified Public Purpose: $1,852,000 ($124.38)Beginning Outstanding - Unspecified Public Purpose: $1,852,000 ($124.38)Retired Nonguaranteed - Public Debt for Private Purpose: $1,746,000 ($117.26)
Boulder City government finances - Cash and Securities in 2021 (per resident):
Bond Funds - Cash and Securities: $5,513,000 ($370.25)
Other Funds - Cash and Securities: $123,253,000 ($8277.57)
Sinking Funds - Cash and Securities: $21,749,000 ($1460.64)
6.10% of this county's 2021 resident taxpayers lived in other counties in 2020 ($110,616 average adjusted gross income )
Here:
6.10%Nevada average:
6.67%
0.06% of residents moved from foreign countries ($580 average AGI )Clark County:
0.06%Nevada average:
0.05%
Top counties from which taxpayers relocated into this county between 2020 and 2021:
5.29% of this county's 2020 resident taxpayers moved to other counties in 2021 ($64,726 average adjusted gross income )
Here:
5.29%Nevada average:
5.77%
0.05% of residents moved to foreign countries ($695 average AGI )Clark County:
0.05%Nevada average:
0.04%
Top counties to which taxpayers relocated from this county between 2020 and 2021:
Businesses in Boulder City, NV
Name Count Name Count
7-Eleven 2 MasterBrand Cabinets 1 Ace Hardware 1 McDonald's 1 Albertsons 1 Nike 2 AutoZone 1 Panda Express 1 Big O Tires 1 Pizza Hut 1 CVS 1 RadioShack 1 Curves 1 Safeway 1 Dairy Queen 1 Starbucks 1 Domino's Pizza 1 T-Mobile 1 FedEx 3 True Value 1 GNC 1 U-Haul 1 H&R Block 1 UPS 4 KFC 1 Vons 1
Strongest AM radio stations in Boulder City:
KDWN (720 AM; 50 kW; LAS VEGAS, NV; Owner: RADIO NEVADA CORP.)
KLSQ (870 AM; 10 kW; WHITNEY, NV; Owner: KLSQ-AM LICENSE CORPORATION)
KXNT (840 AM; 50 kW; NORTH LAS VEGAS, NV; Owner: INFINITY RADIO OPERATIONS INC.)
KDOX (1280 AM; 5 kW; HENDERSON, NV; Owner: S & R BROADCASTING, INC.)
KSFN (1140 AM; 10 kW; NORTH LAS VEGAS, NV; Owner: INFINITY RADIO OPERATIONS INC.)
KENO (1460 AM; 10 kW; LAS VEGAS, NV; Owner: LOTUS BROADCASTING CORP.)
KNUU (970 AM; 5 kW; PARADISE, NV; Owner: NEVADA MEDIA GROUP, INC.)
KBAD (920 AM; 5 kW; LAS VEGAS, NV; Owner: LOTUS BROADCASTING CORP.)
KKVV (1060 AM; 5 kW; LAS VEGAS, NV; Owner: LAS VEGAS BROADCASTERS, INC.)
KSHP (1400 AM; 5 kW; NORTH LAS VEGAS, NV; Owner: LAS VEGAS RADIO CO. INC)
KLAC (570 AM; 50 kW; LOS ANGELES, CA; Owner: AMFM RADIO LICENSES, L.L.C.)
KMIA (710 AM; 50 kW; BLACK CANYON CITY, AZ; Owner: ENTRAVISION HOLDINGS, LLC)
KLAV (1230 AM; 1 kW; LAS VEGAS, NV; Owner: GOR-OVERGAARD BROADCASTING, INC.)
Strongest FM radio stations in Boulder City:
KSTJ (102.7 FM; BOULDER CITY, NV; Owner: KJUL LICENSE, LLC)
KJUL (104.3 FM; NORTH LAS VEGAS, NV; Owner: KJUL LICENSE, LLC)
KXPT (97.1 FM; LAS VEGAS, NV; Owner: LOTUS BROADCASTING CORP.)
KNPR (89.5 FM; LAS VEGAS, NV; Owner: NEVADA PUBLIC RADIO CORPORATION)
KOAS (105.7 FM; DOLAN SPRINGS, AZ; Owner: DESERT SKY MEDIA, LLC)
K295AJ (106.9 FM; NORTH LAS VEGAS, NV; Owner: CSN INTERNATIONAL)
KRRN-FM1 (92.7 FM; EAST LAS VEGAS, NV; Owner: ENTRAVISION HOLDINGS, LLC)
KKLZ (96.3 FM; LAS VEGAS, NV; Owner: KJUL LICENSE, LLC)
KILA (90.5 FM; LAS VEGAS, NV; Owner: FAITH COMMUNICATIONS CORP.)
KSNE-FM (106.5 FM; LAS VEGAS, NV; Owner: CITICASTERS LICENSES, L.P.)
KMXB (94.1 FM; HENDERSON, NV; Owner: INFINITY RADIO OPERATIONS INC.)
KCEP (88.1 FM; LAS VEGAS, NV; Owner: ECONOMIC OPPORTUNITY BOARD OF CLARK COUNTY)
KWID (101.9 FM; LAS VEGAS, NV; Owner: CITICASTERS LICENSES, L.P.)
KMZQ-FM (100.5 FM; HENDERSON, NV; Owner: INFINITY RADIO OPERATIONS INC.)
KWNR (95.5 FM; HENDERSON, NV; Owner: CITICASTERS LICENSES, L.P.)
KVEG-FM1 (97.5 FM; HENDERSON, NV; Owner: KEMP BROADCASTING, INC.)
KUNV (91.5 FM; LAS VEGAS, NV; Owner: UNIV OF NEVADA SYSTEM BD OF REGENTS)
K211DC (90.1 FM; PAHRUMP, NV; Owner: CALVARY CHAPEL OF TWIN FALLS, INC.)
KQOL-FM (93.1 FM; LAS VEGAS, NV; Owner: CITICASTERS LICENSES, L.P.)
KXTE (107.5 FM; PAHRUMP, NV; Owner: INFINITY RADIO OPERATIONS INC.)
TV broadcast stations around Boulder City:
K57FA (Channel 57; LAS VEGAS, NV; Owner: TRINITY BROADCASTING NETWORK)
KVBC (Channel 3; LAS VEGAS, NV; Owner: VALLEY BROADCASTING COMPANY)
KVVU-TV (Channel 5; HENDERSON, NV; Owner: KVVU BROADCASTING CORPORATION)
KBLR (Channel 39; PARADISE, NV; Owner: SUMMIT MEDIA LIMITED PARTNERSHIP)
K67GB (Channel 67; LAS VEGAS, NV; Owner: WORD OF GOD FELLOWSHIP, INC.)
KLAS-TV (Channel 8; LAS VEGAS, NV; Owner: KLAS, INC. (A NEVADA CORPORATION))
K43FO (Channel 43; LAS VEGAS, NV; Owner: THREE ANGELS BROADCASTING NETWORK, INC.)
KTNV (Channel 13; LAS VEGAS, NV; Owner: JOURNAL BROADCAST CORPORATION)
KFBT (Channel 33; LAS VEGAS, NV; Owner: CHANNEL 33, INC.)
KLSV-LP (Channel 50; LAS VEGAS, NV; Owner: BILTMORE BROADCASTING CORPORATION)
KVWB (Channel 21; LAS VEGAS, NV; Owner: KUPN LICENSEE, LLC)
KLVX (Channel 10; LAS VEGAS, NV; Owner: CLARK COUNTY SCHOOL DISTRICT)
KINC (Channel 15; LAS VEGAS, NV; Owner: ENTRAVISION HOLDINGS, LLC)
KTVY-LP (Channel 63; LAS VEGAS, NV; Owner: KALEIDOSCOPE AFFILIATES OF LAS VEGAS)
KVPX-LP (Channel 59; LAS VEGAS, NV; Owner: LOCALONE TEXAS, LTD.)
K11DS (Channel 11; BOULDER CITY, NV; Owner: JOURNAL BROADCAST CORPORATION)
KNBX-LP (Channel 31; LAS VEGAS, NV; Owner: EQUITY BROADCASTING CORPORATION)
KYRK-LP (Channel 35; LAS VEGAS, NV; Owner: MAKO COMMUNICATIONS, LLC)
K46GX (Channel 46; HENDERSON, NV; Owner: KLAS, INC. (A NEVADA CORPORATION))
KTUD-LP (Channel 25; LAS VEGAS, NV; Owner: FOUR SEASONS LAS VEGAS, LLC)
KGNG-LP (Channel 47; LAS VEGAS, NV; Owner: KING KONG BROADCASTING, INC.)
KELV-LP (Channel 27; LAS VEGAS, NV; Owner: ENTRAVISION HOLDINGS, LLC)
Home Mortgage Disclosure Act Aggregated Statistics For Year 2009(Based on 3 full and 2 partial tracts) A) FHA, FSA/RHS & VA B) Conventional C) Refinancings D) Home Improvement Loans F) Non-occupant Loans on G) Loans On Manufactured Number Average Value Number Average Value Number Average Value Number Average Value Number Average Value Number Average Value
LOANS ORIGINATED 121 $233,932 139 $250,659 405 $240,818 7 $155,143 89 $206,386 4 $139,972 APPLICATIONS APPROVED, NOT ACCEPTED 8 $207,710 8 $250,182 43 $324,920 4 $65,035 8 $170,519 2 $71,090 APPLICATIONS DENIED 22 $228,838 26 $286,278 169 $279,256 5 $173,310 27 $227,363 3 $75,343 APPLICATIONS WITHDRAWN 14 $225,331 17 $260,112 102 $265,915 4 $92,290 16 $213,443 3 $120,100 FILES CLOSED FOR INCOMPLETENESS 2 $161,465 3 $276,547 23 $331,088 3 $420,100 2 $295,980 0 $0
Aggregated Statistics For Year 2008(Based on 3 full and 2 partial tracts) A) FHA, FSA/RHS & VA B) Conventional C) Refinancings D) Home Improvement Loans F) Non-occupant Loans on G) Loans On Manufactured Number Average Value Number Average Value Number Average Value Number Average Value Number Average Value Number Average Value
LOANS ORIGINATED 73 $264,377 169 $284,408 219 $262,394 17 $100,702 70 $238,166 5 $133,460 APPLICATIONS APPROVED, NOT ACCEPTED 9 $265,390 36 $295,674 41 $320,028 3 $24,840 15 $293,363 2 $138,205 APPLICATIONS DENIED 17 $277,012 43 $345,083 154 $310,796 24 $98,140 24 $286,816 5 $45,708 APPLICATIONS WITHDRAWN 8 $289,524 26 $367,972 61 $277,736 2 $205,125 13 $303,527 2 $123,190 FILES CLOSED FOR INCOMPLETENESS 1 $345,600 3 $578,623 12 $466,666 1 $50,080 2 $309,630 1 $132,470
Aggregated Statistics For Year 2007(Based on 3 full and 2 partial tracts) A) FHA, FSA/RHS & VA B) Conventional C) Refinancings D) Home Improvement Loans F) Non-occupant Loans on G) Loans On Manufactured Number Average Value Number Average Value Number Average Value Number Average Value Number Average Value Number Average Value
LOANS ORIGINATED 5 $263,892 406 $287,040 399 $301,518 42 $157,464 147 $267,224 5 $165,730 APPLICATIONS APPROVED, NOT ACCEPTED 0 $0 78 $304,728 85 $315,806 15 $70,795 34 $262,454 4 $96,125 APPLICATIONS DENIED 4 $254,725 100 $383,387 248 $321,374 38 $176,370 52 $370,808 5 $116,006 APPLICATIONS WITHDRAWN 1 $355,060 59 $296,588 114 $341,304 7 $157,020 27 $291,773 1 $113,920 FILES CLOSED FOR INCOMPLETENESS 0 $0 11 $424,018 33 $321,439 4 $141,052 7 $392,394 0 $0
Aggregated Statistics For Year 2006(Based on 3 full and 2 partial tracts) A) FHA, FSA/RHS & VA B) Conventional C) Refinancings D) Home Improvement Loans E) Loans on Dwellings For 5+ Families F) Non-occupant Loans on G) Loans On Manufactured Number Average Value Number Average Value Number Average Value Number Average Value Number Average Value Number Average Value Number Average Value
LOANS ORIGINATED 9 $230,348 773 $269,888 496 $305,702 63 $135,532 1 $66,515,980 205 $275,917 9 $171,801 APPLICATIONS APPROVED, NOT ACCEPTED 1 $209,000 151 $309,106 93 $322,011 15 $114,277 0 $0 42 $315,240 2 $84,965 APPLICATIONS DENIED 0 $0 138 $299,523 258 $318,894 34 $219,492 0 $0 60 $328,053 6 $159,912 APPLICATIONS WITHDRAWN 1 $333,060 133 $308,685 180 $323,471 9 $163,751 0 $0 33 $313,602 3 $114,803 FILES CLOSED FOR INCOMPLETENESS 0 $0 12 $252,796 53 $300,919 2 $129,585 0 $0 4 $286,372 0 $0
Aggregated Statistics For Year 2005(Based on 3 full and 2 partial tracts) A) FHA, FSA/RHS & VA B) Conventional C) Refinancings D) Home Improvement Loans F) Non-occupant Loans on G) Loans On Manufactured Number Average Value Number Average Value Number Average Value Number Average Value Number Average Value Number Average Value
LOANS ORIGINATED 1 $322,820 927 $253,782 616 $282,404 69 $169,788 293 $242,607 12 $155,915 APPLICATIONS APPROVED, NOT ACCEPTED 0 $0 120 $243,070 93 $332,599 15 $167,488 42 $245,634 6 $114,130 APPLICATIONS DENIED 0 $0 177 $307,363 222 $297,616 45 $109,426 61 $293,791 6 $148,592 APPLICATIONS WITHDRAWN 0 $0 126 $283,531 247 $264,693 28 $165,424 48 $258,706 7 $141,863 FILES CLOSED FOR INCOMPLETENESS 0 $0 37 $302,071 53 $312,302 2 $73,000 13 $283,390 1 $140,410
Aggregated Statistics For Year 2004(Based on 3 full and 2 partial tracts) A) FHA, FSA/RHS & VA B) Conventional C) Refinancings D) Home Improvement Loans E) Loans on Dwellings For 5+ Families F) Non-occupant Loans on G) Loans On Manufactured Number Average Value Number Average Value Number Average Value Number Average Value Number Average Value Number Average Value Number Average Value
LOANS ORIGINATED 8 $168,114 670 $264,204 563 $248,870 40 $129,411 0 $0 243 $241,288 6 $142,773 APPLICATIONS APPROVED, NOT ACCEPTED 0 $0 71 $249,689 91 $228,776 6 $83,367 0 $0 24 $237,333 7 $94,184 APPLICATIONS DENIED 2 $187,470 94 $267,694 192 $230,046 34 $81,653 0 $0 35 $212,003 12 $129,385 APPLICATIONS WITHDRAWN 0 $0 88 $250,708 163 $217,896 14 $142,799 1 $101,560 28 $179,350 4 $101,558 FILES CLOSED FOR INCOMPLETENESS 0 $0 25 $285,636 29 $249,489 9 $136,707 0 $0 13 $253,845 1 $94,490
Aggregated Statistics For Year 2003(Based on 3 full and 2 partial tracts) A) FHA, FSA/RHS & VA B) Conventional C) Refinancings D) Home Improvement Loans F) Non-occupant Loans on Number Average Value Number Average Value Number Average Value Number Average Value Number Average Value
LOANS ORIGINATED 15 $163,402 615 $224,295 1,099 $192,900 20 $53,375 256 $180,553 APPLICATIONS APPROVED, NOT ACCEPTED 0 $0 61 $211,876 144 $170,596 5 $62,260 18 $182,102 APPLICATIONS DENIED 4 $145,032 71 $221,580 233 $200,469 21 $32,746 26 $208,468 APPLICATIONS WITHDRAWN 2 $82,260 60 $221,593 219 $195,297 5 $34,372 25 $174,651 FILES CLOSED FOR INCOMPLETENESS 1 $158,000 13 $161,610 43 $227,979 9 $43,000 6 $196,418
Aggregated Statistics For Year 2002(Based on 3 full and 1 partial tracts) A) FHA, FSA/RHS & VA B) Conventional C) Refinancings D) Home Improvement Loans F) Non-occupant Loans on Number Average Value Number Average Value Number Average Value Number Average Value Number Average Value
LOANS ORIGINATED 22 $125,946 233 $180,815 496 $177,741 16 $31,026 96 $156,753 APPLICATIONS APPROVED, NOT ACCEPTED 2 $157,000 31 $150,065 76 $189,586 5 $27,200 7 $85,661 APPLICATIONS DENIED 2 $178,375 25 $166,276 84 $160,799 9 $48,968 7 $98,903 APPLICATIONS WITHDRAWN 4 $117,500 25 $174,565 109 $178,627 4 $18,770 13 $185,904 FILES CLOSED FOR INCOMPLETENESS 0 $0 16 $161,866 28 $193,096 0 $0 4 $121,328
Aggregated Statistics For Year 2001(Based on 3 full and 1 partial tracts) A) FHA, FSA/RHS & VA B) Conventional C) Refinancings D) Home Improvement Loans F) Non-occupant Loans on Number Average Value Number Average Value Number Average Value Number Average Value Number Average Value
LOANS ORIGINATED 30 $120,984 245 $164,619 339 $171,665 20 $29,109 73 $144,341 APPLICATIONS APPROVED, NOT ACCEPTED 1 $128,000 23 $124,610 54 $192,428 2 $34,345 13 $109,315 APPLICATIONS DENIED 3 $139,333 33 $138,051 85 $168,229 18 $25,871 10 $144,772 APPLICATIONS WITHDRAWN 2 $103,500 34 $149,933 83 $214,209 2 $24,285 11 $117,938 FILES CLOSED FOR INCOMPLETENESS 0 $0 11 $110,997 29 $206,025 0 $0 9 $145,786
Aggregated Statistics For Year 2000(Based on 3 full and 1 partial tracts) A) FHA, FSA/RHS & VA B) Conventional C) Refinancings D) Home Improvement Loans F) Non-occupant Loans on Number Average Value Number Average Value Number Average Value Number Average Value Number Average Value
LOANS ORIGINATED 20 $119,844 170 $152,072 76 $151,516 25 $30,924 41 $138,185 APPLICATIONS APPROVED, NOT ACCEPTED 3 $108,177 23 $171,461 23 $288,042 13 $37,700 5 $110,984 APPLICATIONS DENIED 5 $105,400 40 $124,047 60 $208,166 25 $44,600 3 $120,760 APPLICATIONS WITHDRAWN 4 $112,608 23 $125,719 45 $200,471 4 $55,080 9 $144,298 FILES CLOSED FOR INCOMPLETENESS 1 $104,210 6 $135,040 17 $184,344 0 $0 2 $114,160
Aggregated Statistics For Year 1999(Based on 4 full tracts) A) FHA, FSA/RHS & VA B) Conventional C) Refinancings D) Home Improvement Loans F) Non-occupant Loans on Number Average Value Number Average Value Number Average Value Number Average Value Number Average Value
LOANS ORIGINATED 37 $121,224 169 $162,055 179 $170,327 26 $26,025 39 $133,069 APPLICATIONS APPROVED, NOT ACCEPTED 0 $0 15 $152,153 48 $162,983 9 $22,889 3 $161,010 APPLICATIONS DENIED 10 $131,353 37 $158,699 68 $188,150 23 $21,200 6 $111,950 APPLICATIONS WITHDRAWN 0 $0 31 $171,886 60 $151,866 1 $21,890 6 $85,900 FILES CLOSED FOR INCOMPLETENESS 2 $108,000 10 $201,296 18 $164,669 1 $49,090 2 $133,995
Detailed HMDA statistics for the following Tracts:
0055.01
, 0055.02 , 0055.03 , 0055.04 , 0057.10
Private Mortgage Insurance Companies Aggregated Statistics For Year 2009(Based on 3 full and 2 partial tracts) A) Conventional B) Refinancings C) Non-occupant Loans on Number Average Value Number Average Value Number Average Value
LOANS ORIGINATED 12 $254,364 4 $276,912 1 $153,550 APPLICATIONS APPROVED, NOT ACCEPTED 6 $271,138 3 $300,810 1 $292,500 APPLICATIONS DENIED 3 $214,873 1 $229,200 1 $166,940 APPLICATIONS WITHDRAWN 1 $257,550 2 $233,300 0 $0 FILES CLOSED FOR INCOMPLETENESS 0 $0 0 $0 0 $0
Aggregated Statistics For Year 2008(Based on 3 full and 2 partial tracts) A) Conventional B) Refinancings C) Non-occupant Loans on Number Average Value Number Average Value Number Average Value
LOANS ORIGINATED 41 $299,989 16 $303,286 6 $224,885 APPLICATIONS APPROVED, NOT ACCEPTED 13 $333,907 8 $332,594 3 $334,873 APPLICATIONS DENIED 5 $327,798 2 $345,720 2 $268,860 APPLICATIONS WITHDRAWN 5 $271,524 3 $296,037 0 $0 FILES CLOSED FOR INCOMPLETENESS 1 $178,250 1 $244,000 0 $0
Aggregated Statistics For Year 2007(Based on 3 full and 2 partial tracts) A) Conventional B) Refinancings C) Non-occupant Loans on Number Average Value Number Average Value Number Average Value
LOANS ORIGINATED 61 $304,386 31 $321,364 12 $299,658 APPLICATIONS APPROVED, NOT ACCEPTED 7 $288,126 14 $331,951 4 $279,665 APPLICATIONS DENIED 1 $440,660 1 $842,200 1 $478,920 APPLICATIONS WITHDRAWN 2 $253,900 1 $331,980 0 $0 FILES CLOSED FOR INCOMPLETENESS 1 $196,330 0 $0 0 $0
Aggregated Statistics For Year 2006(Based on 3 full and 2 partial tracts) A) Conventional B) Refinancings C) Non-occupant Loans on Number Average Value Number Average Value Number Average Value
LOANS ORIGINATED 36 $303,104 16 $329,979 6 $304,353 APPLICATIONS APPROVED, NOT ACCEPTED 4 $268,958 3 $331,640 3 $149,850 APPLICATIONS DENIED 1 $152,340 1 $408,490 0 $0 APPLICATIONS WITHDRAWN 2 $301,305 2 $345,420 1 $317,750 FILES CLOSED FOR INCOMPLETENESS 0 $0 0 $0 0 $0
Aggregated Statistics For Year 2005(Based on 3 full and 2 partial tracts) A) Conventional B) Refinancings C) Non-occupant Loans on Number Average Value Number Average Value Number Average Value
LOANS ORIGINATED 50 $304,891 17 $287,409 13 $288,148 APPLICATIONS APPROVED, NOT ACCEPTED 7 $299,399 6 $335,028 4 $251,248 APPLICATIONS DENIED 0 $0 0 $0 0 $0 APPLICATIONS WITHDRAWN 2 $228,590 0 $0 1 $238,240 FILES CLOSED FOR INCOMPLETENESS 1 $301,650 1 $190,750 0 $0
Aggregated Statistics For Year 2004(Based on 3 full and 2 partial tracts) A) Conventional B) Refinancings C) Non-occupant Loans on D) Loans On Manufactured Number Average Value Number Average Value Number Average Value Number Average Value
LOANS ORIGINATED 76 $258,260 18 $220,848 23 $255,490 1 $182,800 APPLICATIONS APPROVED, NOT ACCEPTED 16 $247,948 9 $211,524 3 $305,540 0 $0 APPLICATIONS DENIED 1 $272,150 0 $0 0 $0 0 $0 APPLICATIONS WITHDRAWN 4 $305,960 0 $0 1 $204,510 0 $0 FILES CLOSED FOR INCOMPLETENESS 1 $167,470 0 $0 0 $0 0 $0
Aggregated Statistics For Year 2003(Based on 3 full and 2 partial tracts) A) Conventional B) Refinancings C) Non-occupant Loans on Number Average Value Number Average Value Number Average Value
LOANS ORIGINATED 115 $224,309 75 $196,901 26 $195,768 APPLICATIONS APPROVED, NOT ACCEPTED 13 $199,436 19 $200,242 4 $114,950 APPLICATIONS DENIED 2 $355,230 0 $0 0 $0 APPLICATIONS WITHDRAWN 5 $240,676 2 $297,455 1 $111,470 FILES CLOSED FOR INCOMPLETENESS 0 $0 0 $0 0 $0
Aggregated Statistics For Year 2002(Based on 3 full and 1 partial tracts) A) Conventional B) Refinancings C) Non-occupant Loans on Number Average Value Number Average Value Number Average Value
LOANS ORIGINATED 69 $178,328 40 $156,670 11 $165,891 APPLICATIONS APPROVED, NOT ACCEPTED 9 $169,331 12 $176,851 3 $101,403 APPLICATIONS DENIED 1 $336,460 0 $0 1 $336,460 APPLICATIONS WITHDRAWN 1 $145,000 0 $0 0 $0 FILES CLOSED FOR INCOMPLETENESS 0 $0 0 $0 0 $0
Aggregated Statistics For Year 2001(Based on 3 full and 1 partial tracts) A) Conventional B) Refinancings C) Non-occupant Loans on Number Average Value Number Average Value Number Average Value
LOANS ORIGINATED 76 $158,768 55 $159,091 12 $141,494 APPLICATIONS APPROVED, NOT ACCEPTED 10 $161,019 14 $168,151 2 $81,595 APPLICATIONS DENIED 3 $191,973 2 $179,500 2 $208,960 APPLICATIONS WITHDRAWN 1 $77,000 3 $147,333 0 $0 FILES CLOSED FOR INCOMPLETENESS 1 $135,110 0 $0 0 $0
Aggregated Statistics For Year 2000(Based on 3 full and 1 partial tracts) A) Conventional B) Refinancings C) Non-occupant Loans on Number Average Value Number Average Value Number Average Value
LOANS ORIGINATED 57 $152,137 10 $148,285 5 $113,646 APPLICATIONS APPROVED, NOT ACCEPTED 7 $129,143 2 $117,000 0 $0 APPLICATIONS DENIED 5 $187,162 1 $204,000 1 $151,890 APPLICATIONS WITHDRAWN 1 $151,890 0 $0 1 $151,890 FILES CLOSED FOR INCOMPLETENESS 0 $0 0 $0 0 $0
Aggregated Statistics For Year 1999(Based on 4 full tracts) A) Conventional B) Refinancings C) Non-occupant Loans on Number Average Value Number Average Value Number Average Value
LOANS ORIGINATED 61 $145,882 23 $169,470 6 $135,757 APPLICATIONS APPROVED, NOT ACCEPTED 7 $125,650 9 $181,029 4 $212,500 APPLICATIONS DENIED 3 $172,297 2 $114,415 0 $0 APPLICATIONS WITHDRAWN 3 $220,537 1 $155,000 1 $171,120 FILES CLOSED FOR INCOMPLETENESS 0 $0 1 $114,880 0 $0
Detailed PMIC statistics for the following Tracts:
0055.01
, 0055.02 , 0055.03 , 0055.04 , 0057.10 Fire-safe hotels and motels in Boulder City, Nevada:
Starview Motel, 1017 NV Hwy, Boulder City, Nevada 89005 Phone: (702) 293-1658
Boulder Inn & Suites, 704 Nevada Hwy, Boulder City, Nevada 89005 Phone: (702) 369-1000, Fax: (702) 293-4344
Boulder Dam Hotel, 1305 Arizona, Boulder City, Nevada 89005 Phone: (702) 293-3510, Fax: (702) 293-3093
Sands Motel Of Boulder City, 809 Nevada Way, Boulder City, Nevada 89005 Phone: (702) 293-2589, Fax: (702) 294-0160
All 4 fire-safe hotels and motels in Boulder City, Nevada
Most common first names in Boulder City, NV among deceased individuals Name Count Lived (average)
John 140 77.5 years Robert 126 74.8 years William 121 74.9 years James 104 74.0 years Mary 86 79.9 years Charles 77 78.0 years George 62 76.5 years Joseph 57 77.5 years Margaret 54 79.8 years Ruth 50 82.2 years
Most common last names in Boulder City, NV among deceased individuals Last name Count Lived (average)
Smith 47 79.9 years Johnson 33 79.0 years Miller 22 77.5 years Thomas 21 70.6 years Williams 21 77.4 years Jones 19 79.5 years Brown 18 72.0 years Wilson 17 75.5 years Anderson 17 80.7 years White 15 75.6 years
Boulder City compared to Nevada state average:
Unemployed percentage below state average. Black race population percentage significantly below state average. Hispanic race population percentage significantly below state average. Median age significantly above state average. Foreign-born population percentage significantly below state average. Length of stay since moving in significantly above state average. House age above state average. Percentage of population with a bachelor's degree or higher above state average. Boulder City on our top lists :
#43 on the list of "Top 101 cities with the most local government spending on current operations of parks and recreation per resident (population 10,000+)"
#60 on the list of "Top 101 cities with the most people born in other U.S. states (population 5,000+)"
#98 on the list of "Top 101 cities with the most users submitting photos to our site per 10,000 residents (population 5,000+)"
#37 (89046) on the list of "Top 101 zip codes with the most casinos in 2005"
#7 on the list of "Top 101 counties with the highest total withdrawal of fresh water for public supply"
#9 on the list of "Top 101 counties with the highest surface withdrawal of fresh water for public supply"
#9 on the list of "Top 101 counties with the highest carbon monoxide air pollution readings in 2012 (ppm)"
#12 on the list of "Top 101 counties with the most Other adherents"
#13 on the list of "Top 101 counties with the most Other congregations (pop. 50,000+)"
Top Patent Applicants
Uwe Rockenfeller (30)
Kaveh Khalili (25)
Paul Sarkisian (15)
Warren Harhay (10)
Richard A. Steinke (8)
Henk Bots (8)
James G. Moore (4)
Richard Donald Witham (2)
Richard D. Witham (2)
Paul Cary Fisher, Jr. (2)
Total of 69 patent applications in 2008-2024.
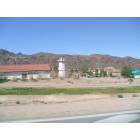
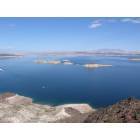
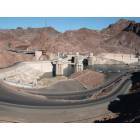
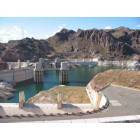
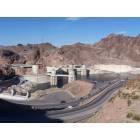
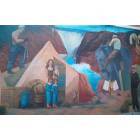
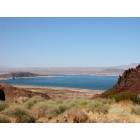
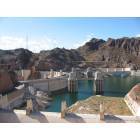


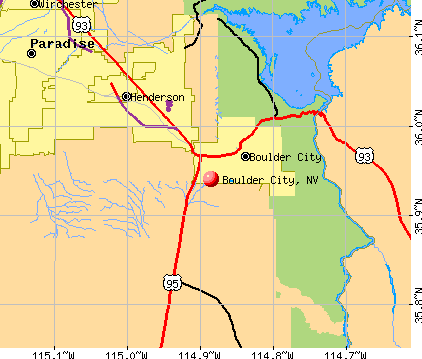


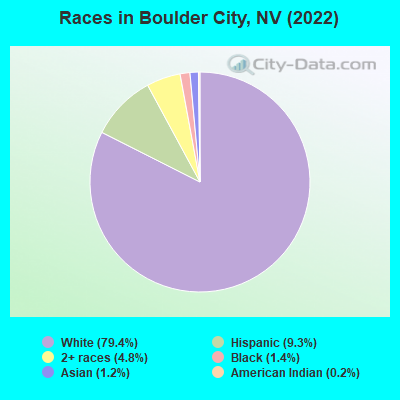
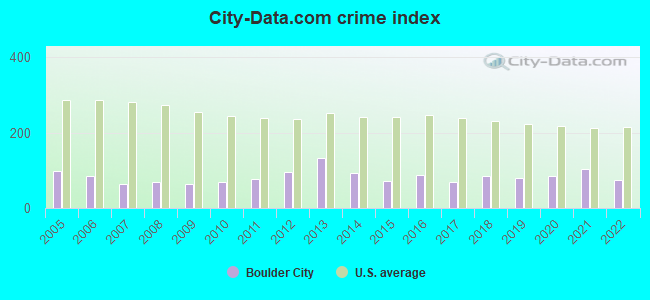
 Recent articles from our blog. Our writers, many of them Ph.D. graduates or candidates, create easy-to-read articles on a wide variety of topics.


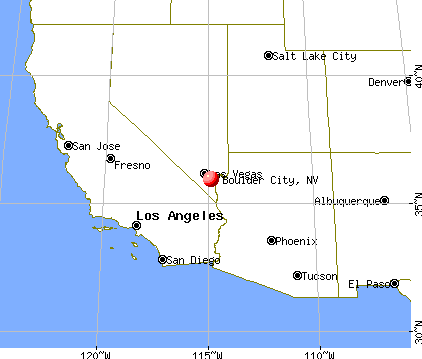
 (10.0 miles
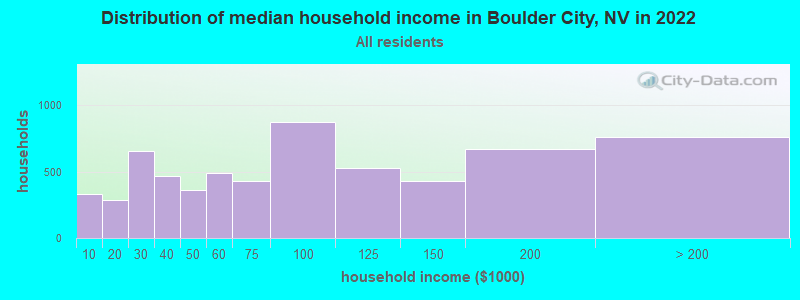
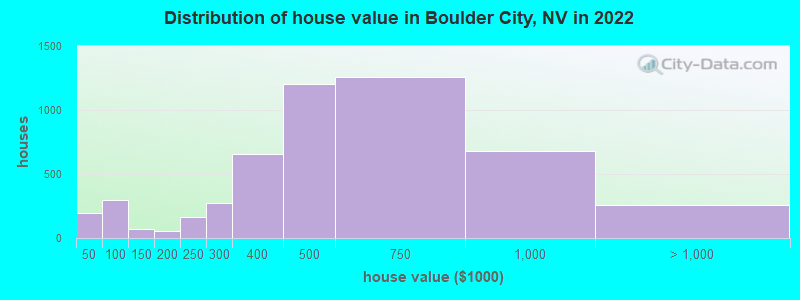
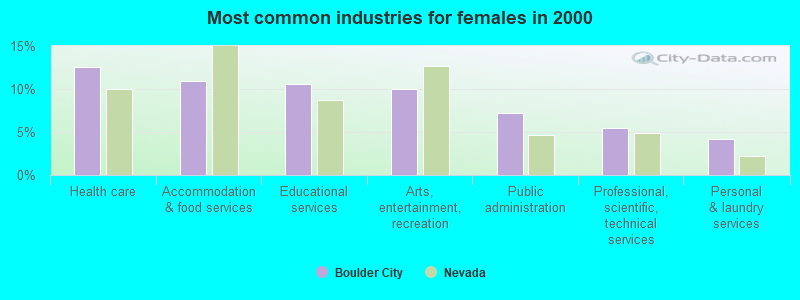
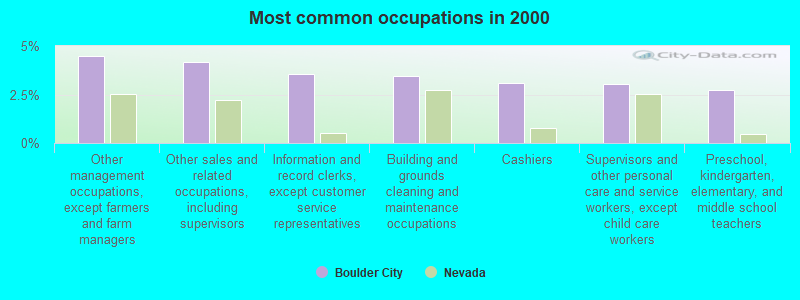
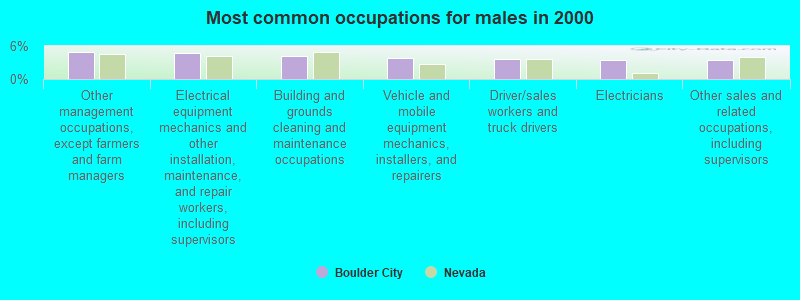
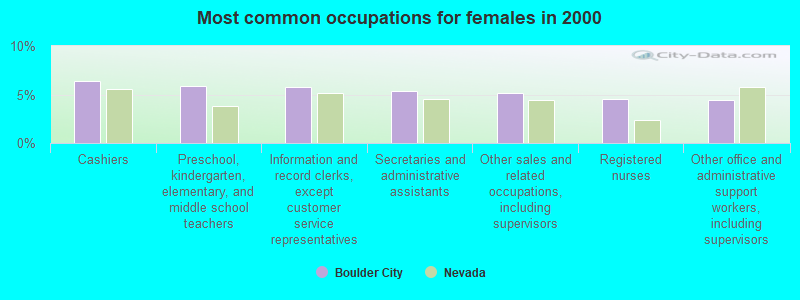
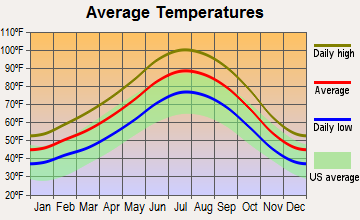
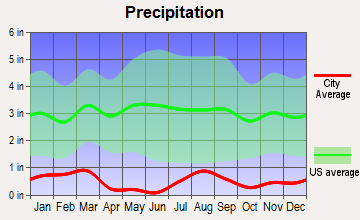
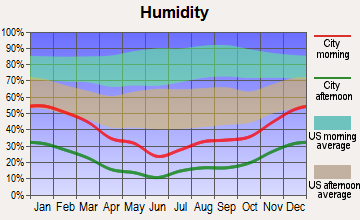
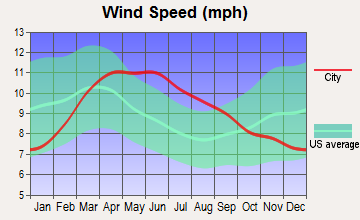
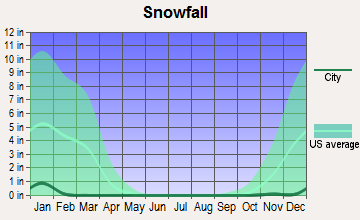
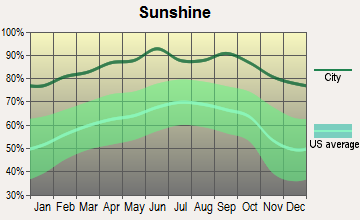
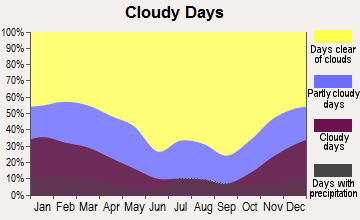
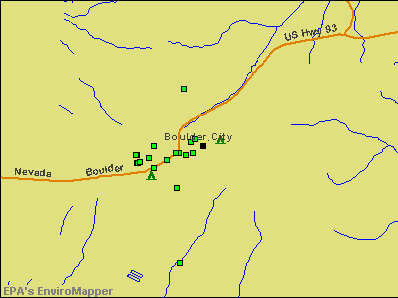

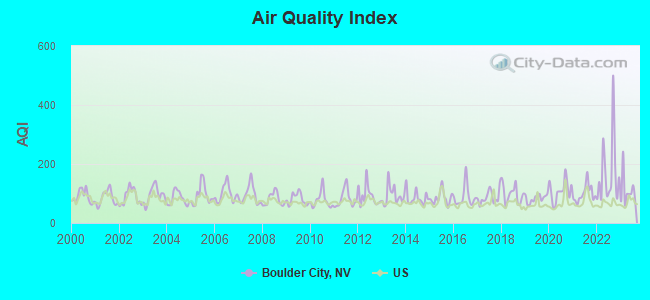
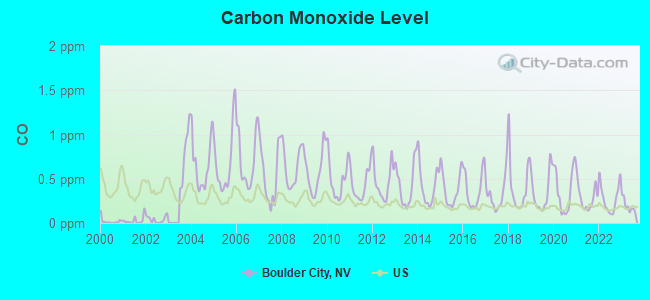
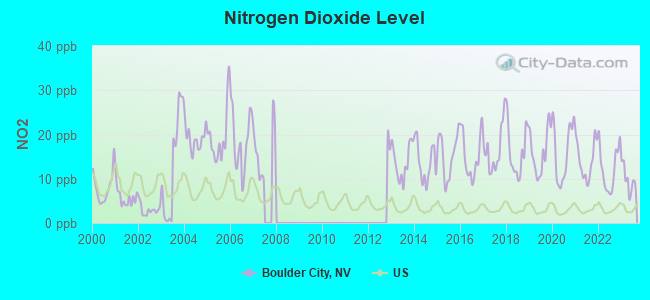
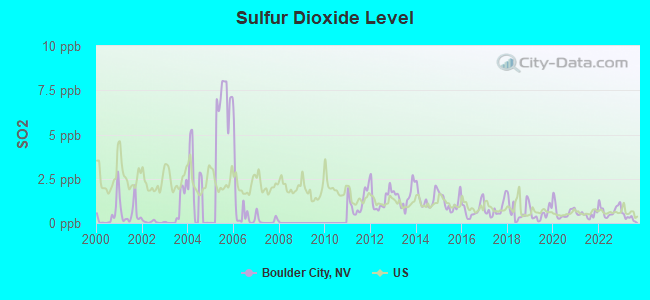
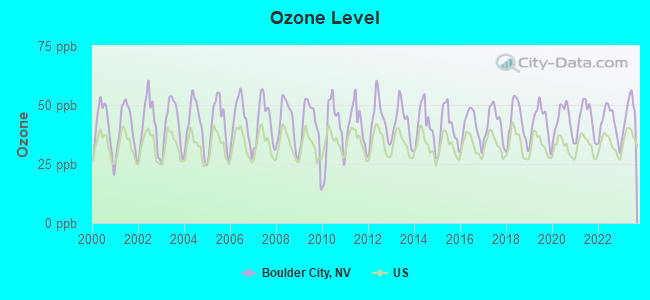
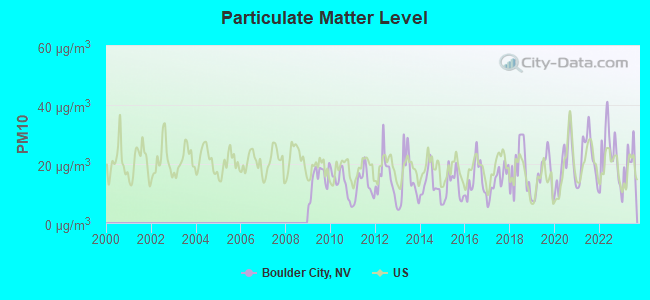
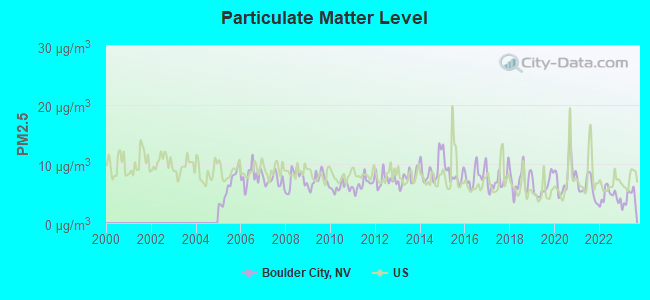
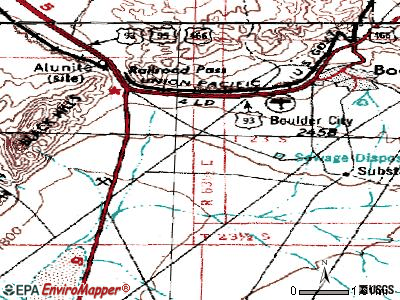
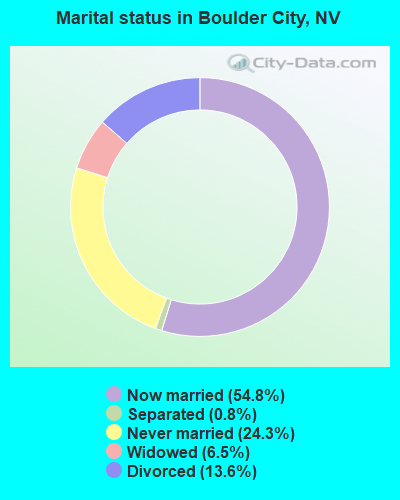
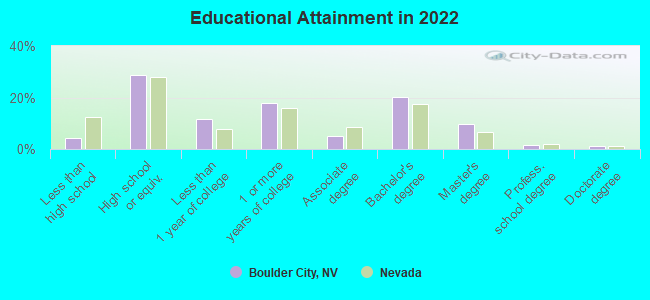
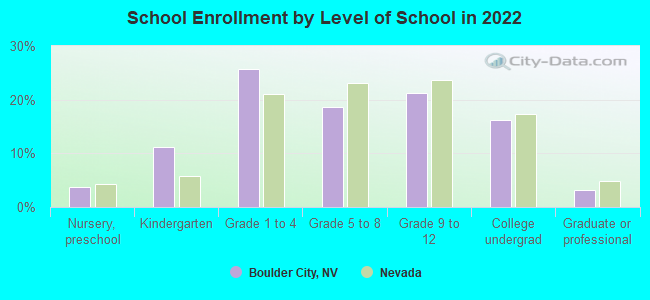
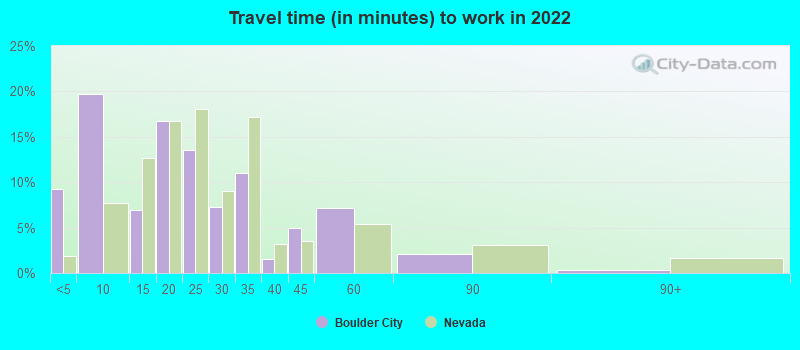
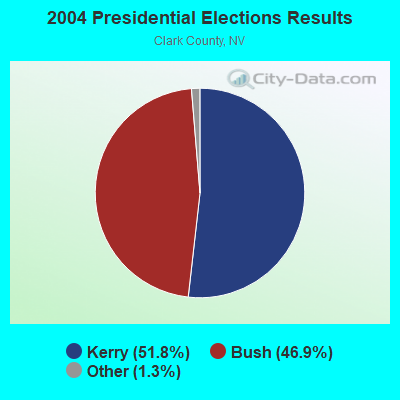
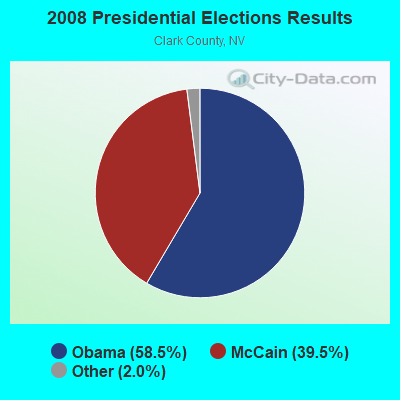
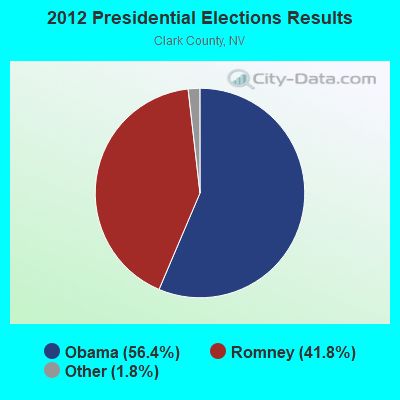
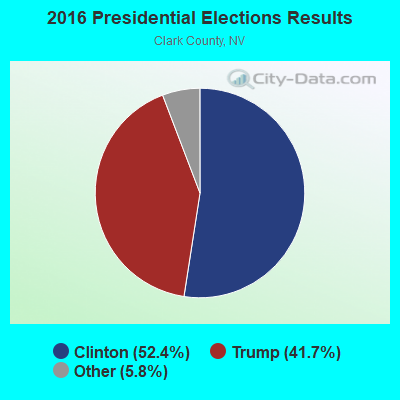
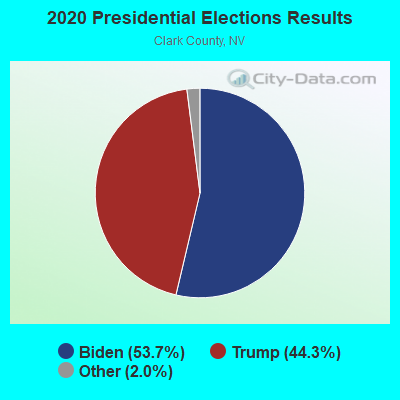
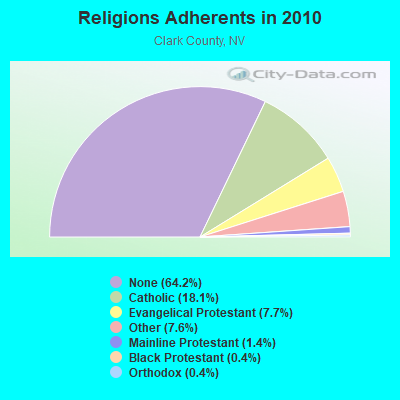
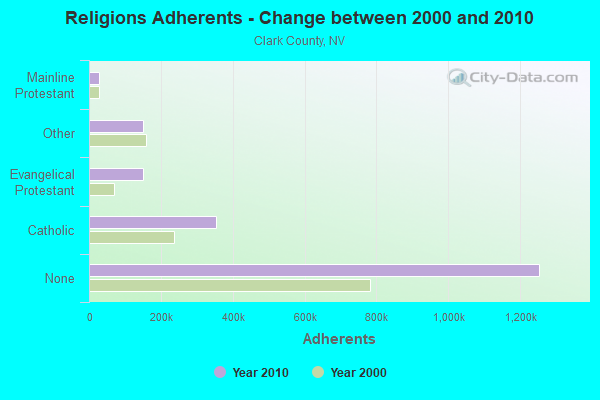
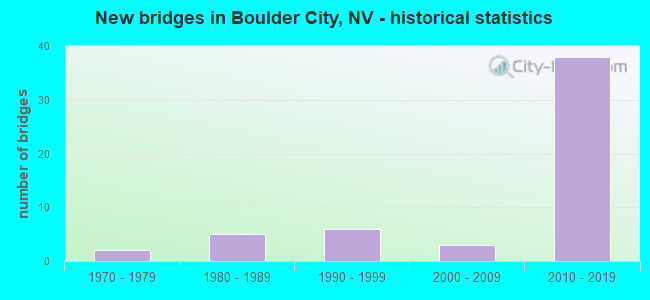
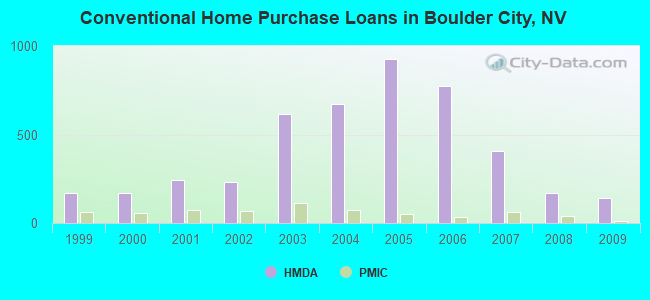
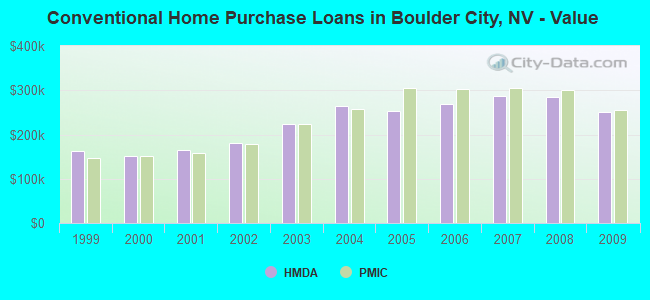
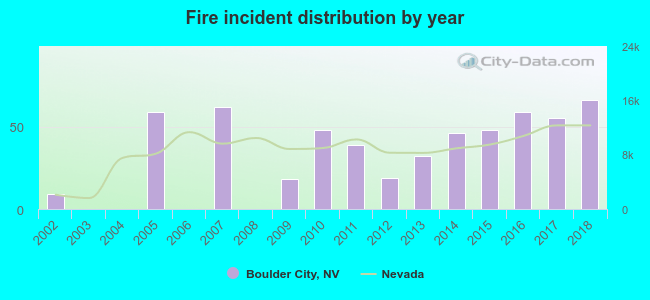 According to the data from the years 2002 - 2018 the average number of fires per year is 33. The highest number of fires - 66 took place in 2018, and the least - 0 in 2003. The data has a growing trend.
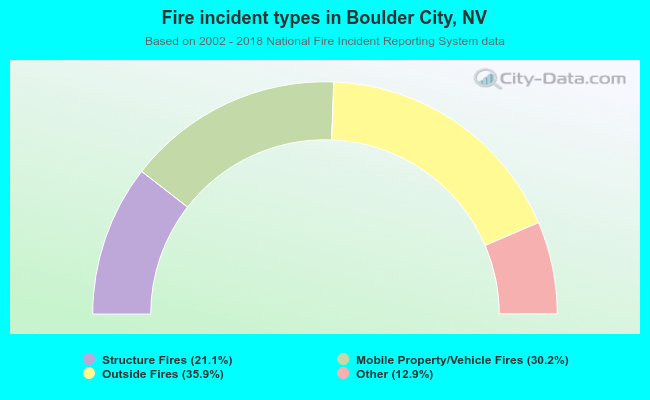 When looking into fire subcategories, the most reports belonged to: Outside Fires (35.9%), and Mobile Property/Vehicle Fires (30.2%).