Delano, California Submit your own pictures of this city and show them to the world
OSM Map
General Map
Google Map
MSN Map
OSM Map
General Map
Google Map
MSN Map
OSM Map
General Map
Google Map
MSN Map
OSM Map
General Map
Google Map
MSN Map
Please wait while loading the map...
Population in 2022: 50,843 (100% urban, 0% rural). Population change since 2000: +31.0%Males: 29,025 Females: 21,818
March 2022 cost of living index in Delano: 92.2 (less than average, U.S. average is 100) Percentage of residents living in poverty in 2022: 19.6%for White Non-Hispanic residents , 54.0% for Black residents , 21.8% for Hispanic or Latino residents , 4.7% for American Indian residents , 14.8% for other race residents , 25.0% for two or more races residents )
Profiles of local businesses
Business Search - 14 Million verified businesses
Data:
Median household income ($)
Median household income (% change since 2000)
Household income diversity
Ratio of average income to average house value (%)
Ratio of average income to average rent
Median household income ($) - White
Median household income ($) - Black or African American
Median household income ($) - Asian
Median household income ($) - Hispanic or Latino
Median household income ($) - American Indian and Alaska Native
Median household income ($) - Multirace
Median household income ($) - Other Race
Median household income for houses/condos with a mortgage ($)
Median household income for apartments without a mortgage ($)
Races - White alone (%)
Races - White alone (% change since 2000)
Races - Black alone (%)
Races - Black alone (% change since 2000)
Races - American Indian alone (%)
Races - American Indian alone (% change since 2000)
Races - Asian alone (%)
Races - Asian alone (% change since 2000)
Races - Hispanic (%)
Races - Hispanic (% change since 2000)
Races - Native Hawaiian and Other Pacific Islander alone (%)
Races - Native Hawaiian and Other Pacific Islander alone (% change since 2000)
Races - Two or more races (%)
Races - Two or more races (% change since 2000)
Races - Other race alone (%)
Races - Other race alone (% change since 2000)
Racial diversity
Unemployment (%)
Unemployment (% change since 2000)
Unemployment (%) - White
Unemployment (%) - Black or African American
Unemployment (%) - Asian
Unemployment (%) - Hispanic or Latino
Unemployment (%) - American Indian and Alaska Native
Unemployment (%) - Multirace
Unemployment (%) - Other Race
Population density (people per square mile)
Population - Males (%)
Population - Females (%)
Population - Males (%) - White
Population - Males (%) - Black or African American
Population - Males (%) - Asian
Population - Males (%) - Hispanic or Latino
Population - Males (%) - American Indian and Alaska Native
Population - Males (%) - Multirace
Population - Males (%) - Other Race
Population - Females (%) - White
Population - Females (%) - Black or African American
Population - Females (%) - Asian
Population - Females (%) - Hispanic or Latino
Population - Females (%) - American Indian and Alaska Native
Population - Females (%) - Multirace
Population - Females (%) - Other Race
Coronavirus confirmed cases (May 09, 2024)
Deaths caused by coronavirus (May 09, 2024)
Coronavirus confirmed cases (per 100k population) (May 09, 2024)
Deaths caused by coronavirus (per 100k population) (May 09, 2024)
Daily increase in number of cases (May 09, 2024)
Weekly increase in number of cases (May 09, 2024)
Cases doubled (in days) (May 09, 2024)
Hospitalized patients (Apr 18, 2022)
Negative test results (Apr 18, 2022)
Total test results (Apr 18, 2022)
COVID Vaccine doses distributed (per 100k population) (Sep 19, 2023)
COVID Vaccine doses administered (per 100k population) (Sep 19, 2023)
COVID Vaccine doses distributed (Sep 19, 2023)
COVID Vaccine doses administered (Sep 19, 2023)
Likely homosexual households (%)
Likely homosexual households (% change since 2000)
Likely homosexual households - Lesbian couples (%)
Likely homosexual households - Lesbian couples (% change since 2000)
Likely homosexual households - Gay men (%)
Likely homosexual households - Gay men (% change since 2000)
Cost of living index
Median gross rent ($)
Median contract rent ($)
Median monthly housing costs ($)
Median house or condo value ($)
Median house or condo value ($ change since 2000)
Mean house or condo value by units in structure - 1, detached ($)
Mean house or condo value by units in structure - 1, attached ($)
Mean house or condo value by units in structure - 2 ($)
Mean house or condo value by units in structure by units in structure - 3 or 4 ($)
Mean house or condo value by units in structure - 5 or more ($)
Mean house or condo value by units in structure - Boat, RV, van, etc. ($)
Mean house or condo value by units in structure - Mobile home ($)
Median house or condo value ($) - White
Median house or condo value ($) - Black or African American
Median house or condo value ($) - Asian
Median house or condo value ($) - Hispanic or Latino
Median house or condo value ($) - American Indian and Alaska Native
Median house or condo value ($) - Multirace
Median house or condo value ($) - Other Race
Median resident age
Resident age diversity
Median resident age - Males
Median resident age - Females
Median resident age - White
Median resident age - Black or African American
Median resident age - Asian
Median resident age - Hispanic or Latino
Median resident age - American Indian and Alaska Native
Median resident age - Multirace
Median resident age - Other Race
Median resident age - Males - White
Median resident age - Males - Black or African American
Median resident age - Males - Asian
Median resident age - Males - Hispanic or Latino
Median resident age - Males - American Indian and Alaska Native
Median resident age - Males - Multirace
Median resident age - Males - Other Race
Median resident age - Females - White
Median resident age - Females - Black or African American
Median resident age - Females - Asian
Median resident age - Females - Hispanic or Latino
Median resident age - Females - American Indian and Alaska Native
Median resident age - Females - Multirace
Median resident age - Females - Other Race
Commute - mean travel time to work (minutes)
Travel time to work - Less than 5 minutes (%)
Travel time to work - Less than 5 minutes (% change since 2000)
Travel time to work - 5 to 9 minutes (%)
Travel time to work - 5 to 9 minutes (% change since 2000)
Travel time to work - 10 to 19 minutes (%)
Travel time to work - 10 to 19 minutes (% change since 2000)
Travel time to work - 20 to 29 minutes (%)
Travel time to work - 20 to 29 minutes (% change since 2000)
Travel time to work - 30 to 39 minutes (%)
Travel time to work - 30 to 39 minutes (% change since 2000)
Travel time to work - 40 to 59 minutes (%)
Travel time to work - 40 to 59 minutes (% change since 2000)
Travel time to work - 60 to 89 minutes (%)
Travel time to work - 60 to 89 minutes (% change since 2000)
Travel time to work - 90 or more minutes (%)
Travel time to work - 90 or more minutes (% change since 2000)
Marital status - Never married (%)
Marital status - Now married (%)
Marital status - Separated (%)
Marital status - Widowed (%)
Marital status - Divorced (%)
Median family income ($)
Median family income (% change since 2000)
Median non-family income ($)
Median non-family income (% change since 2000)
Median per capita income ($)
Median per capita income (% change since 2000)
Median family income ($) - White
Median family income ($) - Black or African American
Median family income ($) - Asian
Median family income ($) - Hispanic or Latino
Median family income ($) - American Indian and Alaska Native
Median family income ($) - Multirace
Median family income ($) - Other Race
Median year house/condo built
Median year apartment built
Year house built - Built 2005 or later (%)
Year house built - Built 2000 to 2004 (%)
Year house built - Built 1990 to 1999 (%)
Year house built - Built 1980 to 1989 (%)
Year house built - Built 1970 to 1979 (%)
Year house built - Built 1960 to 1969 (%)
Year house built - Built 1950 to 1959 (%)
Year house built - Built 1940 to 1949 (%)
Year house built - Built 1939 or earlier (%)
Average household size
Household density (households per square mile)
Average household size - White
Average household size - Black or African American
Average household size - Asian
Average household size - Hispanic or Latino
Average household size - American Indian and Alaska Native
Average household size - Multirace
Average household size - Other Race
Occupied housing units (%)
Vacant housing units (%)
Owner occupied housing units (%)
Renter occupied housing units (%)
Vacancy status - For rent (%)
Vacancy status - For sale only (%)
Vacancy status - Rented or sold, not occupied (%)
Vacancy status - For seasonal, recreational, or occasional use (%)
Vacancy status - For migrant workers (%)
Vacancy status - Other vacant (%)
Residents with income below the poverty level (%)
Residents with income below 50% of the poverty level (%)
Children below poverty level (%)
Poor families by family type - Married-couple family (%)
Poor families by family type - Male, no wife present (%)
Poor families by family type - Female, no husband present (%)
Poverty status for native-born residents (%)
Poverty status for foreign-born residents (%)
Poverty among high school graduates not in families (%)
Poverty among people who did not graduate high school not in families (%)
Residents with income below the poverty level (%) - White
Residents with income below the poverty level (%) - Black or African American
Residents with income below the poverty level (%) - Asian
Residents with income below the poverty level (%) - Hispanic or Latino
Residents with income below the poverty level (%) - American Indian and Alaska Native
Residents with income below the poverty level (%) - Multirace
Residents with income below the poverty level (%) - Other Race
Air pollution - Air Quality Index (AQI)
Air pollution - CO
Air pollution - NO2
Air pollution - SO2
Air pollution - Ozone
Air pollution - PM10
Air pollution - PM25
Air pollution - Pb
Crime - Murders per 100,000 population
Crime - Rapes per 100,000 population
Crime - Robberies per 100,000 population
Crime - Assaults per 100,000 population
Crime - Burglaries per 100,000 population
Crime - Thefts per 100,000 population
Crime - Auto thefts per 100,000 population
Crime - Arson per 100,000 population
Crime - City-data.com crime index
Crime - Violent crime index
Crime - Property crime index
Crime - Murders per 100,000 population (5 year average)
Crime - Rapes per 100,000 population (5 year average)
Crime - Robberies per 100,000 population (5 year average)
Crime - Assaults per 100,000 population (5 year average)
Crime - Burglaries per 100,000 population (5 year average)
Crime - Thefts per 100,000 population (5 year average)
Crime - Auto thefts per 100,000 population (5 year average)
Crime - Arson per 100,000 population (5 year average)
Crime - City-data.com crime index (5 year average)
Crime - Violent crime index (5 year average)
Crime - Property crime index (5 year average)
1996 Presidential Elections Results (%) - Democratic Party (Clinton)
1996 Presidential Elections Results (%) - Republican Party (Dole)
1996 Presidential Elections Results (%) - Other
2000 Presidential Elections Results (%) - Democratic Party (Gore)
2000 Presidential Elections Results (%) - Republican Party (Bush)
2000 Presidential Elections Results (%) - Other
2004 Presidential Elections Results (%) - Democratic Party (Kerry)
2004 Presidential Elections Results (%) - Republican Party (Bush)
2004 Presidential Elections Results (%) - Other
2008 Presidential Elections Results (%) - Democratic Party (Obama)
2008 Presidential Elections Results (%) - Republican Party (McCain)
2008 Presidential Elections Results (%) - Other
2012 Presidential Elections Results (%) - Democratic Party (Obama)
2012 Presidential Elections Results (%) - Republican Party (Romney)
2012 Presidential Elections Results (%) - Other
2016 Presidential Elections Results (%) - Democratic Party (Clinton)
2016 Presidential Elections Results (%) - Republican Party (Trump)
2016 Presidential Elections Results (%) - Other
2020 Presidential Elections Results (%) - Democratic Party (Biden)
2020 Presidential Elections Results (%) - Republican Party (Trump)
2020 Presidential Elections Results (%) - Other
Ancestries Reported - Arab (%)
Ancestries Reported - Czech (%)
Ancestries Reported - Danish (%)
Ancestries Reported - Dutch (%)
Ancestries Reported - English (%)
Ancestries Reported - French (%)
Ancestries Reported - French Canadian (%)
Ancestries Reported - German (%)
Ancestries Reported - Greek (%)
Ancestries Reported - Hungarian (%)
Ancestries Reported - Irish (%)
Ancestries Reported - Italian (%)
Ancestries Reported - Lithuanian (%)
Ancestries Reported - Norwegian (%)
Ancestries Reported - Polish (%)
Ancestries Reported - Portuguese (%)
Ancestries Reported - Russian (%)
Ancestries Reported - Scotch-Irish (%)
Ancestries Reported - Scottish (%)
Ancestries Reported - Slovak (%)
Ancestries Reported - Subsaharan African (%)
Ancestries Reported - Swedish (%)
Ancestries Reported - Swiss (%)
Ancestries Reported - Ukrainian (%)
Ancestries Reported - United States (%)
Ancestries Reported - Welsh (%)
Ancestries Reported - West Indian (%)
Ancestries Reported - Other (%)
Educational Attainment - No schooling completed (%)
Educational Attainment - Less than high school (%)
Educational Attainment - High school or equivalent (%)
Educational Attainment - Less than 1 year of college (%)
Educational Attainment - 1 or more years of college (%)
Educational Attainment - Associate degree (%)
Educational Attainment - Bachelor's degree (%)
Educational Attainment - Master's degree (%)
Educational Attainment - Professional school degree (%)
Educational Attainment - Doctorate degree (%)
School Enrollment - Nursery, preschool (%)
School Enrollment - Kindergarten (%)
School Enrollment - Grade 1 to 4 (%)
School Enrollment - Grade 5 to 8 (%)
School Enrollment - Grade 9 to 12 (%)
School Enrollment - College undergrad (%)
School Enrollment - Graduate or professional (%)
School Enrollment - Not enrolled in school (%)
School enrollment - Public schools (%)
School enrollment - Private schools (%)
School enrollment - Not enrolled (%)
Median number of rooms in houses and condos
Median number of rooms in apartments
Housing units lacking complete plumbing facilities (%)
Housing units lacking complete kitchen facilities (%)
Density of houses
Urban houses (%)
Rural houses (%)
Households with people 60 years and over (%)
Households with people 65 years and over (%)
Households with people 75 years and over (%)
Households with one or more nonrelatives (%)
Households with no nonrelatives (%)
Population in households (%)
Family households (%)
Nonfamily households (%)
Population in families (%)
Family households with own children (%)
Median number of bedrooms in owner occupied houses
Mean number of bedrooms in owner occupied houses
Median number of bedrooms in renter occupied houses
Mean number of bedrooms in renter occupied houses
Median number of vehichles in owner occupied houses
Mean number of vehichles in owner occupied houses
Median number of vehichles in renter occupied houses
Mean number of vehichles in renter occupied houses
Mortgage status - with mortgage (%)
Mortgage status - with second mortgage (%)
Mortgage status - with home equity loan (%)
Mortgage status - with both second mortgage and home equity loan (%)
Mortgage status - without a mortgage (%)
Average family size
Average family size - White
Average family size - Black or African American
Average family size - Asian
Average family size - Hispanic or Latino
Average family size - American Indian and Alaska Native
Average family size - Multirace
Average family size - Other Race
Geographical mobility - Same house 1 year ago (%)
Geographical mobility - Moved within same county (%)
Geographical mobility - Moved from different county within same state (%)
Geographical mobility - Moved from different state (%)
Geographical mobility - Moved from abroad (%)
Place of birth - Born in state of residence (%)
Place of birth - Born in other state (%)
Place of birth - Native, outside of US (%)
Place of birth - Foreign born (%)
Housing units in structures - 1, detached (%)
Housing units in structures - 1, attached (%)
Housing units in structures - 2 (%)
Housing units in structures - 3 or 4 (%)
Housing units in structures - 5 to 9 (%)
Housing units in structures - 10 to 19 (%)
Housing units in structures - 20 to 49 (%)
Housing units in structures - 50 or more (%)
Housing units in structures - Mobile home (%)
Housing units in structures - Boat, RV, van, etc. (%)
House/condo owner moved in on average (years ago)
Renter moved in on average (years ago)
Year householder moved into unit - Moved in 1999 to March 2000 (%)
Year householder moved into unit - Moved in 1995 to 1998 (%)
Year householder moved into unit - Moved in 1990 to 1994 (%)
Year householder moved into unit - Moved in 1980 to 1989 (%)
Year householder moved into unit - Moved in 1970 to 1979 (%)
Year householder moved into unit - Moved in 1969 or earlier (%)
Means of transportation to work - Drove car alone (%)
Means of transportation to work - Carpooled (%)
Means of transportation to work - Public transportation (%)
Means of transportation to work - Bus or trolley bus (%)
Means of transportation to work - Streetcar or trolley car (%)
Means of transportation to work - Subway or elevated (%)
Means of transportation to work - Railroad (%)
Means of transportation to work - Ferryboat (%)
Means of transportation to work - Taxicab (%)
Means of transportation to work - Motorcycle (%)
Means of transportation to work - Bicycle (%)
Means of transportation to work - Walked (%)
Means of transportation to work - Other means (%)
Working at home (%)
Industry diversity
Most Common Industries - Agriculture, forestry, fishing and hunting, and mining (%)
Most Common Industries - Agriculture, forestry, fishing and hunting (%)
Most Common Industries - Mining, quarrying, and oil and gas extraction (%)
Most Common Industries - Construction (%)
Most Common Industries - Manufacturing (%)
Most Common Industries - Wholesale trade (%)
Most Common Industries - Retail trade (%)
Most Common Industries - Transportation and warehousing, and utilities (%)
Most Common Industries - Transportation and warehousing (%)
Most Common Industries - Utilities (%)
Most Common Industries - Information (%)
Most Common Industries - Finance and insurance, and real estate and rental and leasing (%)
Most Common Industries - Finance and insurance (%)
Most Common Industries - Real estate and rental and leasing (%)
Most Common Industries - Professional, scientific, and management, and administrative and waste management services (%)
Most Common Industries - Professional, scientific, and technical services (%)
Most Common Industries - Management of companies and enterprises (%)
Most Common Industries - Administrative and support and waste management services (%)
Most Common Industries - Educational services, and health care and social assistance (%)
Most Common Industries - Educational services (%)
Most Common Industries - Health care and social assistance (%)
Most Common Industries - Arts, entertainment, and recreation, and accommodation and food services (%)
Most Common Industries - Arts, entertainment, and recreation (%)
Most Common Industries - Accommodation and food services (%)
Most Common Industries - Other services, except public administration (%)
Most Common Industries - Public administration (%)
Occupation diversity
Most Common Occupations - Management, business, science, and arts occupations (%)
Most Common Occupations - Management, business, and financial occupations (%)
Most Common Occupations - Management occupations (%)
Most Common Occupations - Business and financial operations occupations (%)
Most Common Occupations - Computer, engineering, and science occupations (%)
Most Common Occupations - Computer and mathematical occupations (%)
Most Common Occupations - Architecture and engineering occupations (%)
Most Common Occupations - Life, physical, and social science occupations (%)
Most Common Occupations - Education, legal, community service, arts, and media occupations (%)
Most Common Occupations - Community and social service occupations (%)
Most Common Occupations - Legal occupations (%)
Most Common Occupations - Education, training, and library occupations (%)
Most Common Occupations - Arts, design, entertainment, sports, and media occupations (%)
Most Common Occupations - Healthcare practitioners and technical occupations (%)
Most Common Occupations - Health diagnosing and treating practitioners and other technical occupations (%)
Most Common Occupations - Health technologists and technicians (%)
Most Common Occupations - Service occupations (%)
Most Common Occupations - Healthcare support occupations (%)
Most Common Occupations - Protective service occupations (%)
Most Common Occupations - Fire fighting and prevention, and other protective service workers including supervisors (%)
Most Common Occupations - Law enforcement workers including supervisors (%)
Most Common Occupations - Food preparation and serving related occupations (%)
Most Common Occupations - Building and grounds cleaning and maintenance occupations (%)
Most Common Occupations - Personal care and service occupations (%)
Most Common Occupations - Sales and office occupations (%)
Most Common Occupations - Sales and related occupations (%)
Most Common Occupations - Office and administrative support occupations (%)
Most Common Occupations - Natural resources, construction, and maintenance occupations (%)
Most Common Occupations - Farming, fishing, and forestry occupations (%)
Most Common Occupations - Construction and extraction occupations (%)
Most Common Occupations - Installation, maintenance, and repair occupations (%)
Most Common Occupations - Production, transportation, and material moving occupations (%)
Most Common Occupations - Production occupations (%)
Most Common Occupations - Transportation occupations (%)
Most Common Occupations - Material moving occupations (%)
People in Group quarters - Institutionalized population (%)
People in Group quarters - Correctional institutions (%)
People in Group quarters - Federal prisons and detention centers (%)
People in Group quarters - Halfway houses (%)
People in Group quarters - Local jails and other confinement facilities (including police lockups) (%)
People in Group quarters - Military disciplinary barracks (%)
People in Group quarters - State prisons (%)
People in Group quarters - Other types of correctional institutions (%)
People in Group quarters - Nursing homes (%)
People in Group quarters - Hospitals/wards, hospices, and schools for the handicapped (%)
People in Group quarters - Hospitals/wards and hospices for chronically ill (%)
People in Group quarters - Hospices or homes for chronically ill (%)
People in Group quarters - Military hospitals or wards for chronically ill (%)
People in Group quarters - Other hospitals or wards for chronically ill (%)
People in Group quarters - Hospitals or wards for drug/alcohol abuse (%)
People in Group quarters - Mental (Psychiatric) hospitals or wards (%)
People in Group quarters - Schools, hospitals, or wards for the mentally retarded (%)
People in Group quarters - Schools, hospitals, or wards for the physically handicapped (%)
People in Group quarters - Institutions for the deaf (%)
People in Group quarters - Institutions for the blind (%)
People in Group quarters - Orthopedic wards and institutions for the physically handicapped (%)
People in Group quarters - Wards in general hospitals for patients who have no usual home elsewhere (%)
People in Group quarters - Wards in military hospitals for patients who have no usual home elsewhere (%)
People in Group quarters - Juvenile institutions (%)
People in Group quarters - Long-term care (%)
People in Group quarters - Homes for abused, dependent, and neglected children (%)
People in Group quarters - Residential treatment centers for emotionally disturbed children (%)
People in Group quarters - Training schools for juvenile delinquents (%)
People in Group quarters - Short-term care, detention or diagnostic centers for delinquent children (%)
People in Group quarters - Type of juvenile institution unknown (%)
People in Group quarters - Noninstitutionalized population (%)
People in Group quarters - College dormitories (includes college quarters off campus) (%)
People in Group quarters - Military quarters (%)
People in Group quarters - On base (%)
People in Group quarters - Barracks, unaccompanied personnel housing (UPH), (Enlisted/Officer), ;and similar group living quarters for military personnel (%)
People in Group quarters - Transient quarters for temporary residents (%)
People in Group quarters - Military ships (%)
People in Group quarters - Group homes (%)
People in Group quarters - Homes or halfway houses for drug/alcohol abuse (%)
People in Group quarters - Homes for the mentally ill (%)
People in Group quarters - Homes for the mentally retarded (%)
People in Group quarters - Homes for the physically handicapped (%)
People in Group quarters - Other group homes (%)
People in Group quarters - Religious group quarters (%)
People in Group quarters - Dormitories (%)
People in Group quarters - Agriculture workers' dormitories on farms (%)
People in Group quarters - Job Corps and vocational training facilities (%)
People in Group quarters - Other workers' dormitories (%)
People in Group quarters - Crews of maritime vessels (%)
People in Group quarters - Other nonhousehold living situations (%)
People in Group quarters - Other noninstitutional group quarters (%)
Residents speaking English at home (%)
Residents speaking English at home - Born in the United States (%)
Residents speaking English at home - Native, born elsewhere (%)
Residents speaking English at home - Foreign born (%)
Residents speaking Spanish at home (%)
Residents speaking Spanish at home - Born in the United States (%)
Residents speaking Spanish at home - Native, born elsewhere (%)
Residents speaking Spanish at home - Foreign born (%)
Residents speaking other language at home (%)
Residents speaking other language at home - Born in the United States (%)
Residents speaking other language at home - Native, born elsewhere (%)
Residents speaking other language at home - Foreign born (%)
Class of Workers - Employee of private company (%)
Class of Workers - Self-employed in own incorporated business (%)
Class of Workers - Private not-for-profit wage and salary workers (%)
Class of Workers - Local government workers (%)
Class of Workers - State government workers (%)
Class of Workers - Federal government workers (%)
Class of Workers - Self-employed workers in own not incorporated business and Unpaid family workers (%)
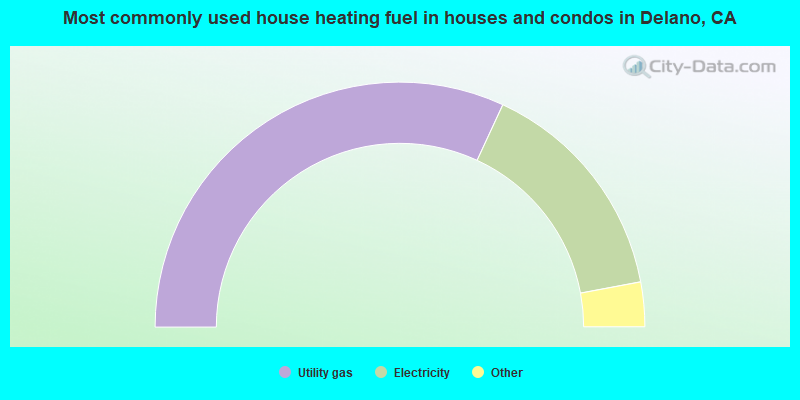
House heating fuel used in houses and condos - Utility gas (%)
House heating fuel used in houses and condos - Bottled, tank, or LP gas (%)
House heating fuel used in houses and condos - Electricity (%)
House heating fuel used in houses and condos - Fuel oil, kerosene, etc. (%)
House heating fuel used in houses and condos - Coal or coke (%)
House heating fuel used in houses and condos - Wood (%)
House heating fuel used in houses and condos - Solar energy (%)
House heating fuel used in houses and condos - Other fuel (%)
House heating fuel used in houses and condos - No fuel used (%)
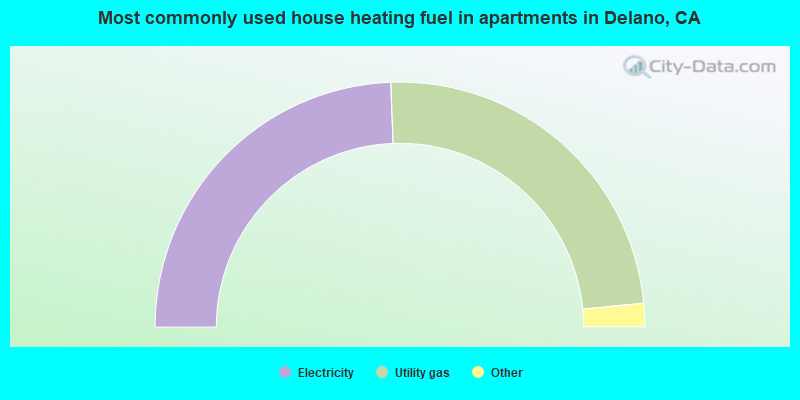
House heating fuel used in apartments - Utility gas (%)
House heating fuel used in apartments - Bottled, tank, or LP gas (%)
House heating fuel used in apartments - Electricity (%)
House heating fuel used in apartments - Fuel oil, kerosene, etc. (%)
House heating fuel used in apartments - Coal or coke (%)
House heating fuel used in apartments - Wood (%)
House heating fuel used in apartments - Solar energy (%)
House heating fuel used in apartments - Other fuel (%)
House heating fuel used in apartments - No fuel used (%)
Armed forces status - In Armed Forces (%)
Armed forces status - Civilian (%)
Armed forces status - Civilian - Veteran (%)
Armed forces status - Civilian - Nonveteran (%)
Fatal accidents locations in years 2005-2021
Fatal accidents locations in 2005
Fatal accidents locations in 2006
Fatal accidents locations in 2007
Fatal accidents locations in 2008
Fatal accidents locations in 2009
Fatal accidents locations in 2010
Fatal accidents locations in 2011
Fatal accidents locations in 2012
Fatal accidents locations in 2013
Fatal accidents locations in 2014
Fatal accidents locations in 2015
Fatal accidents locations in 2016
Fatal accidents locations in 2017
Fatal accidents locations in 2018
Fatal accidents locations in 2019
Fatal accidents locations in 2020
Fatal accidents locations in 2021
Alcohol use - People drinking some alcohol every month (%)
Alcohol use - People not drinking at all (%)
Alcohol use - Average days/month drinking alcohol
Alcohol use - Average drinks/week
Alcohol use - Average days/year people drink much
Audiometry - Average condition of hearing (%)
Audiometry - People that can hear a whisper from across a quiet room (%)
Audiometry - People that can hear normal voice from across a quiet room (%)
Audiometry - Ears ringing, roaring, buzzing (%)
Audiometry - Had a job exposure to loud noise (%)
Audiometry - Had off-work exposure to loud noise (%)
Blood Pressure & Cholesterol - Has high blood pressure (%)
Blood Pressure & Cholesterol - Checking blood pressure at home (%)
Blood Pressure & Cholesterol - Frequently checking blood cholesterol (%)
Blood Pressure & Cholesterol - Has high cholesterol level (%)
Consumer Behavior - Money monthly spent on food at supermarket/grocery store
Consumer Behavior - Money monthly spent on food at other stores
Consumer Behavior - Money monthly spent on eating out
Consumer Behavior - Money monthly spent on carryout/delivered foods
Consumer Behavior - Income spent on food at supermarket/grocery store (%)
Consumer Behavior - Income spent on food at other stores (%)
Consumer Behavior - Income spent on eating out (%)
Consumer Behavior - Income spent on carryout/delivered foods (%)
Current Health Status - General health condition (%)
Current Health Status - Blood donors (%)
Current Health Status - Has blood ever tested for HIV virus (%)
Current Health Status - Left-handed people (%)
Dermatology - People using sunscreen (%)
Diabetes - Diabetics (%)
Diabetes - Had a blood test for high blood sugar (%)
Diabetes - People taking insulin (%)
Diet Behavior & Nutrition - Diet health (%)
Diet Behavior & Nutrition - Milk product consumption (# of products/month)
Diet Behavior & Nutrition - Meals not home prepared (#/week)
Diet Behavior & Nutrition - Meals from fast food or pizza place (#/week)
Diet Behavior & Nutrition - Ready-to-eat foods (#/month)
Diet Behavior & Nutrition - Frozen meals/pizza (#/month)
Drug Use - People that ever used marijuana or hashish (%)
Drug Use - Ever used hard drugs (%)
Drug Use - Ever used any form of cocaine (%)
Drug Use - Ever used heroin (%)
Drug Use - Ever used methamphetamine (%)
Health Insurance - People covered by health insurance (%)
Kidney Conditions-Urology - Avg. # of times urinating at night
Medical Conditions - People with asthma (%)
Medical Conditions - People with anemia (%)
Medical Conditions - People with psoriasis (%)
Medical Conditions - People with overweight (%)
Medical Conditions - Elderly people having difficulties in thinking or remembering (%)
Medical Conditions - People who ever received blood transfusion (%)
Medical Conditions - People having trouble seeing even with glass/contacts (%)
Medical Conditions - People with arthritis (%)
Medical Conditions - People with gout (%)
Medical Conditions - People with congestive heart failure (%)
Medical Conditions - People with coronary heart disease (%)
Medical Conditions - People with angina pectoris (%)
Medical Conditions - People who ever had heart attack (%)
Medical Conditions - People who ever had stroke (%)
Medical Conditions - People with emphysema (%)
Medical Conditions - People with thyroid problem (%)
Medical Conditions - People with chronic bronchitis (%)
Medical Conditions - People with any liver condition (%)
Medical Conditions - People who ever had cancer or malignancy (%)
Mental Health - People who have little interest in doing things (%)
Mental Health - People feeling down, depressed, or hopeless (%)
Mental Health - People who have trouble sleeping or sleeping too much (%)
Mental Health - People feeling tired or having little energy (%)
Mental Health - People with poor appetite or overeating (%)
Mental Health - People feeling bad about themself (%)
Mental Health - People who have trouble concentrating on things (%)
Mental Health - People moving or speaking slowly or too fast (%)
Mental Health - People having thoughts they would be better off dead (%)
Oral Health - Average years since last visit a dentist
Oral Health - People embarrassed because of mouth (%)
Oral Health - People with gum disease (%)
Oral Health - General health of teeth and gums (%)
Oral Health - Average days a week using dental floss/device
Oral Health - Average days a week using mouthwash for dental problem
Oral Health - Average number of teeth
Pesticide Use - Households using pesticides to control insects (%)
Pesticide Use - Households using pesticides to kill weeds (%)
Physical Activity - People doing vigorous-intensity work activities (%)
Physical Activity - People doing moderate-intensity work activities (%)
Physical Activity - People walking or bicycling (%)
Physical Activity - People doing vigorous-intensity recreational activities (%)
Physical Activity - People doing moderate-intensity recreational activities (%)
Physical Activity - Average hours a day doing sedentary activities
Physical Activity - Average hours a day watching TV or videos
Physical Activity - Average hours a day using computer
Physical Functioning - People having limitations keeping them from working (%)
Physical Functioning - People limited in amount of work they can do (%)
Physical Functioning - People that need special equipment to walk (%)
Physical Functioning - People experiencing confusion/memory problems (%)
Physical Functioning - People requiring special healthcare equipment (%)
Prescription Medications - Average number of prescription medicines taking
Preventive Aspirin Use - Adults 40+ taking low-dose aspirin (%)
Reproductive Health - Vaginal deliveries (%)
Reproductive Health - Cesarean deliveries (%)
Reproductive Health - Deliveries resulted in a live birth (%)
Reproductive Health - Pregnancies resulted in a delivery (%)
Reproductive Health - Women breastfeeding newborns (%)
Reproductive Health - Women that had a hysterectomy (%)
Reproductive Health - Women that had both ovaries removed (%)
Reproductive Health - Women that have ever taken birth control pills (%)
Reproductive Health - Women taking birth control pills (%)
Reproductive Health - Women that have ever used Depo-Provera or injectables (%)
Reproductive Health - Women that have ever used female hormones (%)
Sexual Behavior - People 18+ that ever had sex (vaginal, anal, or oral) (%)
Sexual Behavior - Males 18+ that ever had vaginal sex with a woman (%)
Sexual Behavior - Males 18+ that ever performed oral sex on a woman (%)
Sexual Behavior - Males 18+ that ever had anal sex with a woman (%)
Sexual Behavior - Males 18+ that ever had any sex with a man (%)
Sexual Behavior - Females 18+ that ever had vaginal sex with a man (%)
Sexual Behavior - Females 18+ that ever performed oral sex on a man (%)
Sexual Behavior - Females 18+ that ever had anal sex with a man (%)
Sexual Behavior - Females 18+ that ever had any kind of sex with a woman (%)
Sexual Behavior - Average age people first had sex
Sexual Behavior - Average number of female sex partners in lifetime (males 18+)
Sexual Behavior - Average number of female vaginal sex partners in lifetime (males 18+)
Sexual Behavior - Average age people first performed oral sex on a woman (18+)
Sexual Behavior - Average number of woman performed oral sex on in lifetime (18+)
Sexual Behavior - Average number of male sex partners in lifetime (males 18+)
Sexual Behavior - Average number of male anal sex partners in lifetime (males 18+)
Sexual Behavior - Average age people first performed oral sex on a man (18+)
Sexual Behavior - Average number of male oral sex partners in lifetime (18+)
Sexual Behavior - People using protection when performing oral sex (%)
Sexual Behavior - Average number of times people have vaginal or anal sex a year
Sexual Behavior - People having sex without condom (%)
Sexual Behavior - Average number of male sex partners in lifetime (females 18+)
Sexual Behavior - Average number of male vaginal sex partners in lifetime (females 18+)
Sexual Behavior - Average number of female sex partners in lifetime (females 18+)
Sexual Behavior - Circumcised males 18+ (%)
Sleep Disorders - Average hours sleeping at night
Sleep Disorders - People that has trouble sleeping (%)
Smoking-Cigarette Use - People smoking cigarettes (%)
Taste & Smell - People 40+ having problems with smell (%)
Taste & Smell - People 40+ having problems with taste (%)
Taste & Smell - People 40+ that ever had wisdom teeth removed (%)
Taste & Smell - People 40+ that ever had tonsils teeth removed (%)
Taste & Smell - People 40+ that ever had a loss of consciousness because of a head injury (%)
Taste & Smell - People 40+ that ever had a broken nose or other serious injury to face or skull (%)
Taste & Smell - People 40+ that ever had two or more sinus infections (%)
Weight - Average height (inches)
Weight - Average weight (pounds)
Weight - Average BMI
Weight - People that are obese (%)
Weight - People that ever were obese (%)
Weight - People trying to lose weight (%)
39,628 77.7% Hispanic 7,738 15.2% Asian alone 2,472 4.8% White alone 2,085 4.1% Black alone 341 0.7% Two or more races 79 0.2% American Indian alone 55 0.1% Other race alone 20 0.04% Native Hawaiian and Other
According to our research of California and other state lists, there were 52 registered sex offenders living in Delano, California as of May 09, 2024 . The ratio of all residents to sex offenders in Delano is 1,026 to 1.The ratio of registered sex offenders to all residents in this city is lower than the state average.
The City-Data.com crime index weighs serious crimes and violent crimes more heavily. Higher means more crime, U.S. average is 246.1. It adjusts for the number of visitors and daily workers commuting into cities.
- means the value is smaller than the state average.
- means the value is about the same as the state average.
- means the value is bigger than the state average.
- means the value is much bigger than the state average.
Crime rate in Delano detailed stats: murders, rapes, robberies, assaults, burglaries, thefts, arson Officers per 1,000 residents here:
0.87California average:
2.30
Latest news from Delano, CA collected exclusively by city-data.com from local newspapers, TV, and radio stations
Current Local Time:
Land area: 10.1 square miles.
Population density: 5,032 people per square mile (average).
17,841 residents are foreign born (25.2% Latin America , 10.1% Asia ).
This city:
35.0%California:
26.5%
Median real estate property taxes paid for housing units with mortgages in 2022: $2,029 (0.7%)Median real estate property taxes paid for housing units with no mortgage in 2022: $1,410 (0.6%)
Nearest city with pop. 50,000+: Bakersfield, CA
Nearest city with pop. 1,000,000+: Los Angeles, CA
Nearest cities:
Rodriguez Camp, CA (2.6 miles),
Latitude: 35.77 N, Longitude: 119.25 W
Daytime population change due to commuting: -473 (-0.9%)Workers who live and work in this city: 8,615 (45.6%)
Property values in Delano, CA
Single-family new house construction building permits:
2022: 21 buildings , average cost: $192,0002021: 28 buildings , average cost: $192,7002020: 83 buildings , average cost: $178,4002019: 70 buildings , average cost: $179,1002018: 111 buildings , average cost: $161,2002017: 67 buildings , average cost: $172,1002016: 34 buildings , average cost: $218,9002015: 4 buildings , average cost: $98,5002014: 4 buildings , average cost: $95,6002013: 44 buildings , average cost: $114,9002012: 22 buildings , average cost: $94,0002011: 30 buildings , average cost: $93,3002010: 17 buildings , average cost: $104,2002009: 11 buildings , average cost: $87,8002008: 46 buildings , average cost: $122,6002007: 130 buildings , average cost: $140,7002006: 99 buildings , average cost: $143,2002005: 372 buildings , average cost: $122,9002004: 260 buildings , average cost: $117,8002003: 228 buildings , average cost: $103,7002002: 185 buildings , average cost: $101,7002001: 193 buildings , average cost: $94,5002000: 159 buildings , average cost: $92,5001999: 145 buildings , average cost: $91,5001998: 213 buildings , average cost: $89,6001997: 203 buildings , average cost: $85,000Unemployment in December 2023: Here:
22.7%California:
5.1%
Population change in the 1990s: +15,549 (+66.8%).
Most common occupations in Delano, CA (%)
Both Males Females
Agricultural workers, including supervisors (25.8%)
Other production occupations, including supervisors (5.4%)
Cashiers (4.1%)
Laborers and material movers, hand (3.8%)
Driver/sales workers and truck drivers (3.2%)
Building and grounds cleaning and maintenance occupations (3.0%)
Material recording, scheduling, dispatching, and distributing workers (3.0%)
Agricultural workers, including supervisors (30.2%)
Other production occupations, including supervisors (6.1%)
Driver/sales workers and truck drivers (5.5%)
Laborers and material movers, hand (4.7%)
Law enforcement workers, including supervisors (4.1%)
Building and grounds cleaning and maintenance occupations (3.8%)
Farmers and farm managers (3.5%)
Agricultural workers, including supervisors (20.0%)
Cashiers (6.7%)
Nursing, psychiatric, and home health aides (5.9%)
Other office and administrative support workers, including supervisors (5.0%)
Other teachers, instructors, education, training, and library occupations (4.8%)
Other production occupations, including supervisors (4.6%)
Information and record clerks, except customer service representatives (3.6%)
Earthquake activity:
Delano-area historical earthquake activity is significantly above California state average. It is 8283% greater than the overall U.S. average. On 7/21/1952 at 11:52:14, a magnitude 7.7 (7.7 UK, Class: Major, Intensity: VIII - XII) earthquake occurred 55.0 miles away from Delano center, causing $50,000,000 total damage On 11/4/1927 at 13:51:53, a magnitude 7.5 (7.5 UK) earthquake occurred 116.8 miles away from Delano center On 4/18/1906 at 13:12:21, a magnitude 7.9 (7.9 UK) earthquake occurred 258.7 miles away from Delano center, causing $524,000,000 total damage On 6/28/1992 at 11:57:34, a magnitude 7.6 (6.2 MB, 7.6 MS, 7.3 MW, Depth: 0.7 mi) earthquake occurred 188.9 miles away from the city center, causing 3 deaths ( 1 shaking deaths, 2 other deaths) and 400 injuries, causing $100,000,000 total damage and $40,000,000 insured lossesOn 10/16/1999 at 09:46:44, a magnitude 7.4 (6.3 MB, 7.4 MS, 7.2 MW, 7.3 ML) earthquake occurred 181.1 miles away from Delano center On 5/2/1983 at 23:42:37, a magnitude 6.7 (6.2 MB, 6.5 MS, 6.5 MW, 6.7 ML, Class: Strong, Intensity: VII - IX) earthquake occurred 66.8 miles away from the city center, causing $31,000,000 total damage Magnitude types: body-wave magnitude (MB), local magnitude (ML), surface-wave magnitude (MS), moment magnitude (MW) Natural disasters: The number of natural disasters in Kern County (29) is a lot greater than the US average (15).Major Disasters (Presidential) Declared: 14Emergencies Declared: 3Fires: 12, Floods: 12, Storms: 7, Winter Storms: 5, Mudslides: 4, Landslides: 3, Freezes: 2, Drought: 1, Heavy Rain: 1, Hurricane: 1, Snow: 1, Tornado: 1, Wind: 1, Other: 1 (Note: some incidents may be assigned to more than one category). Hospitals and medical centers in Delano: DELANO REGIONAL MEDICAL CENTER (Proprietary, provides emergency services, 1401 GARCES HIGHWAY) KELLY AND SCOTT'S CARE HOME (2212 5TH DRIVE) KELLY AND SCOTT'S CARE HOME INC #2 (1324 5TH PLACE) POSITIVE DIRECTIONS #8 (1755 MAIN STREET) BROWNING MANOR CONVALESCENT HOSPITAL (729 BROWNING ROAD)
DELANO DISTRICT SKILLED NURSING FACILITY (1509 TOKAY STREET)
DELANO DIALYSIS (905 MAIN STREET)
Amtrak station near Delano: 14 miles: WASCO (700 G ST.) Services: fully wheelchair accessible.
Colleges/universities with over 2000 students nearest to Delano:
Porterville College (about 24 miles; Porterville, CA ; Full-time enrollment: 2,560)
Bakersfield College (about 30 miles; Bakersfield, CA ; FT enrollment: 10,325)
California State University-Bakersfield (about 31 miles; Bakersfield, CA ; FT enrollment: 7,564)
College of the Sequoias (about 39 miles; Visalia, CA ; FT enrollment: 6,982)
San Joaquin Valley College-Visalia (about 40 miles; Visalia, CA ; FT enrollment: 2,386)
Taft College (about 45 miles; Taft, CA ; FT enrollment: 2,121)
West Hills College-Lemoore (about 49 miles; Lemoore, CA ; FT enrollment: 2,314)
Public high schools in Delano: DELANO HIGH Students: 1,369, Location: 1331 CECIL AVE., Grades: 9-12)CESAR E. CHAVEZ HIGH Students: 1,100, Location: 800 BROWNING RD., Grades: 9-12)ROBERT F. KENNEDY HIGH Students: 484, Location: 1401 HIETT AVE., Grades: 9-12)PARAMOUNT ACADEMY Students: 99, Location: 1942 RANDOLPH ST., Grades: 6-12, Charter school )VALLEY HIGH Students: 62, Location: 1927 RANDOLPH ST., Grades: 9-12)Private high school in Delano: SEQUOIA CHRISTIAN ACADEMY Students: 17, Location: 1213 12TH AVE, Grades: TK-10)
Biggest public elementary/middle schools in Delano: ALMOND TREE MIDDLE Students: 736, Location: 200 W. 15TH AVE., Grades: 6-8)CECIL AVENUE MATH AND SCIENCE ACADEMY Students: 732, Location: 1430 CECIL AVE., Grades: 6-8, Charter school )LA VINA MIDDLE Students: 647, Location: 1331 BROWNING RD., Grades: 6-8)MORNINGSIDE Students: 411, Location: 2100 SUMMER DR., Grades: KG-5)HARVEST ELEMENTARY Students: 361, Location: 1320 VASSAR AVE., Grades: KG-5)PRINCETON STREET ELEMENTARY Students: 358, Location: 1959 PRINCETON ST., Grades: KG-5)ALBANY PARK ELEMENTARY Students: 314, Location: 235 W. 20TH AVE., Grades: KG-5)TERRACE ELEMENTARY Students: 313, Location: 1999 NORWALK ST., Grades: KG-5)COLUMBINE ELEMENTARY Students: 152, Location: 2240 RD. 160, Grades: KG-8)NUEVA VISTA LANGUAGE ACADEMY Students: 124, Location: 120 GARCES HWY., Grades: KG-5, Charter school )See full list of schools located in Delano User-submitted facts and corrections:
Delano has a new comprehensive public High School: Cesar E. Chavez High School (Established 2003). This school year (2003-2004), it currently holds two classes (9th and 10th), but in two years, it will be a 4 year high school (9th through 12th). It currently has over 1000 students, but can hold around 2000. Their website is http://www.cesarchavezhighschool.org for more information.
Notable locations in Delano: (A) , Delano Ambulance (B) , North Kern State Prison Fire Department (C) , Kern County Building (D) , Heritage Park Museum (E) , Kern County Fire Department Station 37 Delano West (F) , Delano Community Center (G) , Kern County Fire Department Station 34 Delano (H) , Delano Union Elementary School District Office (I) , Delano Joint Union High School District Office (J) , Delano Chamber of Commerce (K) , Delano Branch Kern County Library (L) , Civic Center Hall (M) , Charlotte Chichester Auditorium (N) . Display/hide their locations on the map
Shopping Centers: (1) , Randolph Village Shopping Center (2) , Cecil Plaza Shopping Center (3) . Display/hide their locations on the map
Churches in Delano include: (A) , Immanuel Baptist Church (B) , Saint Marys Church (C) , Advent Christian Church (D) , Apostolic Church (E) , Bethel Chapel Filipino Assembly of God Church (F) , Calvary Pentecostal Holiness of God Church (G) , Christian Alliance Church (H) , Church of Christ (I) . Display/hide their locations on the map
Cemetery: (1) . Display/hide its location on the map
Parks in Delano include: (1) , Cesar Chavez Park (2) , Filipino Community Council Recreation Center (3) , Frederick Field (4) , Heritage Park (5) , Jefferson Park (6) , Kalibo Park (7) , Memorial Park (8) , Memorial Stadium (9) . Display/hide their locations on the map
Tourist attraction:
Hotel:
Birthplace of: Luis Valdez - Film director, Steve Cox - Baseball player.
Kern County has a predicted average indoor radon screening level between 2 and 4 pCi/L (pico curies per liter) - Moderate Potential Drinking water stations with addresses in Delano and their reported violations in the past:
AGBAYANI VILLAGE WATER SYSTEM (Population served: 168, Groundwater):
Past health violations:
MCL, Monthly (TCR) - In AUG-2005, Contaminant: Coliform. Follow-up actions: St AO (w/o penalty) issued (MAR-06-2006)
Past monitoring violations:
Follow-up Or Routine LCR Tap M/R - In OCT-01-2010, Contaminant: Lead and Copper Rule. Follow-up actions: St Violation/Reminder Notice (FEB-13-2013)
Drinking water stations with addresses in Delano that have no violations reported:
JAKOV DULCICH & SONS WATER SYSTEM (Population served: 40, Primary Water Source Type: Groundwater)
LUCICH FARMS COLD STORAGE LLC WATER SYS. (Population served: 25, Primary Water Source Type: Groundwater)
Average household size: This city:
4.1 peopleCalifornia:
2.9 people
Percentage of family households: This city:
87.2%Whole state:
68.7%
Percentage of households with unmarried partners: This city:
8.7%Whole state:
7.2%
Likely homosexual households (counted as self-reported same-sex unmarried-partner households)
Lesbian couples: 0.3% of all households Gay men: 0.3% of all households
People in group quarters in Delano in 2010:
10,530 people in state prisons
189 people in nursing facilities/skilled-nursing facilities
124 people in college/university student housing
28 people in group homes intended for adults
12 people in residential treatment centers for adults
9 people in workers' group living quarters and job corps centers
5 people in other noninstitutional facilities
People in group quarters in Delano in 2000:
4,805 people in state prisons
177 people in nursing homes
39 people in homes for the mentally retarded
20 people in homes for the mentally ill
13 people in homes for the physically handicapped
3 people in other noninstitutional group quarters
Banks with branches in Delano (2011 data):
Citizens Business Bank: Delano Branch at 1613 Inyo Street, branch established on 1997/01/27. Info updated 2011/03/30: Bank assets: $6,475.4 mil, Deposits: $4,625.6 mil, headquarters in Ontario, CA, positive income , Commercial Lending Specialization, 46 total offices , Holding Company: Cvb Financial Corp.
Wells Fargo Bank, National Association: Delano Branch at 920 11th Street, branch established on 1964/12/15. Info updated 2011/04/05: Bank assets: $1,161,490.0 mil, Deposits: $905,653.0 mil, headquarters in Sioux Falls, SD, positive income , 6395 total offices , Holding Company: Wells Fargo & Company
Finance and Thrift Company: Delano Branch at 1202 Main Street, branch established on 1945/01/01. Info updated 2010/02/16: Bank assets: $129.7 mil, Deposits: $98.5 mil, headquarters in Porterville, CA, positive income , Consumer Lending Specialization, 9 total offices
Union Bank, National Association: Delano Branch at 1308 Main Street, branch established on 1958/08/11. Info updated 2011/09/01: Bank assets: $88,967.5 mil, Deposits: $65,286.4 mil, headquarters in San Francisco, CA, positive income , Commercial Lending Specialization, 403 total offices , Holding Company: Mitsubishi Ufj Financial Group, Inc.
Bank of America, National Association: Delano Branch at 1211 Main Street, branch established on 1955/06/20. Info updated 2009/11/18: Bank assets: $1,451,969.3 mil, Deposits: $1,077,176.8 mil, headquarters in Charlotte, NC, positive income , 5782 total offices , Holding Company: Bank Of America Corporation
JPMorgan Chase Bank, National Association: Delano Branch at 917 Main Street, branch established on 1954/12/01. Info updated 2011/11/10: Bank assets: $1,811,678.0 mil, Deposits: $1,190,738.0 mil, headquarters in Columbus, OH, positive income , International Specialization, 5577 total offices , Holding Company: Jpmorgan Chase & Co.
Bank of the Sierra: Delano Branch at 1126 Main Street, branch established on 2007/03/14. Info updated 2006/11/03: Bank assets: $1,332.3 mil, Deposits: $1,091.7 mil, headquarters in Porterville, CA, positive income , Commercial Lending Specialization, 26 total offices , Holding Company: Sierra Bancorp
For population 15 years and over in Delano:
Never married: 44.2%Now married: 43.5%Separated: 2.8%Widowed: 4.1%Divorced: 5.4% For population 25 years and over in Delano:
High school or higher: 62.9%Bachelor's degree or higher: 8.3%Graduate or professional degree: 1.7%Unemployed: 30.3%Mean travel time to work (commute): 20.1 minutes
Education Gini index (Inequality in education) Here:
20.4California average:
15.5
Religion statistics for Delano, CA (based on Kern County data)
Religion Adherents Congregations Catholic 245,836 30 Evangelical Protestant 114,724 436 Other 30,687 83 Mainline Protestant 7,459 38 Black Protestant 4,026 25 Orthodox 450 3 None 436,449 -
Source: Clifford Grammich, Kirk Hadaway, Richard Houseal, Dale E.Jones, Alexei Krindatch, Richie Stanley and Richard H.Taylor. 2012. 2010 U.S.Religion Census: Religious Congregations & Membership Study. Association of Statisticians of American Religious Bodies. Jones, Dale E., et al. 2002. Congregations and Membership in the United States 2000. Nashville, TN: Glenmary Research Center. Graphs represent county-level data
Food Environment Statistics: Number of grocery stores : 190Kern County :
2.41 / 10,000 pop.State :
2.14 / 10,000 pop.
Number of supercenters and club stores : 3This county :
0.04 / 10,000 pop.California :
0.04 / 10,000 pop.
Number of convenience stores (no gas) : 63Kern County :
0.80 / 10,000 pop.California :
0.62 / 10,000 pop.
Number of convenience stores (with gas) : 165Kern County :
2.10 / 10,000 pop.California :
1.49 / 10,000 pop.
Number of full-service restaurants : 362Kern County :
4.60 / 10,000 pop.California :
7.42 / 10,000 pop.
Adult diabetes rate : This county :
8.0%State :
7.3%
Adult obesity rate : Kern County :
29.4%California :
21.3%
Low-income preschool obesity rate : Kern County :
15.9%California :
17.9%
Health and Nutrition: Healthy diet rate : This city:
46.7%California:
49.4%
Average overall health of teeth and gums : Here:
44.4%California:
48.0%
People feeling badly about themselves : This city:
21.5%California:
20.2%
People not drinking alcohol at all : This city:
12.4%State:
11.2%
Average hours sleeping at night : Overweight people : This city:
27.2%California:
31.5%
General health condition : Delano:
53.9%California:
56.4%
Average condition of hearing : More about Health and Nutrition of Delano, CA Residents
Local government employment and payroll (March 2022)
Function
Full-time employees
Monthly full-time payroll
Average yearly full-time wage
Part-time employees
Monthly part-time payroll
Police Protection - Officers
124 $796,129 $77,045 0 $0 Police - Other
23 $92,350 $48,183 0 $0 Water Supply
23 $126,190 $65,838 0 $0 Parks and Recreation
18 $74,287 $49,525 11 $5,954 Solid Waste Management
16 $74,899 $56,174 0 $0 Transit
16 $28,321 $21,241 2 $2,914 Other Government Administration
16 $87,627 $65,720 0 $0 Other and Unallocable
14 $70,253 $60,217 1 $2,530 Sewerage
12 $63,854 $63,854 0 $0 Financial Administration
8 $56,889 $85,334 0 $0 Streets and Highways
7 $77,338 $132,579 0 $0 Health
4 $19,567 $58,701 0 $0 Airports
1 $4,049 $48,588 0 $0
Totals for Government
282 $1,571,753 $66,883 14 $11,398
Delano government finances - Expenditure in 2017 (per resident):
Construction - Housing and Community Development: $511,000 ($10.05)
Regular Highways: $295,000 ($5.80)Current Operations - General - Other: $10,987,000 ($216.10)
Police Protection: $8,927,000 ($175.58)Water Utilities: $5,282,000 ($103.89)Central Staff Services: $4,750,000 ($93.42)Transit Utilities: $3,405,000 ($66.97)Sewerage: $2,404,000 ($47.28)Solid Waste Management: $2,233,000 ($43.92)Parks and Recreation: $2,098,000 ($41.26)Local Fire Protection: $1,884,000 ($37.06)Regular Highways: $1,794,000 ($35.29)Financial Administration: $706,000 ($13.89)Air Transportation: $529,000 ($10.40)Housing and Community Development: $431,000 ($8.48)Protective Inspection and Regulation - Other: $321,000 ($6.31)Health - Other: $19,000 ($0.37)General - Interest on Debt: $1,754,000 ($34.50)
Other Capital Outlay - Police Protection: $1,621,000 ($31.88)
Regular Highways: $1,097,000 ($21.58)Water Utilities: $539,000 ($10.60)Transit Utilities: $89,000 ($1.75)General - Other: $53,000 ($1.04)Solid Waste Management: $34,000 ($0.67)Central Staff Services: $29,000 ($0.57)Air Transportation: $27,000 ($0.53)Housing and Community Development: $21,000 ($0.41)Parking Facilities: $12,000 ($0.24)Parks and Recreation: $11,000 ($0.22)Sewerage: $10,000 ($0.20)Total Salaries and Wages: $697,000 ($13.71)
Water Utilities - Interest on Debt: $46,000 ($0.90)
Delano government finances - Revenue in 2017 (per resident):
Charges - Other: $17,798,000 ($350.06)
Sewerage: $6,588,000 ($129.58)Solid Waste Management: $3,521,000 ($69.25)Air Transportation: $365,000 ($7.18)Regular Highways: $274,000 ($5.39)Parks and Recreation: $109,000 ($2.14)Federal Intergovernmental - Transit Utilities: $1,029,000 ($20.24)
Housing and Community Development: $544,000 ($10.70)Air Transportation: $218,000 ($4.29)Other: $165,000 ($3.25)Local Intergovernmental - Transit Utilities: $1,445,000 ($28.42)
Other: $59,000 ($1.16)Miscellaneous - Special Assessments: $1,453,000 ($28.58)
Interest Earnings: $598,000 ($11.76)General Revenue - Other: $420,000 ($8.26)Rents: $361,000 ($7.10)Fines and Forfeits: $276,000 ($5.43)Donations From Private Sources: $22,000 ($0.43)Revenue - Water Utilities: $8,757,000 ($172.24)
Transit Utilities: $299,000 ($5.88)State Intergovernmental - Other: $2,782,000 ($54.72)
Highways: $967,000 ($19.02)Transit Utilities: $107,000 ($2.10)Sewerage: $20,000 ($0.39)General Local Government Support: $18,000 ($0.35)Tax - General Sales and Gross Receipts: $12,015,000 ($236.32)
Property: $9,728,000 ($191.33)Public Utilities Sales: $789,000 ($15.52)Other License: $368,000 ($7.24)Other Selective Sales: $338,000 ($6.65)Occupation and Business License - Other: $171,000 ($3.36)Other: $132,000 ($2.60)Documentary and Stock Transfer: $35,000 ($0.69)
Delano government finances - Debt in 2017 (per resident):
Long Term Debt - Beginning Outstanding - Unspecified Public Purpose: $67,893,000 ($1335.35)
Outstanding Unspecified Public Purpose: $65,213,000 ($1282.63)Retired Unspecified Public Purpose: $3,973,000 ($78.14)Issue, Unspecified Public Purpose: $1,293,000 ($25.43)
Delano government finances - Cash and Securities in 2017 (per resident):
Bond Funds - Cash and Securities: $623,000 ($12.25)
Other Funds - Cash and Securities: $54,678,000 ($1075.43)
Sinking Funds - Cash and Securities: $6,484,000 ($127.53)
4.83% of this county's 2021 resident taxpayers lived in other counties in 2020 ($47,246 average adjusted gross income )
Here:
4.83%California average:
5.19%
0.03% of residents moved from foreign countries ($334 average AGI )Kern County:
0.03%California average:
0.03%
Top counties from which taxpayers relocated into this county between 2020 and 2021:
4.56% of this county's 2020 resident taxpayers moved to other counties in 2021 ($61,654 average adjusted gross income )
Here:
4.56%California average:
6.14%
0.03% of residents moved to foreign countries ($342 average AGI )Kern County:
0.03%California average:
0.02%
Top counties to which taxpayers relocated from this county between 2020 and 2021:
Businesses in Delano, CA
Name Count Name Count
99 Cents Only Stores 1 Kmart 1 AT&T 1 Little Caesars Pizza 1 Ace Hardware 1 McDonald's 1 AutoZone 1 Nike 2 Best Western 1 Payless 1 Blockbuster 1 Pizza Hut 1 Burger King 1 Quiznos 1 Chevrolet 1 RadioShack 1 DHL 1 Rite Aid 1 Dennys 1 Rodeway Inn 1 Domino's Pizza 1 Sears 1 FedEx 2 Starbucks 1 GNC 1 Subway 4 Goodwill 1 T-Mobile 2 H&R Block 2 Taco Bell 1 Holiday Inn 1 True Value 2 Home Depot 1 U-Haul 3 JCPenney 1 UPS 2 Jack In The Box 1 Vans 1 KFC 1
Strongest AM radio stations in Delano:
KERI (1180 AM; 50 kW; WASCO-GREENACRES, CA; Owner: KWSO, INC.)
KCHJ (1010 AM; 5 kW; DELANO, CA; Owner: ILLINOIS LOTUS CORP.)
KWRU (940 AM; 50 kW; FRESNO, CA)
KMJ (580 AM; 50 kW; FRESNO, CA; Owner: INFINITY RADIO OPERATIONS INC.)
KNZR (1560 AM; 25 kW; BAKERSFIELD, CA; Owner: BUCKLEY BROADCASTING CORP. OF CALIF.)
KGDP (660 AM; 50 kW; ORCUTT, CA; Owner: RADIO REPRESENTATIVES, INC.)
KUZZ (550 AM; 5 kW; BAKERSFIELD, CA; Owner: OWENS ONE COMPANY)
KGET (970 AM; 5 kW; BAKERSFIELD, CA; Owner: CLEVELAND RADIO LICENSES, LLC)
KIRN (670 AM; 35 kW; SIMI VALLEY, CA; Owner: LOTUS OXNARD CORP.)
KJUG (1270 AM; 5 kW; TULARE, CA; Owner: WESTCOAST BROADCASTING, INC.)
KAFY (1100 AM; 4 kW; BAKERSFIELD, CA; Owner: KAFY, INC.)
KSPN (710 AM; 50 kW; LOS ANGELES, CA; Owner: KABC-AM RADIO, INC.)
KLAC (570 AM; 50 kW; LOS ANGELES, CA; Owner: AMFM RADIO LICENSES, L.L.C.)
Strongest FM radio stations in Delano:
KMQA (100.5 FM; EAST PORTERVILLE, CA; Owner: MOON BROADCASTING PORTERVILLE L.L.C.)
K266AH (101.1 FM; BENA, CA; Owner: CALVARY CHAPEL OF TWIN FALLS, INC.)
KTQX (90.1 FM; BAKERSFIELD, CA; Owner: RADIO BILINGUE, INC.)
KZPO (103.3 FM; LINDSAY, CA; Owner: LINDSAY BROADCASTING)
KDUV (88.9 FM; VISALIA, CA; Owner: COMMUNITY EDUCATIONAL B/CASTNG, INC.)
KJUG-FM (106.7 FM; TULARE, CA; Owner: WESTCOAST BROADCASTING, INC.)
K220EY (91.9 FM; PORTERVILLE, CA; Owner: FAMILY STATIONS, INC.)
KUFW (90.5 FM; WOODLAKE, CA; Owner: NATIONAL FARM WORKERS SERVICE CENTER)
KMYX-FM (92.5 FM; ARVIN, CA; Owner: FARMWORKER EDUC. RADIO NETWORK, INC.)
KGZO (90.9 FM; SHAFTER, CA; Owner: THE ASSOCIATION FOR COMMUNITY EDUCATION, INC.)
KKBB (99.3 FM; BAKERSFIELD, CA; Owner: BUCKLEY COMMUNICATIONS, INC.)
K293AG (106.5 FM; TAFT, CA; Owner: CENTRO CRISTIANO DE FE, INC.)
KFRB (91.3 FM; BAKERSFIELD, CA; Owner: FAMILY STATIONS, INC.)
KUZZ-FM (107.9 FM; BAKERSFIELD, CA; Owner: OWENS ONE COMPANY, INC)
KISV (94.1 FM; BAKERSFIELD, CA; Owner: AMERICAN GENERAL MEDIA CORP.)
KGFM (101.5 FM; BAKERSFIELD, CA; Owner: LAGNIAPPE BROADCASTING, INC.)
KDFO-FM (98.5 FM; DELANO, CA; Owner: CLEAR CHANNEL BROADCASTING LICENSES, INC.)
KKDJ (105.3 FM; DELANO, CA; Owner: CLEAR CHANNEL BROADCASTING LICENSES, INC.)
KIOO (99.7 FM; PORTERVILLE, CA; Owner: BUCKLEY B/CSTNG CORP OF SAN JOA VAL)
KMAK (100.3 FM; ORANGE COVE, CA; Owner: RICHARD B. SMITH)
TV broadcast stations around Delano:
KTRO-LP (Channel 50; LANCASTER, CA; Owner: ROBERT D. ADELMAN)
KPMC-LP (Channel 42; BAKERSFIELD, CA; Owner: GARY M. COCOLA FAMILY TRUST)
National Bridge Inventory (NBI) Statistics 23 Number of bridges269ft / 82.2m Total length445,452 Total average daily traffic95,300 Total average daily truck traffic
New bridges - historical statistics
1 1930-1939 3 1940-1949 16 1950-1959 3 1960-1969
See full National Bridge Inventory statistics for Delano, CA
Home Mortgage Disclosure Act Aggregated Statistics For Year 2009(Based on 2 full and 3 partial tracts) A) FHA, FSA/RHS & VA B) Conventional C) Refinancings D) Home Improvement Loans F) Non-occupant Loans on Number Average Value Number Average Value Number Average Value Number Average Value Number Average Value
LOANS ORIGINATED 105 $125,217 33 $96,481 65 $104,005 6 $75,810 15 $73,064 APPLICATIONS APPROVED, NOT ACCEPTED 4 $153,725 1 $50,850 16 $128,633 2 $15,530 2 $163,270 APPLICATIONS DENIED 19 $112,658 7 $85,373 97 $144,030 7 $135,464 13 $112,478 APPLICATIONS WITHDRAWN 14 $144,547 4 $87,270 45 $124,662 2 $131,230 6 $113,515 FILES CLOSED FOR INCOMPLETENESS 2 $127,040 2 $99,540 12 $157,447 2 $164,665 2 $66,300
Aggregated Statistics For Year 2008(Based on 2 full and 3 partial tracts) A) FHA, FSA/RHS & VA B) Conventional C) Refinancings D) Home Improvement Loans E) Loans on Dwellings For 5+ Families F) Non-occupant Loans on G) Loans On Manufactured Number Average Value Number Average Value Number Average Value Number Average Value Number Average Value Number Average Value Number Average Value
LOANS ORIGINATED 46 $154,786 25 $135,486 144 $138,448 14 $75,542 1 $139,590 20 $138,125 1 $43,470 APPLICATIONS APPROVED, NOT ACCEPTED 3 $128,130 10 $124,558 35 $114,923 9 $87,668 0 $0 7 $100,401 0 $0 APPLICATIONS DENIED 11 $153,073 32 $135,792 290 $170,825 50 $63,147 1 $151,550 29 $170,989 3 $17,347 APPLICATIONS WITHDRAWN 9 $131,499 10 $136,491 74 $177,404 7 $72,686 0 $0 9 $104,256 1 $249,000 FILES CLOSED FOR INCOMPLETENESS 0 $0 5 $118,588 8 $191,290 1 $50,220 0 $0 3 $135,123 0 $0
Aggregated Statistics For Year 2007(Based on 2 full and 3 partial tracts) A) FHA, FSA/RHS & VA B) Conventional C) Refinancings D) Home Improvement Loans E) Loans on Dwellings For 5+ Families F) Non-occupant Loans on G) Loans On Manufactured Number Average Value Number Average Value Number Average Value Number Average Value Number Average Value Number Average Value Number Average Value
LOANS ORIGINATED 5 $126,190 128 $161,324 553 $162,825 101 $115,175 0 $0 83 $157,327 1 $28,320 APPLICATIONS APPROVED, NOT ACCEPTED 2 $129,900 46 $161,189 144 $184,190 20 $140,354 0 $0 19 $158,255 1 $24,040 APPLICATIONS DENIED 1 $88,190 121 $173,792 519 $188,898 94 $133,814 2 $220,615 78 $159,298 5 $38,440 APPLICATIONS WITHDRAWN 2 $154,795 54 $184,672 253 $176,868 49 $159,558 0 $0 28 $154,185 1 $33,110 FILES CLOSED FOR INCOMPLETENESS 0 $0 17 $171,041 89 $201,494 9 $91,071 0 $0 5 $165,780 0 $0
Aggregated Statistics For Year 2006(Based on 3 full and 3 partial tracts) A) FHA, FSA/RHS & VA B) Conventional C) Refinancings D) Home Improvement Loans E) Loans on Dwellings For 5+ Families F) Non-occupant Loans on G) Loans On Manufactured Number Average Value Number Average Value Number Average Value Number Average Value Number Average Value Number Average Value Number Average Value
LOANS ORIGINATED 10 $224,721 418 $146,707 770 $162,350 134 $101,343 2 $1,548,835 125 $150,619 1 $29,550 APPLICATIONS APPROVED, NOT ACCEPTED 2 $155,030 111 $154,626 165 $166,604 23 $95,798 0 $0 49 $157,774 3 $62,867 APPLICATIONS DENIED 0 $0 211 $150,510 486 $169,881 197 $105,576 1 $2,932,910 65 $166,564 7 $80,020 APPLICATIONS WITHDRAWN 0 $0 92 $161,995 414 $167,755 71 $141,241 0 $0 36 $148,592 1 $90,170 FILES CLOSED FOR INCOMPLETENESS 0 $0 26 $149,022 80 $181,979 14 $129,363 0 $0 10 $164,883 0 $0
Aggregated Statistics For Year 2005(Based on 2 full and 3 partial tracts) A) FHA, FSA/RHS & VA B) Conventional C) Refinancings D) Home Improvement Loans E) Loans on Dwellings For 5+ Families F) Non-occupant Loans on G) Loans On Manufactured Number Average Value Number Average Value Number Average Value Number Average Value Number Average Value Number Average Value Number Average Value
LOANS ORIGINATED 11 $186,238 517 $133,498 813 $133,220 112 $102,839 2 $1,925,285 165 $141,639 3 $112,110 APPLICATIONS APPROVED, NOT ACCEPTED 0 $0 105 $122,712 167 $118,764 19 $78,238 0 $0 45 $135,756 2 $23,850 APPLICATIONS DENIED 1 $138,000 154 $129,543 509 $127,075 170 $88,015 1 $259,010 76 $136,161 4 $32,705 APPLICATIONS WITHDRAWN 0 $0 89 $138,041 433 $129,243 107 $125,383 0 $0 47 $153,779 3 $68,343 FILES CLOSED FOR INCOMPLETENESS 2 $100,515 17 $140,928 65 $124,326 6 $67,088 0 $0 9 $159,647 0 $0
Aggregated Statistics For Year 2004(Based on 2 full and 3 partial tracts) A) FHA, FSA/RHS & VA B) Conventional C) Refinancings D) Home Improvement Loans E) Loans on Dwellings For 5+ Families F) Non-occupant Loans on G) Loans On Manufactured Number Average Value Number Average Value Number Average Value Number Average Value Number Average Value Number Average Value Number Average Value
LOANS ORIGINATED 29 $108,206 220 $103,295 605 $99,230 68 $63,635 2 $95,735 76 $99,714 2 $27,040 APPLICATIONS APPROVED, NOT ACCEPTED 2 $73,185 39 $103,700 160 $108,554 23 $72,869 0 $0 23 $92,753 1 $34,020 APPLICATIONS DENIED 5 $102,512 95 $92,544 595 $98,534 109 $60,900 0 $0 60 $87,273 1 $47,490 APPLICATIONS WITHDRAWN 3 $132,220 36 $108,951 355 $101,385 40 $81,528 0 $0 24 $80,615 2 $40,925 FILES CLOSED FOR INCOMPLETENESS 1 $58,040 8 $125,755 66 $96,333 5 $36,568 0 $0 5 $82,714 0 $0
Aggregated Statistics For Year 2003(Based on 2 full and 3 partial tracts) A) FHA, FSA/RHS & VA B) Conventional C) Refinancings D) Home Improvement Loans E) Loans on Dwellings For 5+ Families F) Non-occupant Loans on Number Average Value Number Average Value Number Average Value Number Average Value Number Average Value Number Average Value
LOANS ORIGINATED 164 $106,673 175 $74,406 704 $84,156 29 $19,930 2 $913,675 71 $76,315 APPLICATIONS APPROVED, NOT ACCEPTED 9 $85,052 33 $105,240 159 $90,293 12 $19,415 0 $0 22 $85,988 APPLICATIONS DENIED 14 $95,021 58 $78,845 557 $88,940 55 $25,454 0 $0 50 $84,139 APPLICATIONS WITHDRAWN 4 $116,150 16 $93,124 285 $90,544 8 $31,775 0 $0 12 $93,381 FILES CLOSED FOR INCOMPLETENESS 3 $82,850 3 $112,670 51 $97,682 3 $64,447 0 $0 5 $69,538
Aggregated Statistics For Year 2002(Based on 2 full and 2 partial tracts) A) FHA, FSA/RHS & VA B) Conventional C) Refinancings D) Home Improvement Loans E) Loans on Dwellings For 5+ Families F) Non-occupant Loans on Number Average Value Number Average Value Number Average Value Number Average Value Number Average Value Number Average Value
LOANS ORIGINATED 203 $94,145 152 $61,036 347 $80,738 50 $21,584 0 $0 35 $69,089 APPLICATIONS APPROVED, NOT ACCEPTED 6 $83,422 14 $87,649 72 $80,987 10 $15,904 0 $0 9 $63,301 APPLICATIONS DENIED 18 $90,637 27 $74,621 358 $85,061 46 $15,418 1 $3,350,000 19 $75,127 APPLICATIONS WITHDRAWN 15 $85,617 15 $61,489 164 $140,825 16 $9,989 0 $0 4 $72,092 FILES CLOSED FOR INCOMPLETENESS 2 $117,445 6 $94,008 42 $84,074 1 $3,970 0 $0 0 $0
Aggregated Statistics For Year 2001(Based on 2 full and 2 partial tracts) A) FHA, FSA/RHS & VA B) Conventional C) Refinancings D) Home Improvement Loans E) Loans on Dwellings For 5+ Families F) Non-occupant Loans on Number Average Value Number Average Value Number Average Value Number Average Value Number Average Value Number Average Value
LOANS ORIGINATED 190 $92,052 143 $42,430 238 $83,527 68 $15,335 0 $0 34 $68,793 APPLICATIONS APPROVED, NOT ACCEPTED 7 $93,817 18 $59,804 44 $68,368 13 $15,829 0 $0 10 $62,316 APPLICATIONS DENIED 11 $82,232 26 $81,082 339 $69,806 86 $17,523 0 $0 16 $76,349 APPLICATIONS WITHDRAWN 14 $88,610 15 $62,763 181 $81,450 32 $19,414 2 $65,875 7 $89,007 FILES CLOSED FOR INCOMPLETENESS 6 $87,708 13 $57,869 62 $87,865 2 $9,705 0 $0 6 $50,315
Aggregated Statistics For Year 2000(Based on 2 full and 2 partial tracts) A) FHA, FSA/RHS & VA B) Conventional C) Refinancings D) Home Improvement Loans E) Loans on Dwellings For 5+ Families F) Non-occupant Loans on Number Average Value Number Average Value Number Average Value Number Average Value Number Average Value Number Average Value
LOANS ORIGINATED 187 $90,111 134 $48,884 119 $62,973 11 $27,142 0 $0 21 $68,820 APPLICATIONS APPROVED, NOT ACCEPTED 4 $86,088 22 $44,305 45 $60,288 16 $29,897 0 $0 11 $60,144 APPLICATIONS DENIED 12 $88,051 55 $49,906 216 $55,815 53 $21,466 2 $467,720 17 $61,046 APPLICATIONS WITHDRAWN 8 $83,214 11 $62,604 107 $63,892 4 $18,900 1 $825,000 12 $69,459 FILES CLOSED FOR INCOMPLETENESS 0 $0 2 $94,000 35 $80,435 2 $11,815 1 $715,000 3 $203,647
Aggregated Statistics For Year 1999(Based on 1 full and 4 partial tracts) A) FHA, FSA/RHS & VA B) Conventional C) Refinancings D) Home Improvement Loans E) Loans on Dwellings For 5+ Families F) Non-occupant Loans on Number Average Value Number Average Value Number Average Value Number Average Value Number Average Value Number Average Value
LOANS ORIGINATED 194 $89,871 69 $63,392 171 $64,429 33 $23,238 1 $74,760 32 $56,767 APPLICATIONS APPROVED, NOT ACCEPTED 5 $72,742 11 $50,075 53 $70,161 15 $29,161 0 $0 5 $49,404 APPLICATIONS DENIED 5 $84,742 45 $48,103 251 $57,538 53 $21,283 0 $0 26 $68,110 APPLICATIONS WITHDRAWN 12 $80,791 13 $65,881 131 $61,676 1 $45,110 0 $0 3 $63,937 FILES CLOSED FOR INCOMPLETENESS 1 $88,770 6 $54,210 30 $64,457 2 $87,510 0 $0 4 $61,258
Detailed HMDA statistics for the following Tracts:
0046.01
, 0046.02 , 0048.00 , 0049.01 , 0049.02 , 0050.00
Private Mortgage Insurance Companies Aggregated Statistics For Year 2009(Based on 2 full and 2 partial tracts) A) Conventional B) Refinancings Number Average Value Number Average Value
LOANS ORIGINATED 2 $171,530 0 $0 APPLICATIONS APPROVED, NOT ACCEPTED 2 $79,825 1 $216,000 APPLICATIONS DENIED 0 $0 0 $0 APPLICATIONS WITHDRAWN 0 $0 0 $0 FILES CLOSED FOR INCOMPLETENESS 0 $0 0 $0
Aggregated Statistics For Year 2008(Based on 2 full and 3 partial tracts) A) Conventional B) Refinancings C) Non-occupant Loans on Number Average Value Number Average Value Number Average Value
LOANS ORIGINATED 9 $176,687 11 $215,160 1 $90,550 APPLICATIONS APPROVED, NOT ACCEPTED 18 $228,482 13 $246,780 0 $0 APPLICATIONS DENIED 4 $143,310 1 $134,270 2 $92,975 APPLICATIONS WITHDRAWN 1 $180,550 0 $0 0 $0 FILES CLOSED FOR INCOMPLETENESS 2 $128,305 1 $293,000 0 $0
Aggregated Statistics For Year 2007(Based on 2 full and 3 partial tracts) A) Conventional B) Refinancings C) Non-occupant Loans on Number Average Value Number Average Value Number Average Value
LOANS ORIGINATED 21 $224,349 32 $239,490 6 $191,707 APPLICATIONS APPROVED, NOT ACCEPTED 3 $216,817 6 $257,268 1 $257,120 APPLICATIONS DENIED 1 $240,250 0 $0 0 $0 APPLICATIONS WITHDRAWN 4 $232,762 3 $216,550 0 $0 FILES CLOSED FOR INCOMPLETENESS 1 $171,000 0 $0 0 $0
Aggregated Statistics For Year 2006(Based on 2 full and 3 partial tracts) A) Conventional B) Refinancings C) Non-occupant Loans on Number Average Value Number Average Value Number Average Value
LOANS ORIGINATED 23 $256,334 15 $214,987 2 $137,535 APPLICATIONS APPROVED, NOT ACCEPTED 1 $132,300 7 $226,341 1 $132,090 APPLICATIONS DENIED 1 $309,000 0 $0 0 $0 APPLICATIONS WITHDRAWN 3 $266,907 0 $0 0 $0 FILES CLOSED FOR INCOMPLETENESS 0 $0 0 $0 0 $0
Aggregated Statistics For Year 2005(Based on 2 full and 3 partial tracts) A) Conventional B) Refinancings C) Non-occupant Loans on Number Average Value Number Average Value Number Average Value
LOANS ORIGINATED 58 $187,220 25 $159,749 12 $155,996 APPLICATIONS APPROVED, NOT ACCEPTED 3 $166,897 11 $159,557 1 $76,000 APPLICATIONS DENIED 1 $164,460 0 $0 1 $164,460 APPLICATIONS WITHDRAWN 1 $140,000 1 $130,050 0 $0 FILES CLOSED FOR INCOMPLETENESS 0 $0 1 $84,690 0 $0
Aggregated Statistics For Year 2004(Based on 2 full and 3 partial tracts) A) Conventional B) Refinancings C) Non-occupant Loans on Number Average Value Number Average Value Number Average Value
LOANS ORIGINATED 41 $123,764 29 $115,021 16 $100,516 APPLICATIONS APPROVED, NOT ACCEPTED 4 $127,162 17 $106,598 4 $91,778 APPLICATIONS DENIED 2 $174,000 2 $85,530 2 $95,500 APPLICATIONS WITHDRAWN 1 $84,690 3 $130,840 1 $84,690 FILES CLOSED FOR INCOMPLETENESS 1 $58,030 1 $89,780 1 $58,030
Aggregated Statistics For Year 2003(Based on 2 full and 3 partial tracts) A) Conventional B) Refinancings C) Non-occupant Loans on Number Average Value Number Average Value Number Average Value
LOANS ORIGINATED 45 $107,879 73 $102,438 5 $94,768 APPLICATIONS APPROVED, NOT ACCEPTED 9 $99,927 26 $99,270 1 $116,850 APPLICATIONS DENIED 2 $71,000 2 $61,630 1 $57,000 APPLICATIONS WITHDRAWN 7 $99,279 2 $123,500 3 $134,667 FILES CLOSED FOR INCOMPLETENESS 0 $0 0 $0 0 $0
Aggregated Statistics For Year 2002(Based on 2 full and 2 partial tracts) A) Conventional B) Refinancings C) Non-occupant Loans on Number Average Value Number Average Value Number Average Value
LOANS ORIGINATED 55 $98,105 47 $97,903 5 $87,384 APPLICATIONS APPROVED, NOT ACCEPTED 7 $86,011 9 $90,809 4 $58,915 APPLICATIONS DENIED 0 $0 0 $0 0 $0 APPLICATIONS WITHDRAWN 0 $0 2 $173,675 0 $0 FILES CLOSED FOR INCOMPLETENESS 0 $0 0 $0 0 $0
Aggregated Statistics For Year 2001(Based on 2 full and 2 partial tracts) A) Conventional B) Refinancings C) Non-occupant Loans on Number Average Value Number Average Value Number Average Value
LOANS ORIGINATED 24 $94,724 15 $94,843 2 $62,470 APPLICATIONS APPROVED, NOT ACCEPTED 4 $107,348 6 $85,960 1 $125,000 APPLICATIONS DENIED 1 $32,940 2 $50,580 1 $32,940 APPLICATIONS WITHDRAWN 0 $0 0 $0 0 $0 FILES CLOSED FOR INCOMPLETENESS 0 $0 1 $64,350 0 $0
Aggregated Statistics For Year 2000(Based on 2 full and 2 partial tracts) A) Conventional B) Refinancings C) Non-occupant Loans on Number Average Value Number Average Value Number Average Value
LOANS ORIGINATED 28 $98,690 6 $68,167 6 $77,360 APPLICATIONS APPROVED, NOT ACCEPTED 5 $86,976 3 $99,913 2 $99,315 APPLICATIONS DENIED 1 $99,310 0 $0 1 $99,310 APPLICATIONS WITHDRAWN 0 $0 0 $0 0 $0 FILES CLOSED FOR INCOMPLETENESS 0 $0 0 $0 0 $0
Aggregated Statistics For Year 1999(Based on 1 full and 4 partial tracts) A) Conventional B) Refinancings Number Average Value Number Average Value
LOANS ORIGINATED 18 $90,894 17 $88,556 APPLICATIONS APPROVED, NOT ACCEPTED 2 $54,515 3 $63,870 APPLICATIONS DENIED 1 $103,760 0 $0 APPLICATIONS WITHDRAWN 0 $0 1 $65,120 FILES CLOSED FOR INCOMPLETENESS 0 $0 0 $0
Detailed PMIC statistics for the following Tracts:
0046.02
, 0048.00 , 0049.01 , 0049.02 , 0050.00 Fire-safe hotels and motels in Delano, California:
Best Western Liberty Inn, 14394 County Line Rd, Delano, California 93215 Phone: (661) 725-0976, Fax: (661) 725-6743
Holiday Inn Express, 2222 Girard St, Delano, California 93215 Phone: (661) 725-7272, Fax: (661) 725-6300
Hyatt Place Delano, 1200 Garzoli Ave, Delano, California 93215 Phone: (888) 591-1234, Fax: (661) 454-6205
All 3 fire-safe hotels and motels in Delano, California
Most common first names in Delano, CA among deceased individuals Name Count Lived (average)
Maria 109 74.6 years Jose 80 72.5 years John 74 77.1 years James 68 72.3 years Mary 67 78.9 years Juan 65 74.6 years William 54 76.0 years Manuel 53 72.3 years Joe 48 69.4 years Pedro 47 78.2 years
Most common last names in Delano, CA among deceased individuals Last name Count Lived (average)
Martinez 49 71.5 years Lopez 41 69.5 years Hernandez 41 73.2 years Garcia 33 70.2 years Rodriguez 32 68.7 years Chavez 30 68.2 years Williams 27 77.0 years Ramirez 26 64.6 years Reyes 25 71.0 years Gonzalez 25 73.7 years
Delano compared to California state average:
Median household income below state average. Median house value significantly below state average. Unemployed percentage above state average. Hispanic race population percentage above state average. Foreign-born population percentage above state average. Length of stay since moving in significantly above state average. Institutionalized population percentage significantly above state average. Percentage of population with a bachelor's degree or higher significantly below state average.
#1 on the list of "Top 101 cities with largest percentage of males in occupations: farming, fishing, and forestry occupations (population 50,000+)"
#1 on the list of "Top 101 cities with largest percentage of females in occupations: farming, fishing, and forestry occupations (population 50,000+)"
#1 on the list of "Top 100 cities with the largest percentage of males (pop. 50,000+)"
#1 on the list of "Top 101 cities with largest percentage of females in industries: agriculture, forestry, fishing and hunting (population 50,000+)"
#2 on the list of "Top 101 cities with largest percentage of males in industries: agriculture, forestry, fishing and hunting (population 50,000+)"
#3 on the list of "Top 101 cities with the least people having Master's or Doctorate degrees (population 50,000+)"
#7 on the list of "Top 101 cities with the lowest number of police officers per 1000 residents (population 50,000+)"
#7 on the list of "Top 100 least-educated cities (pop. 50,000+)"
#15 on the list of "Top 101 cities with the largest sunshine amount differences during a year (population 50,000+)"
#16 on the list of "Top 101 cities with the smallest percentage of elementary and middle school students in private schools (5,000+ students)"
#21 on the list of "Top 101 cities with the lowest average yearly precipitation (population 50,000+)"
#24 on the list of "Top 101 cities with largest percentage of females in industries: retail trade (population 50,000+)"
#25 on the list of "Top 101 cities with the lowest percentage of English-only speaking households, population 50,000+"
#27 on the list of "Top 101 cities with largest percentage of males in occupations: law enforcement workers including supervisors (population 50,000+)"
#29 on the list of "Top 101 cities with the largest city-data.com crime index per police officer (population 50,000+)"
#29 on the list of "Top 101 cities with the highest number of arson incidents per 100,000 residents, excludes tourist destinations and others with a lot of outsiders visiting based on city industries data (population 50,000+)"
#29 on the list of "Top 101 cities with the highest average snowfall in a year (population 50,000+)"
#30 on the list of "Top 101 cities with largest percentage of males in occupations: material moving occupations (population 50,000+)"
#32 on the list of "Top 101 cities with largest percentage of workers with very short commute times (9 minutes or less) (population 50,000+)"
#34 on the list of "Top 101 cities with the highest average sunshine amount (population 50,000+)"
#21 (93250) on the list of "Top 101 zip codes with the largest percentage of Arab first ancestries"
#56 (93250) on the list of "Top 101 zip codes with the largest percentage of returns reporting salary or wage in 2012 (pop 5,000+)"
#74 (93250) on the list of "Top 101 zip codes with the lowest 2012 average taxable interest for individuals (pop 5,000+)"
#89 (93250) on the list of "Top 101 zip codes with the smallest percentage of taxpayers reporting net capital gain/loss in 2012 (pop 5,000+)"
#99 (93280) on the list of "Top 101 zip codes with the largest percentage of taxpayers using paid preparers for 2012 taxes (pop 5,000+)"
#6 on the list of "Top 101 counties with the highest Particulate Matter (PM10 ) Annual air pollution readings in 2012 (µg/m3 )"
#13 on the list of "Top 101 counties with the highest carbon monoxide air pollution readings in 2012 (ppm)"
#13 on the list of "Top 101 counties with the highest lead air pollution readings in 2012 (µg/m3 )"
#13 on the list of "Top 101 counties with the lowest lead air pollution readings in 2012 (µg/m3 )"
#17 on the list of "Top 101 counties with the highest ground withdrawal of fresh water for public supply"
Top Patent Applicants
Anton George Caratan (3)
Kewel Munger (2)
Jakov P. Dulcich (1)
Anton G. Caratan (1)
Total of 7 patent applications in 2008-2024.
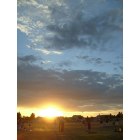
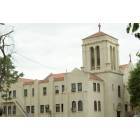


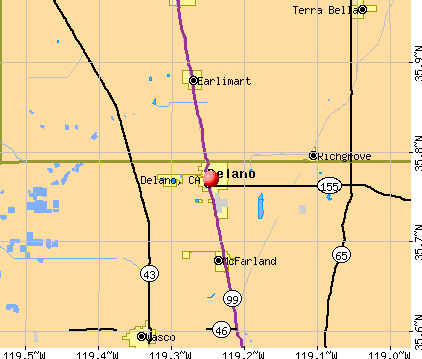


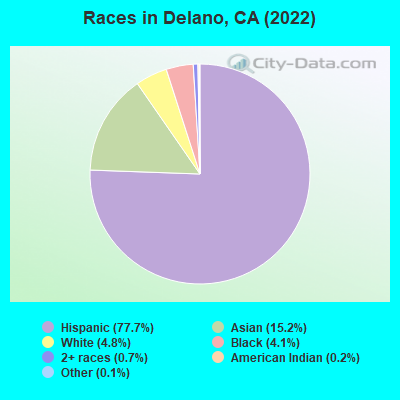
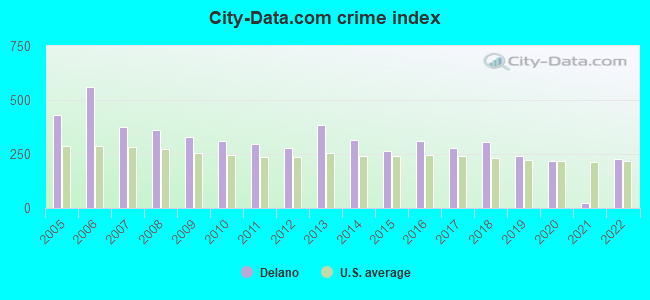
 Recent articles from our blog. Our writers, many of them Ph.D. graduates or candidates, create easy-to-read articles on a wide variety of topics.


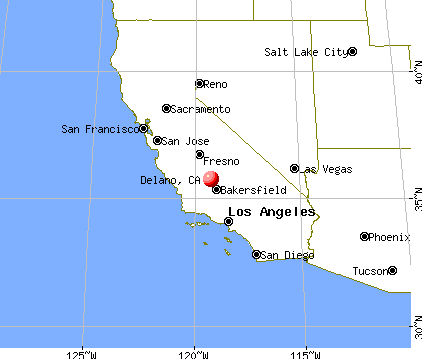
 (31.0 miles
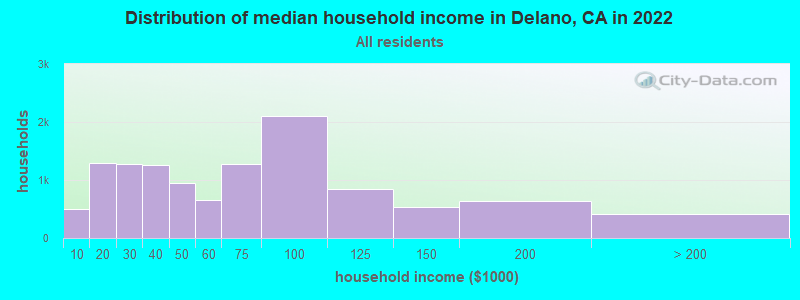
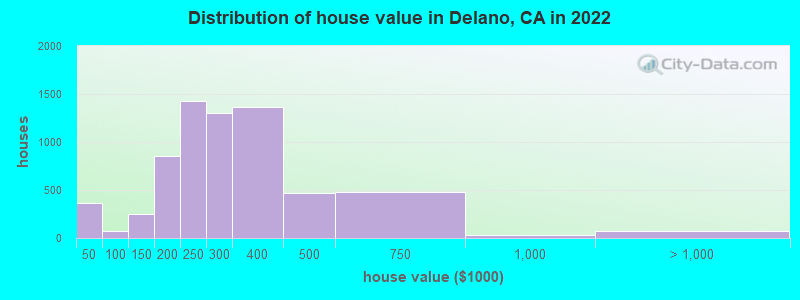
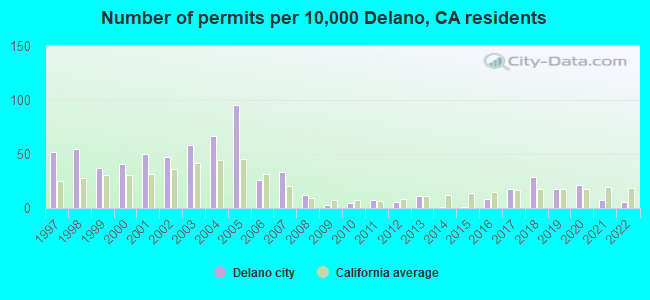
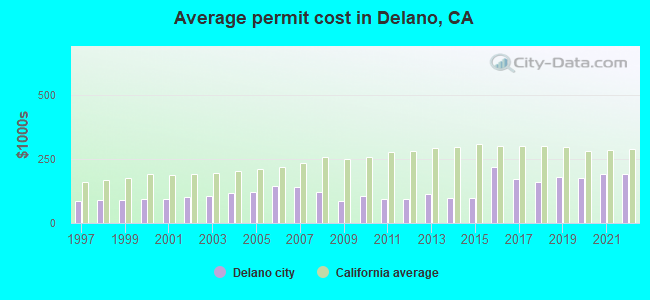
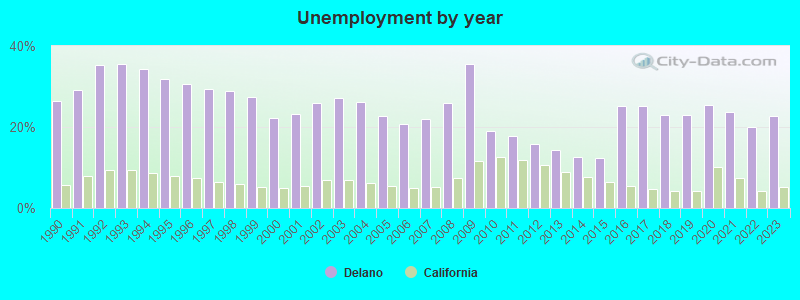
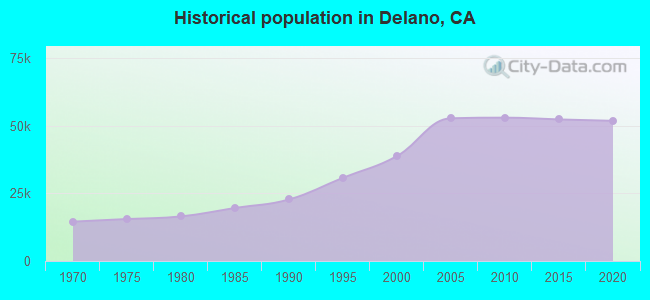
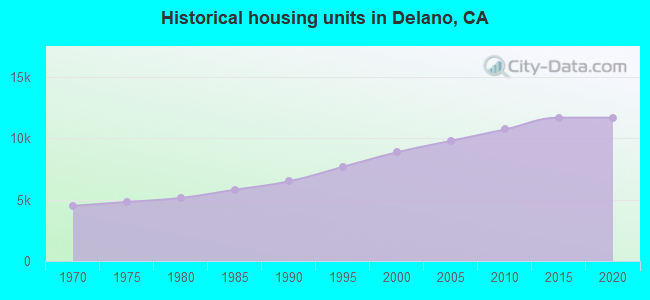
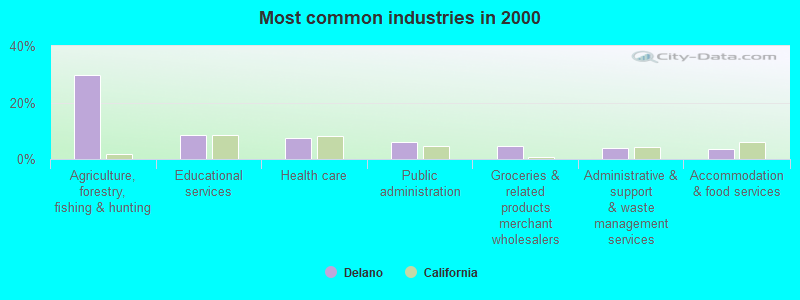
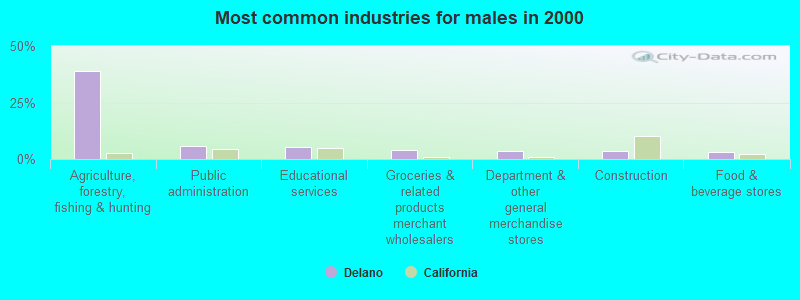
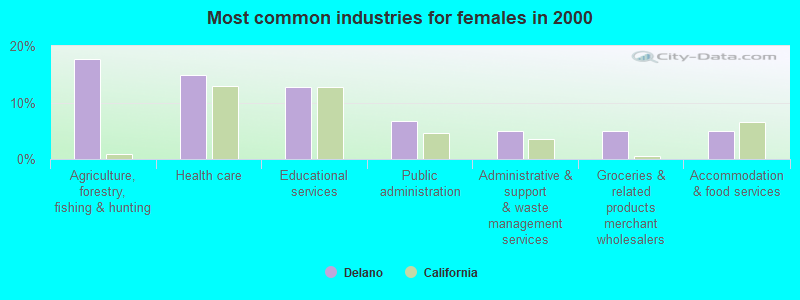
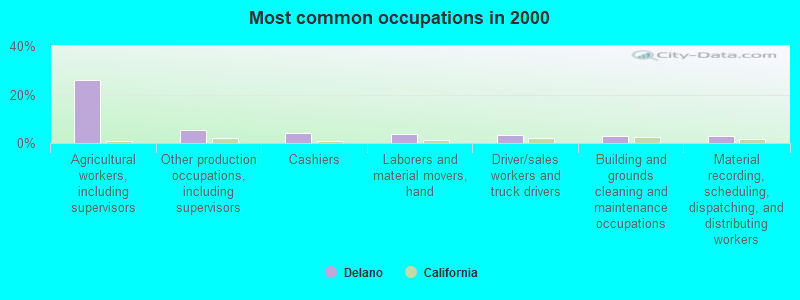
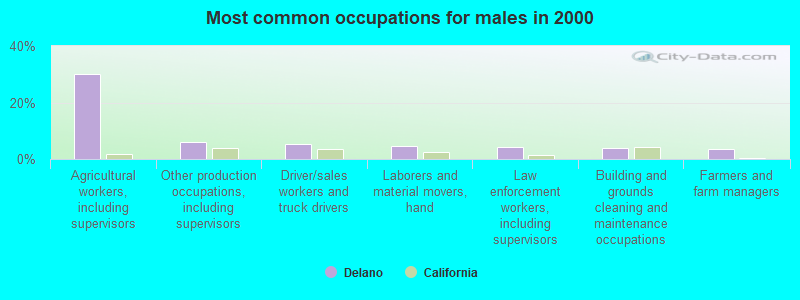
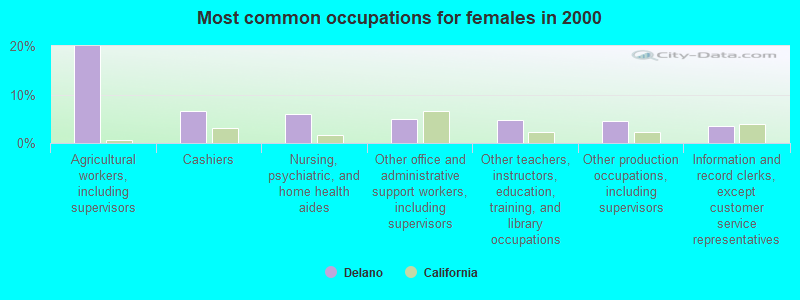
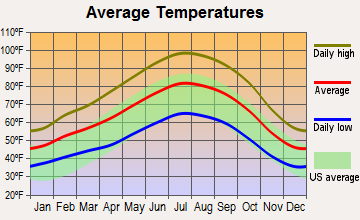
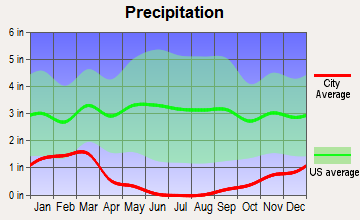
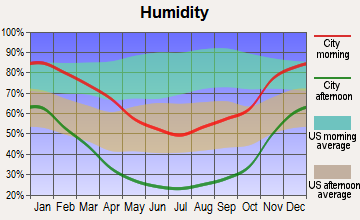
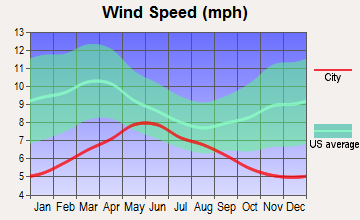
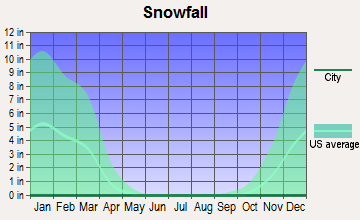
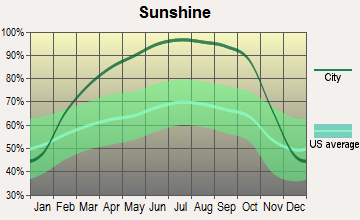
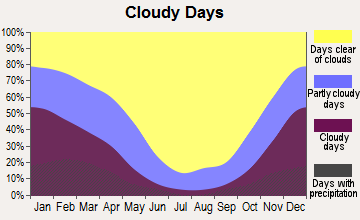


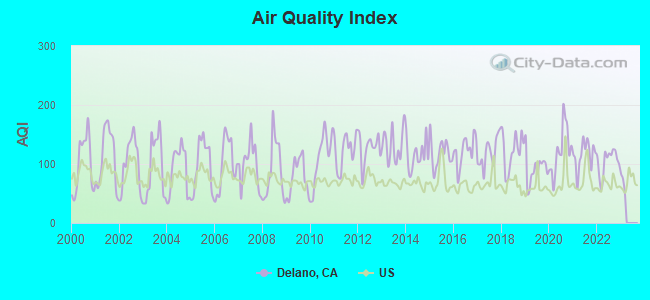
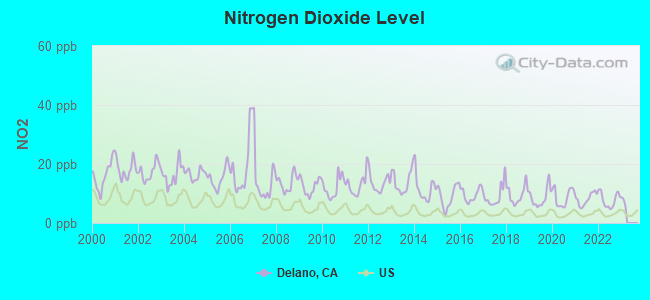
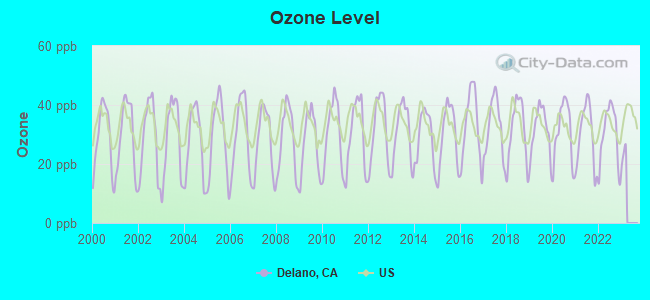
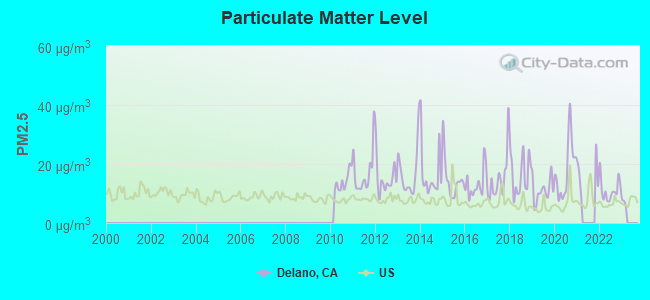

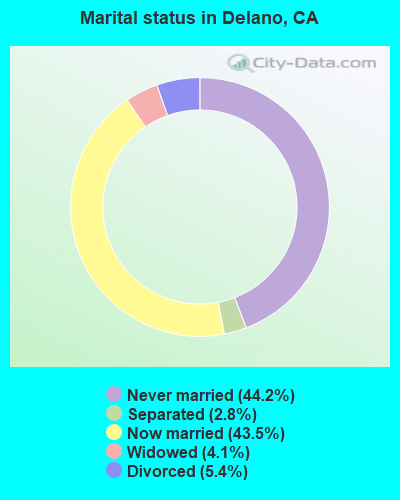
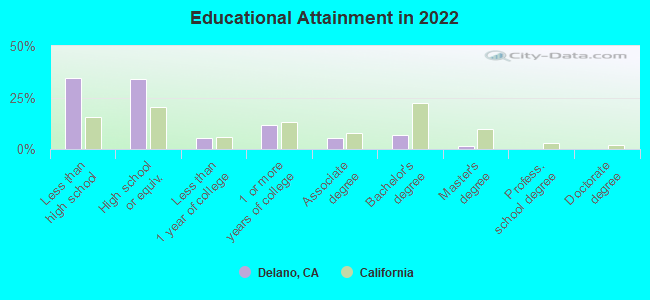
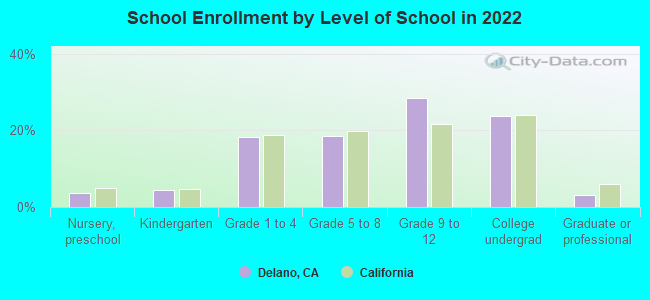
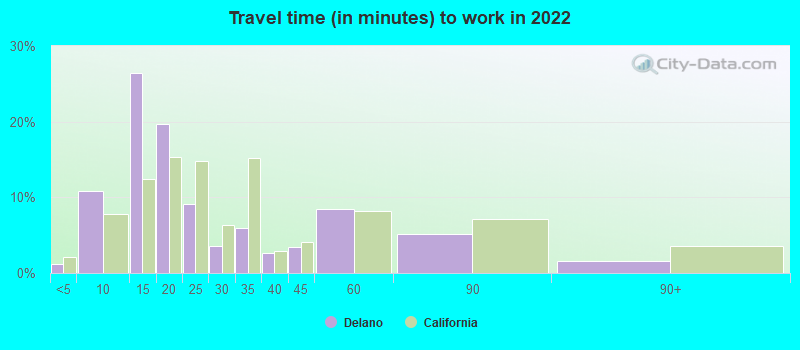
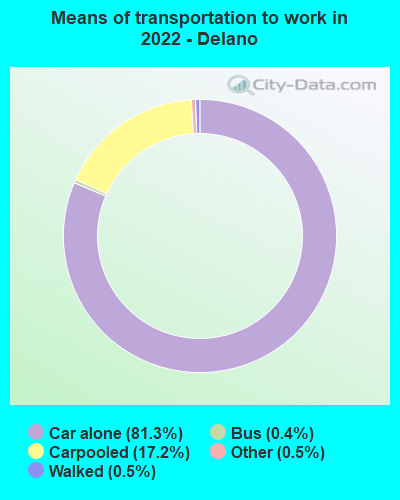
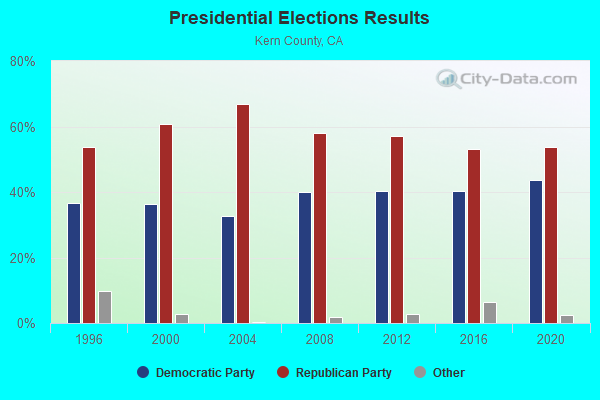
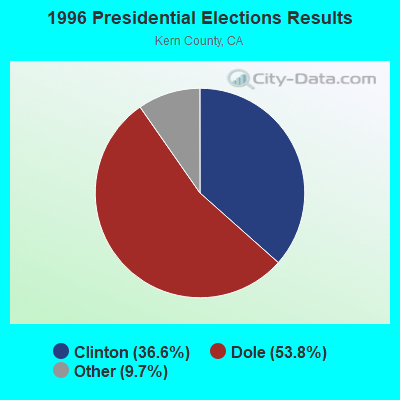
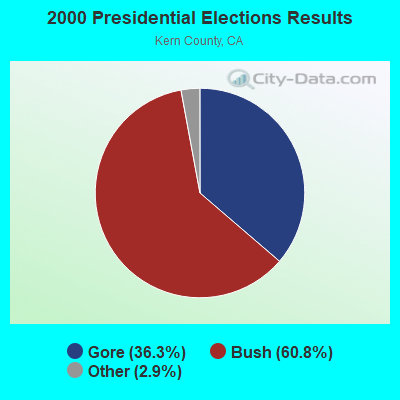
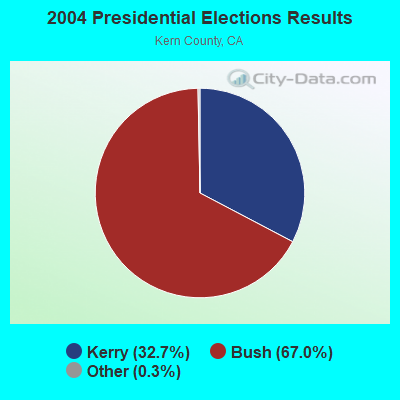
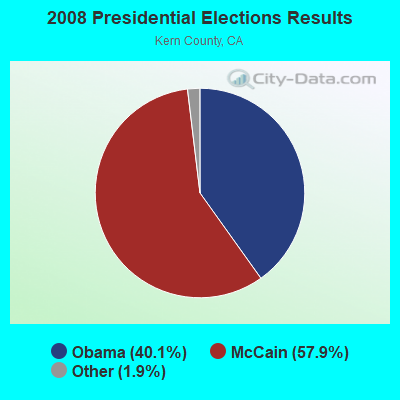
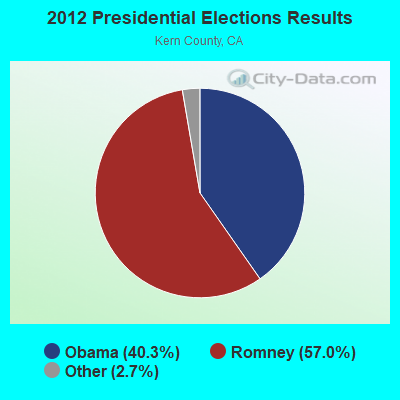
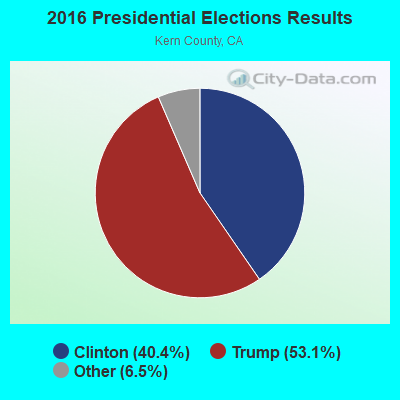
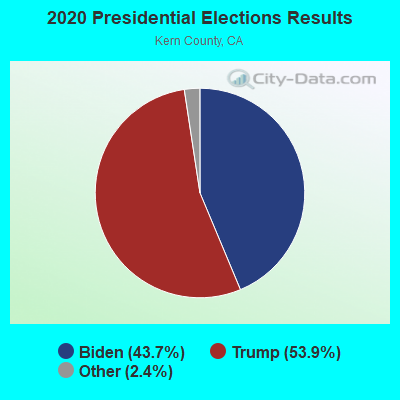
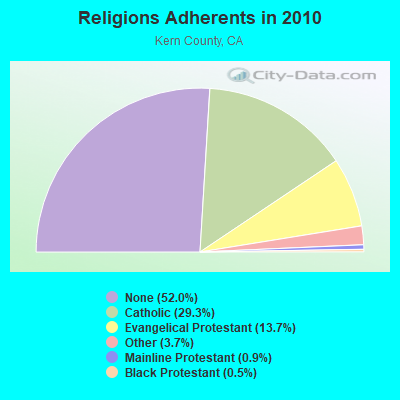
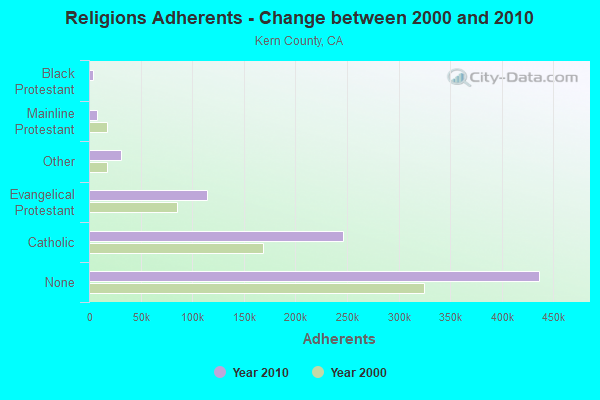
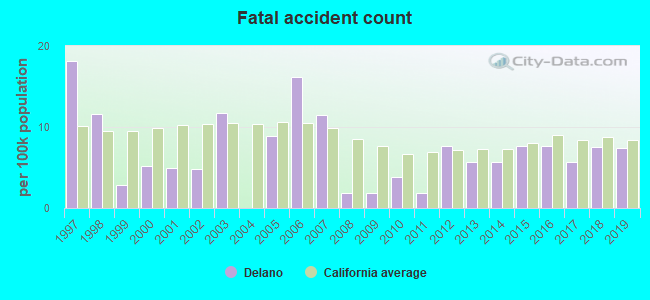
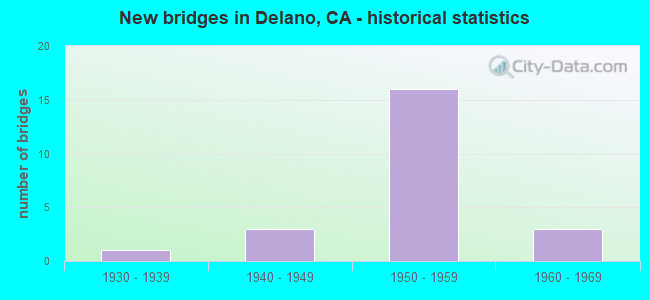
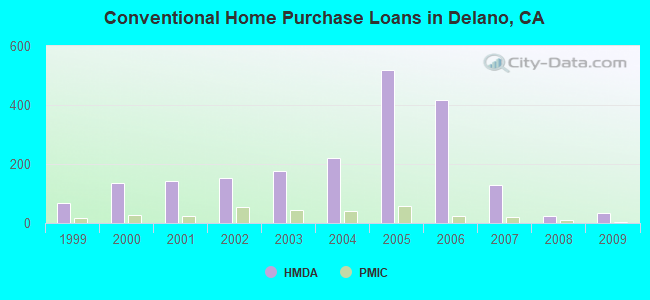
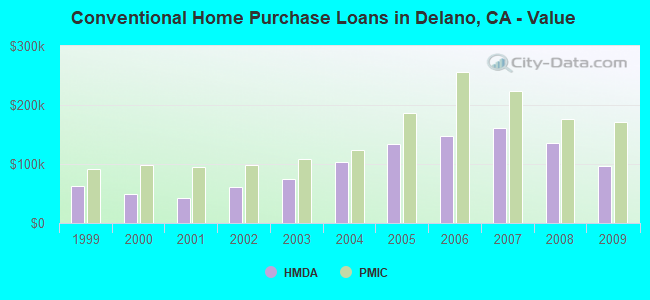
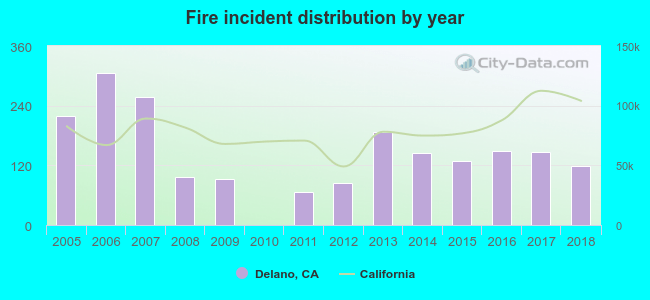 Based on the data from the years 2005 - 2018 the average number of fire incidents per year is 143. The highest number of reported fires - 306 took place in 2006, and the least - 0 in 2010. The data has a dropping trend.
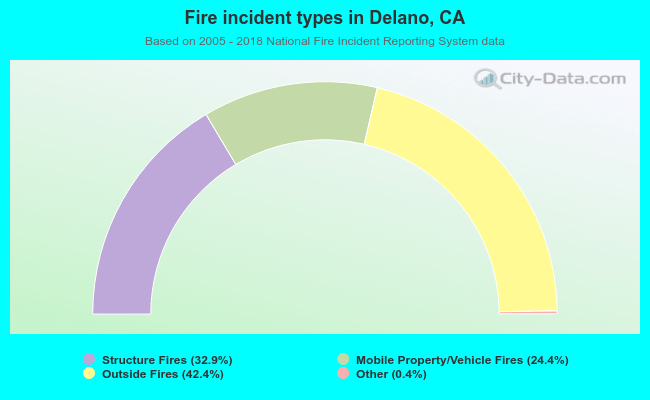 When looking into fire subcategories, the most reports belonged to: Outside Fires (42.4%), and Structure Fires (32.9%).