East Rochester, New York Submit your own pictures of this village and show them to the world
OSM Map
General Map
Google Map
MSN Map
OSM Map
General Map
Google Map
MSN Map
OSM Map
General Map
Google Map
MSN Map
OSM Map
General Map
Google Map
MSN Map
Please wait while loading the map...
Population in 2022: 6,213 (100% urban, 0% rural). Population change since 2000: -6.6%Males: 3,201 Females: 3,012
March 2022 cost of living index in East Rochester: 102.4 (near average, U.S. average is 100) Percentage of residents living in poverty in 2022: 10.1%for White Non-Hispanic residents , 1.0% for Black residents , 16.2% for Hispanic or Latino residents , 83.9% for American Indian residents , 65.3% for other race residents )
Profiles of local businesses
Business Search - 14 Million verified businesses
Data:
Median household income ($)
Median household income (% change since 2000)
Household income diversity
Ratio of average income to average house value (%)
Ratio of average income to average rent
Median household income ($) - White
Median household income ($) - Black or African American
Median household income ($) - Asian
Median household income ($) - Hispanic or Latino
Median household income ($) - American Indian and Alaska Native
Median household income ($) - Multirace
Median household income ($) - Other Race
Median household income for houses/condos with a mortgage ($)
Median household income for apartments without a mortgage ($)
Races - White alone (%)
Races - White alone (% change since 2000)
Races - Black alone (%)
Races - Black alone (% change since 2000)
Races - American Indian alone (%)
Races - American Indian alone (% change since 2000)
Races - Asian alone (%)
Races - Asian alone (% change since 2000)
Races - Hispanic (%)
Races - Hispanic (% change since 2000)
Races - Native Hawaiian and Other Pacific Islander alone (%)
Races - Native Hawaiian and Other Pacific Islander alone (% change since 2000)
Races - Two or more races (%)
Races - Two or more races (% change since 2000)
Races - Other race alone (%)
Races - Other race alone (% change since 2000)
Racial diversity
Unemployment (%)
Unemployment (% change since 2000)
Unemployment (%) - White
Unemployment (%) - Black or African American
Unemployment (%) - Asian
Unemployment (%) - Hispanic or Latino
Unemployment (%) - American Indian and Alaska Native
Unemployment (%) - Multirace
Unemployment (%) - Other Race
Population density (people per square mile)
Population - Males (%)
Population - Females (%)
Population - Males (%) - White
Population - Males (%) - Black or African American
Population - Males (%) - Asian
Population - Males (%) - Hispanic or Latino
Population - Males (%) - American Indian and Alaska Native
Population - Males (%) - Multirace
Population - Males (%) - Other Race
Population - Females (%) - White
Population - Females (%) - Black or African American
Population - Females (%) - Asian
Population - Females (%) - Hispanic or Latino
Population - Females (%) - American Indian and Alaska Native
Population - Females (%) - Multirace
Population - Females (%) - Other Race
Coronavirus confirmed cases (Jun 19, 2024)
Deaths caused by coronavirus (Jun 19, 2024)
Coronavirus confirmed cases (per 100k population) (Jun 19, 2024)
Deaths caused by coronavirus (per 100k population) (Jun 19, 2024)
Daily increase in number of cases (Jun 19, 2024)
Weekly increase in number of cases (Jun 19, 2024)
Cases doubled (in days) (Jun 19, 2024)
Hospitalized patients (Apr 18, 2022)
Negative test results (Apr 18, 2022)
Total test results (Apr 18, 2022)
COVID Vaccine doses distributed (per 100k population) (Sep 19, 2023)
COVID Vaccine doses administered (per 100k population) (Sep 19, 2023)
COVID Vaccine doses distributed (Sep 19, 2023)
COVID Vaccine doses administered (Sep 19, 2023)
Likely homosexual households (%)
Likely homosexual households (% change since 2000)
Likely homosexual households - Lesbian couples (%)
Likely homosexual households - Lesbian couples (% change since 2000)
Likely homosexual households - Gay men (%)
Likely homosexual households - Gay men (% change since 2000)
Cost of living index
Median gross rent ($)
Median contract rent ($)
Median monthly housing costs ($)
Median house or condo value ($)
Median house or condo value ($ change since 2000)
Mean house or condo value by units in structure - 1, detached ($)
Mean house or condo value by units in structure - 1, attached ($)
Mean house or condo value by units in structure - 2 ($)
Mean house or condo value by units in structure by units in structure - 3 or 4 ($)
Mean house or condo value by units in structure - 5 or more ($)
Mean house or condo value by units in structure - Boat, RV, van, etc. ($)
Mean house or condo value by units in structure - Mobile home ($)
Median house or condo value ($) - White
Median house or condo value ($) - Black or African American
Median house or condo value ($) - Asian
Median house or condo value ($) - Hispanic or Latino
Median house or condo value ($) - American Indian and Alaska Native
Median house or condo value ($) - Multirace
Median house or condo value ($) - Other Race
Median resident age
Resident age diversity
Median resident age - Males
Median resident age - Females
Median resident age - White
Median resident age - Black or African American
Median resident age - Asian
Median resident age - Hispanic or Latino
Median resident age - American Indian and Alaska Native
Median resident age - Multirace
Median resident age - Other Race
Median resident age - Males - White
Median resident age - Males - Black or African American
Median resident age - Males - Asian
Median resident age - Males - Hispanic or Latino
Median resident age - Males - American Indian and Alaska Native
Median resident age - Males - Multirace
Median resident age - Males - Other Race
Median resident age - Females - White
Median resident age - Females - Black or African American
Median resident age - Females - Asian
Median resident age - Females - Hispanic or Latino
Median resident age - Females - American Indian and Alaska Native
Median resident age - Females - Multirace
Median resident age - Females - Other Race
Commute - mean travel time to work (minutes)
Travel time to work - Less than 5 minutes (%)
Travel time to work - Less than 5 minutes (% change since 2000)
Travel time to work - 5 to 9 minutes (%)
Travel time to work - 5 to 9 minutes (% change since 2000)
Travel time to work - 10 to 19 minutes (%)
Travel time to work - 10 to 19 minutes (% change since 2000)
Travel time to work - 20 to 29 minutes (%)
Travel time to work - 20 to 29 minutes (% change since 2000)
Travel time to work - 30 to 39 minutes (%)
Travel time to work - 30 to 39 minutes (% change since 2000)
Travel time to work - 40 to 59 minutes (%)
Travel time to work - 40 to 59 minutes (% change since 2000)
Travel time to work - 60 to 89 minutes (%)
Travel time to work - 60 to 89 minutes (% change since 2000)
Travel time to work - 90 or more minutes (%)
Travel time to work - 90 or more minutes (% change since 2000)
Marital status - Never married (%)
Marital status - Now married (%)
Marital status - Separated (%)
Marital status - Widowed (%)
Marital status - Divorced (%)
Median family income ($)
Median family income (% change since 2000)
Median non-family income ($)
Median non-family income (% change since 2000)
Median per capita income ($)
Median per capita income (% change since 2000)
Median family income ($) - White
Median family income ($) - Black or African American
Median family income ($) - Asian
Median family income ($) - Hispanic or Latino
Median family income ($) - American Indian and Alaska Native
Median family income ($) - Multirace
Median family income ($) - Other Race
Median year house/condo built
Median year apartment built
Year house built - Built 2005 or later (%)
Year house built - Built 2000 to 2004 (%)
Year house built - Built 1990 to 1999 (%)
Year house built - Built 1980 to 1989 (%)
Year house built - Built 1970 to 1979 (%)
Year house built - Built 1960 to 1969 (%)
Year house built - Built 1950 to 1959 (%)
Year house built - Built 1940 to 1949 (%)
Year house built - Built 1939 or earlier (%)
Average household size
Household density (households per square mile)
Average household size - White
Average household size - Black or African American
Average household size - Asian
Average household size - Hispanic or Latino
Average household size - American Indian and Alaska Native
Average household size - Multirace
Average household size - Other Race
Occupied housing units (%)
Vacant housing units (%)
Owner occupied housing units (%)
Renter occupied housing units (%)
Vacancy status - For rent (%)
Vacancy status - For sale only (%)
Vacancy status - Rented or sold, not occupied (%)
Vacancy status - For seasonal, recreational, or occasional use (%)
Vacancy status - For migrant workers (%)
Vacancy status - Other vacant (%)
Residents with income below the poverty level (%)
Residents with income below 50% of the poverty level (%)
Children below poverty level (%)
Poor families by family type - Married-couple family (%)
Poor families by family type - Male, no wife present (%)
Poor families by family type - Female, no husband present (%)
Poverty status for native-born residents (%)
Poverty status for foreign-born residents (%)
Poverty among high school graduates not in families (%)
Poverty among people who did not graduate high school not in families (%)
Residents with income below the poverty level (%) - White
Residents with income below the poverty level (%) - Black or African American
Residents with income below the poverty level (%) - Asian
Residents with income below the poverty level (%) - Hispanic or Latino
Residents with income below the poverty level (%) - American Indian and Alaska Native
Residents with income below the poverty level (%) - Multirace
Residents with income below the poverty level (%) - Other Race
Air pollution - Air Quality Index (AQI)
Air pollution - CO
Air pollution - NO2
Air pollution - SO2
Air pollution - Ozone
Air pollution - PM10
Air pollution - PM25
Air pollution - Pb
Crime - Murders per 100,000 population
Crime - Rapes per 100,000 population
Crime - Robberies per 100,000 population
Crime - Assaults per 100,000 population
Crime - Burglaries per 100,000 population
Crime - Thefts per 100,000 population
Crime - Auto thefts per 100,000 population
Crime - Arson per 100,000 population
Crime - City-data.com crime index
Crime - Violent crime index
Crime - Property crime index
Crime - Murders per 100,000 population (5 year average)
Crime - Rapes per 100,000 population (5 year average)
Crime - Robberies per 100,000 population (5 year average)
Crime - Assaults per 100,000 population (5 year average)
Crime - Burglaries per 100,000 population (5 year average)
Crime - Thefts per 100,000 population (5 year average)
Crime - Auto thefts per 100,000 population (5 year average)
Crime - Arson per 100,000 population (5 year average)
Crime - City-data.com crime index (5 year average)
Crime - Violent crime index (5 year average)
Crime - Property crime index (5 year average)
1996 Presidential Elections Results (%) - Democratic Party (Clinton)
1996 Presidential Elections Results (%) - Republican Party (Dole)
1996 Presidential Elections Results (%) - Other
2000 Presidential Elections Results (%) - Democratic Party (Gore)
2000 Presidential Elections Results (%) - Republican Party (Bush)
2000 Presidential Elections Results (%) - Other
2004 Presidential Elections Results (%) - Democratic Party (Kerry)
2004 Presidential Elections Results (%) - Republican Party (Bush)
2004 Presidential Elections Results (%) - Other
2008 Presidential Elections Results (%) - Democratic Party (Obama)
2008 Presidential Elections Results (%) - Republican Party (McCain)
2008 Presidential Elections Results (%) - Other
2012 Presidential Elections Results (%) - Democratic Party (Obama)
2012 Presidential Elections Results (%) - Republican Party (Romney)
2012 Presidential Elections Results (%) - Other
2016 Presidential Elections Results (%) - Democratic Party (Clinton)
2016 Presidential Elections Results (%) - Republican Party (Trump)
2016 Presidential Elections Results (%) - Other
2020 Presidential Elections Results (%) - Democratic Party (Biden)
2020 Presidential Elections Results (%) - Republican Party (Trump)
2020 Presidential Elections Results (%) - Other
Ancestries Reported - Arab (%)
Ancestries Reported - Czech (%)
Ancestries Reported - Danish (%)
Ancestries Reported - Dutch (%)
Ancestries Reported - English (%)
Ancestries Reported - French (%)
Ancestries Reported - French Canadian (%)
Ancestries Reported - German (%)
Ancestries Reported - Greek (%)
Ancestries Reported - Hungarian (%)
Ancestries Reported - Irish (%)
Ancestries Reported - Italian (%)
Ancestries Reported - Lithuanian (%)
Ancestries Reported - Norwegian (%)
Ancestries Reported - Polish (%)
Ancestries Reported - Portuguese (%)
Ancestries Reported - Russian (%)
Ancestries Reported - Scotch-Irish (%)
Ancestries Reported - Scottish (%)
Ancestries Reported - Slovak (%)
Ancestries Reported - Subsaharan African (%)
Ancestries Reported - Swedish (%)
Ancestries Reported - Swiss (%)
Ancestries Reported - Ukrainian (%)
Ancestries Reported - United States (%)
Ancestries Reported - Welsh (%)
Ancestries Reported - West Indian (%)
Ancestries Reported - Other (%)
Educational Attainment - No schooling completed (%)
Educational Attainment - Less than high school (%)
Educational Attainment - High school or equivalent (%)
Educational Attainment - Less than 1 year of college (%)
Educational Attainment - 1 or more years of college (%)
Educational Attainment - Associate degree (%)
Educational Attainment - Bachelor's degree (%)
Educational Attainment - Master's degree (%)
Educational Attainment - Professional school degree (%)
Educational Attainment - Doctorate degree (%)
School Enrollment - Nursery, preschool (%)
School Enrollment - Kindergarten (%)
School Enrollment - Grade 1 to 4 (%)
School Enrollment - Grade 5 to 8 (%)
School Enrollment - Grade 9 to 12 (%)
School Enrollment - College undergrad (%)
School Enrollment - Graduate or professional (%)
School Enrollment - Not enrolled in school (%)
School enrollment - Public schools (%)
School enrollment - Private schools (%)
School enrollment - Not enrolled (%)
Median number of rooms in houses and condos
Median number of rooms in apartments
Housing units lacking complete plumbing facilities (%)
Housing units lacking complete kitchen facilities (%)
Density of houses
Urban houses (%)
Rural houses (%)
Households with people 60 years and over (%)
Households with people 65 years and over (%)
Households with people 75 years and over (%)
Households with one or more nonrelatives (%)
Households with no nonrelatives (%)
Population in households (%)
Family households (%)
Nonfamily households (%)
Population in families (%)
Family households with own children (%)
Median number of bedrooms in owner occupied houses
Mean number of bedrooms in owner occupied houses
Median number of bedrooms in renter occupied houses
Mean number of bedrooms in renter occupied houses
Median number of vehichles in owner occupied houses
Mean number of vehichles in owner occupied houses
Median number of vehichles in renter occupied houses
Mean number of vehichles in renter occupied houses
Mortgage status - with mortgage (%)
Mortgage status - with second mortgage (%)
Mortgage status - with home equity loan (%)
Mortgage status - with both second mortgage and home equity loan (%)
Mortgage status - without a mortgage (%)
Average family size
Average family size - White
Average family size - Black or African American
Average family size - Asian
Average family size - Hispanic or Latino
Average family size - American Indian and Alaska Native
Average family size - Multirace
Average family size - Other Race
Geographical mobility - Same house 1 year ago (%)
Geographical mobility - Moved within same county (%)
Geographical mobility - Moved from different county within same state (%)
Geographical mobility - Moved from different state (%)
Geographical mobility - Moved from abroad (%)
Place of birth - Born in state of residence (%)
Place of birth - Born in other state (%)
Place of birth - Native, outside of US (%)
Place of birth - Foreign born (%)
Housing units in structures - 1, detached (%)
Housing units in structures - 1, attached (%)
Housing units in structures - 2 (%)
Housing units in structures - 3 or 4 (%)
Housing units in structures - 5 to 9 (%)
Housing units in structures - 10 to 19 (%)
Housing units in structures - 20 to 49 (%)
Housing units in structures - 50 or more (%)
Housing units in structures - Mobile home (%)
Housing units in structures - Boat, RV, van, etc. (%)
House/condo owner moved in on average (years ago)
Renter moved in on average (years ago)
Year householder moved into unit - Moved in 1999 to March 2000 (%)
Year householder moved into unit - Moved in 1995 to 1998 (%)
Year householder moved into unit - Moved in 1990 to 1994 (%)
Year householder moved into unit - Moved in 1980 to 1989 (%)
Year householder moved into unit - Moved in 1970 to 1979 (%)
Year householder moved into unit - Moved in 1969 or earlier (%)
Means of transportation to work - Drove car alone (%)
Means of transportation to work - Carpooled (%)
Means of transportation to work - Public transportation (%)
Means of transportation to work - Bus or trolley bus (%)
Means of transportation to work - Streetcar or trolley car (%)
Means of transportation to work - Subway or elevated (%)
Means of transportation to work - Railroad (%)
Means of transportation to work - Ferryboat (%)
Means of transportation to work - Taxicab (%)
Means of transportation to work - Motorcycle (%)
Means of transportation to work - Bicycle (%)
Means of transportation to work - Walked (%)
Means of transportation to work - Other means (%)
Working at home (%)
Industry diversity
Most Common Industries - Agriculture, forestry, fishing and hunting, and mining (%)
Most Common Industries - Agriculture, forestry, fishing and hunting (%)
Most Common Industries - Mining, quarrying, and oil and gas extraction (%)
Most Common Industries - Construction (%)
Most Common Industries - Manufacturing (%)
Most Common Industries - Wholesale trade (%)
Most Common Industries - Retail trade (%)
Most Common Industries - Transportation and warehousing, and utilities (%)
Most Common Industries - Transportation and warehousing (%)
Most Common Industries - Utilities (%)
Most Common Industries - Information (%)
Most Common Industries - Finance and insurance, and real estate and rental and leasing (%)
Most Common Industries - Finance and insurance (%)
Most Common Industries - Real estate and rental and leasing (%)
Most Common Industries - Professional, scientific, and management, and administrative and waste management services (%)
Most Common Industries - Professional, scientific, and technical services (%)
Most Common Industries - Management of companies and enterprises (%)
Most Common Industries - Administrative and support and waste management services (%)
Most Common Industries - Educational services, and health care and social assistance (%)
Most Common Industries - Educational services (%)
Most Common Industries - Health care and social assistance (%)
Most Common Industries - Arts, entertainment, and recreation, and accommodation and food services (%)
Most Common Industries - Arts, entertainment, and recreation (%)
Most Common Industries - Accommodation and food services (%)
Most Common Industries - Other services, except public administration (%)
Most Common Industries - Public administration (%)
Occupation diversity
Most Common Occupations - Management, business, science, and arts occupations (%)
Most Common Occupations - Management, business, and financial occupations (%)
Most Common Occupations - Management occupations (%)
Most Common Occupations - Business and financial operations occupations (%)
Most Common Occupations - Computer, engineering, and science occupations (%)
Most Common Occupations - Computer and mathematical occupations (%)
Most Common Occupations - Architecture and engineering occupations (%)
Most Common Occupations - Life, physical, and social science occupations (%)
Most Common Occupations - Education, legal, community service, arts, and media occupations (%)
Most Common Occupations - Community and social service occupations (%)
Most Common Occupations - Legal occupations (%)
Most Common Occupations - Education, training, and library occupations (%)
Most Common Occupations - Arts, design, entertainment, sports, and media occupations (%)
Most Common Occupations - Healthcare practitioners and technical occupations (%)
Most Common Occupations - Health diagnosing and treating practitioners and other technical occupations (%)
Most Common Occupations - Health technologists and technicians (%)
Most Common Occupations - Service occupations (%)
Most Common Occupations - Healthcare support occupations (%)
Most Common Occupations - Protective service occupations (%)
Most Common Occupations - Fire fighting and prevention, and other protective service workers including supervisors (%)
Most Common Occupations - Law enforcement workers including supervisors (%)
Most Common Occupations - Food preparation and serving related occupations (%)
Most Common Occupations - Building and grounds cleaning and maintenance occupations (%)
Most Common Occupations - Personal care and service occupations (%)
Most Common Occupations - Sales and office occupations (%)
Most Common Occupations - Sales and related occupations (%)
Most Common Occupations - Office and administrative support occupations (%)
Most Common Occupations - Natural resources, construction, and maintenance occupations (%)
Most Common Occupations - Farming, fishing, and forestry occupations (%)
Most Common Occupations - Construction and extraction occupations (%)
Most Common Occupations - Installation, maintenance, and repair occupations (%)
Most Common Occupations - Production, transportation, and material moving occupations (%)
Most Common Occupations - Production occupations (%)
Most Common Occupations - Transportation occupations (%)
Most Common Occupations - Material moving occupations (%)
People in Group quarters - Institutionalized population (%)
People in Group quarters - Correctional institutions (%)
People in Group quarters - Federal prisons and detention centers (%)
People in Group quarters - Halfway houses (%)
People in Group quarters - Local jails and other confinement facilities (including police lockups) (%)
People in Group quarters - Military disciplinary barracks (%)
People in Group quarters - State prisons (%)
People in Group quarters - Other types of correctional institutions (%)
People in Group quarters - Nursing homes (%)
People in Group quarters - Hospitals/wards, hospices, and schools for the handicapped (%)
People in Group quarters - Hospitals/wards and hospices for chronically ill (%)
People in Group quarters - Hospices or homes for chronically ill (%)
People in Group quarters - Military hospitals or wards for chronically ill (%)
People in Group quarters - Other hospitals or wards for chronically ill (%)
People in Group quarters - Hospitals or wards for drug/alcohol abuse (%)
People in Group quarters - Mental (Psychiatric) hospitals or wards (%)
People in Group quarters - Schools, hospitals, or wards for the mentally retarded (%)
People in Group quarters - Schools, hospitals, or wards for the physically handicapped (%)
People in Group quarters - Institutions for the deaf (%)
People in Group quarters - Institutions for the blind (%)
People in Group quarters - Orthopedic wards and institutions for the physically handicapped (%)
People in Group quarters - Wards in general hospitals for patients who have no usual home elsewhere (%)
People in Group quarters - Wards in military hospitals for patients who have no usual home elsewhere (%)
People in Group quarters - Juvenile institutions (%)
People in Group quarters - Long-term care (%)
People in Group quarters - Homes for abused, dependent, and neglected children (%)
People in Group quarters - Residential treatment centers for emotionally disturbed children (%)
People in Group quarters - Training schools for juvenile delinquents (%)
People in Group quarters - Short-term care, detention or diagnostic centers for delinquent children (%)
People in Group quarters - Type of juvenile institution unknown (%)
People in Group quarters - Noninstitutionalized population (%)
People in Group quarters - College dormitories (includes college quarters off campus) (%)
People in Group quarters - Military quarters (%)
People in Group quarters - On base (%)
People in Group quarters - Barracks, unaccompanied personnel housing (UPH), (Enlisted/Officer), ;and similar group living quarters for military personnel (%)
People in Group quarters - Transient quarters for temporary residents (%)
People in Group quarters - Military ships (%)
People in Group quarters - Group homes (%)
People in Group quarters - Homes or halfway houses for drug/alcohol abuse (%)
People in Group quarters - Homes for the mentally ill (%)
People in Group quarters - Homes for the mentally retarded (%)
People in Group quarters - Homes for the physically handicapped (%)
People in Group quarters - Other group homes (%)
People in Group quarters - Religious group quarters (%)
People in Group quarters - Dormitories (%)
People in Group quarters - Agriculture workers' dormitories on farms (%)
People in Group quarters - Job Corps and vocational training facilities (%)
People in Group quarters - Other workers' dormitories (%)
People in Group quarters - Crews of maritime vessels (%)
People in Group quarters - Other nonhousehold living situations (%)
People in Group quarters - Other noninstitutional group quarters (%)
Residents speaking English at home (%)
Residents speaking English at home - Born in the United States (%)
Residents speaking English at home - Native, born elsewhere (%)
Residents speaking English at home - Foreign born (%)
Residents speaking Spanish at home (%)
Residents speaking Spanish at home - Born in the United States (%)
Residents speaking Spanish at home - Native, born elsewhere (%)
Residents speaking Spanish at home - Foreign born (%)
Residents speaking other language at home (%)
Residents speaking other language at home - Born in the United States (%)
Residents speaking other language at home - Native, born elsewhere (%)
Residents speaking other language at home - Foreign born (%)
Class of Workers - Employee of private company (%)
Class of Workers - Self-employed in own incorporated business (%)
Class of Workers - Private not-for-profit wage and salary workers (%)
Class of Workers - Local government workers (%)
Class of Workers - State government workers (%)
Class of Workers - Federal government workers (%)
Class of Workers - Self-employed workers in own not incorporated business and Unpaid family workers (%)
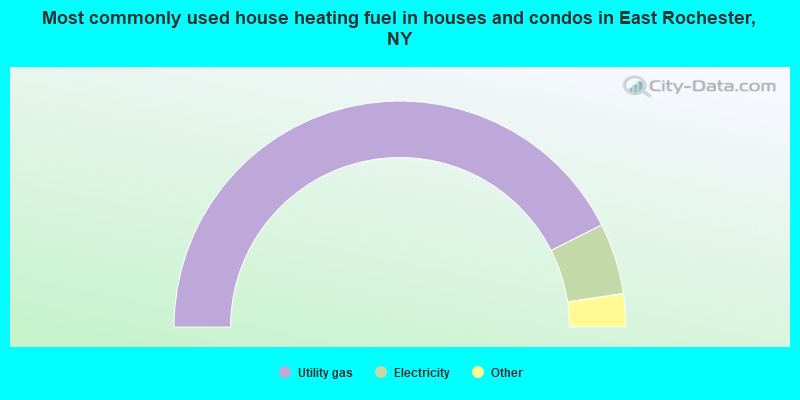
House heating fuel used in houses and condos - Utility gas (%)
House heating fuel used in houses and condos - Bottled, tank, or LP gas (%)
House heating fuel used in houses and condos - Electricity (%)
House heating fuel used in houses and condos - Fuel oil, kerosene, etc. (%)
House heating fuel used in houses and condos - Coal or coke (%)
House heating fuel used in houses and condos - Wood (%)
House heating fuel used in houses and condos - Solar energy (%)
House heating fuel used in houses and condos - Other fuel (%)
House heating fuel used in houses and condos - No fuel used (%)
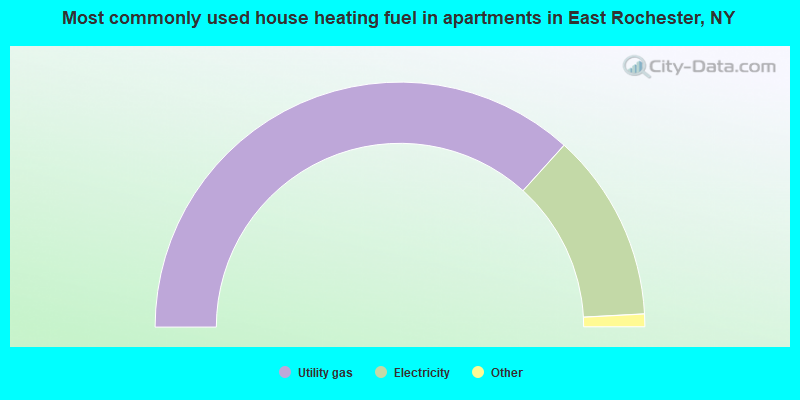
House heating fuel used in apartments - Utility gas (%)
House heating fuel used in apartments - Bottled, tank, or LP gas (%)
House heating fuel used in apartments - Electricity (%)
House heating fuel used in apartments - Fuel oil, kerosene, etc. (%)
House heating fuel used in apartments - Coal or coke (%)
House heating fuel used in apartments - Wood (%)
House heating fuel used in apartments - Solar energy (%)
House heating fuel used in apartments - Other fuel (%)
House heating fuel used in apartments - No fuel used (%)
Armed forces status - In Armed Forces (%)
Armed forces status - Civilian (%)
Armed forces status - Civilian - Veteran (%)
Armed forces status - Civilian - Nonveteran (%)
Fatal accidents locations in years 2005-2021
Fatal accidents locations in 2005
Fatal accidents locations in 2006
Fatal accidents locations in 2007
Fatal accidents locations in 2008
Fatal accidents locations in 2009
Fatal accidents locations in 2010
Fatal accidents locations in 2011
Fatal accidents locations in 2012
Fatal accidents locations in 2013
Fatal accidents locations in 2014
Fatal accidents locations in 2015
Fatal accidents locations in 2016
Fatal accidents locations in 2017
Fatal accidents locations in 2018
Fatal accidents locations in 2019
Fatal accidents locations in 2020
Fatal accidents locations in 2021
Alcohol use - People drinking some alcohol every month (%)
Alcohol use - People not drinking at all (%)
Alcohol use - Average days/month drinking alcohol
Alcohol use - Average drinks/week
Alcohol use - Average days/year people drink much
Audiometry - Average condition of hearing (%)
Audiometry - People that can hear a whisper from across a quiet room (%)
Audiometry - People that can hear normal voice from across a quiet room (%)
Audiometry - Ears ringing, roaring, buzzing (%)
Audiometry - Had a job exposure to loud noise (%)
Audiometry - Had off-work exposure to loud noise (%)
Blood Pressure & Cholesterol - Has high blood pressure (%)
Blood Pressure & Cholesterol - Checking blood pressure at home (%)
Blood Pressure & Cholesterol - Frequently checking blood cholesterol (%)
Blood Pressure & Cholesterol - Has high cholesterol level (%)
Consumer Behavior - Money monthly spent on food at supermarket/grocery store
Consumer Behavior - Money monthly spent on food at other stores
Consumer Behavior - Money monthly spent on eating out
Consumer Behavior - Money monthly spent on carryout/delivered foods
Consumer Behavior - Income spent on food at supermarket/grocery store (%)
Consumer Behavior - Income spent on food at other stores (%)
Consumer Behavior - Income spent on eating out (%)
Consumer Behavior - Income spent on carryout/delivered foods (%)
Current Health Status - General health condition (%)
Current Health Status - Blood donors (%)
Current Health Status - Has blood ever tested for HIV virus (%)
Current Health Status - Left-handed people (%)
Dermatology - People using sunscreen (%)
Diabetes - Diabetics (%)
Diabetes - Had a blood test for high blood sugar (%)
Diabetes - People taking insulin (%)
Diet Behavior & Nutrition - Diet health (%)
Diet Behavior & Nutrition - Milk product consumption (# of products/month)
Diet Behavior & Nutrition - Meals not home prepared (#/week)
Diet Behavior & Nutrition - Meals from fast food or pizza place (#/week)
Diet Behavior & Nutrition - Ready-to-eat foods (#/month)
Diet Behavior & Nutrition - Frozen meals/pizza (#/month)
Drug Use - People that ever used marijuana or hashish (%)
Drug Use - Ever used hard drugs (%)
Drug Use - Ever used any form of cocaine (%)
Drug Use - Ever used heroin (%)
Drug Use - Ever used methamphetamine (%)
Health Insurance - People covered by health insurance (%)
Kidney Conditions-Urology - Avg. # of times urinating at night
Medical Conditions - People with asthma (%)
Medical Conditions - People with anemia (%)
Medical Conditions - People with psoriasis (%)
Medical Conditions - People with overweight (%)
Medical Conditions - Elderly people having difficulties in thinking or remembering (%)
Medical Conditions - People who ever received blood transfusion (%)
Medical Conditions - People having trouble seeing even with glass/contacts (%)
Medical Conditions - People with arthritis (%)
Medical Conditions - People with gout (%)
Medical Conditions - People with congestive heart failure (%)
Medical Conditions - People with coronary heart disease (%)
Medical Conditions - People with angina pectoris (%)
Medical Conditions - People who ever had heart attack (%)
Medical Conditions - People who ever had stroke (%)
Medical Conditions - People with emphysema (%)
Medical Conditions - People with thyroid problem (%)
Medical Conditions - People with chronic bronchitis (%)
Medical Conditions - People with any liver condition (%)
Medical Conditions - People who ever had cancer or malignancy (%)
Mental Health - People who have little interest in doing things (%)
Mental Health - People feeling down, depressed, or hopeless (%)
Mental Health - People who have trouble sleeping or sleeping too much (%)
Mental Health - People feeling tired or having little energy (%)
Mental Health - People with poor appetite or overeating (%)
Mental Health - People feeling bad about themself (%)
Mental Health - People who have trouble concentrating on things (%)
Mental Health - People moving or speaking slowly or too fast (%)
Mental Health - People having thoughts they would be better off dead (%)
Oral Health - Average years since last visit a dentist
Oral Health - People embarrassed because of mouth (%)
Oral Health - People with gum disease (%)
Oral Health - General health of teeth and gums (%)
Oral Health - Average days a week using dental floss/device
Oral Health - Average days a week using mouthwash for dental problem
Oral Health - Average number of teeth
Pesticide Use - Households using pesticides to control insects (%)
Pesticide Use - Households using pesticides to kill weeds (%)
Physical Activity - People doing vigorous-intensity work activities (%)
Physical Activity - People doing moderate-intensity work activities (%)
Physical Activity - People walking or bicycling (%)
Physical Activity - People doing vigorous-intensity recreational activities (%)
Physical Activity - People doing moderate-intensity recreational activities (%)
Physical Activity - Average hours a day doing sedentary activities
Physical Activity - Average hours a day watching TV or videos
Physical Activity - Average hours a day using computer
Physical Functioning - People having limitations keeping them from working (%)
Physical Functioning - People limited in amount of work they can do (%)
Physical Functioning - People that need special equipment to walk (%)
Physical Functioning - People experiencing confusion/memory problems (%)
Physical Functioning - People requiring special healthcare equipment (%)
Prescription Medications - Average number of prescription medicines taking
Preventive Aspirin Use - Adults 40+ taking low-dose aspirin (%)
Reproductive Health - Vaginal deliveries (%)
Reproductive Health - Cesarean deliveries (%)
Reproductive Health - Deliveries resulted in a live birth (%)
Reproductive Health - Pregnancies resulted in a delivery (%)
Reproductive Health - Women breastfeeding newborns (%)
Reproductive Health - Women that had a hysterectomy (%)
Reproductive Health - Women that had both ovaries removed (%)
Reproductive Health - Women that have ever taken birth control pills (%)
Reproductive Health - Women taking birth control pills (%)
Reproductive Health - Women that have ever used Depo-Provera or injectables (%)
Reproductive Health - Women that have ever used female hormones (%)
Sexual Behavior - People 18+ that ever had sex (vaginal, anal, or oral) (%)
Sexual Behavior - Males 18+ that ever had vaginal sex with a woman (%)
Sexual Behavior - Males 18+ that ever performed oral sex on a woman (%)
Sexual Behavior - Males 18+ that ever had anal sex with a woman (%)
Sexual Behavior - Males 18+ that ever had any sex with a man (%)
Sexual Behavior - Females 18+ that ever had vaginal sex with a man (%)
Sexual Behavior - Females 18+ that ever performed oral sex on a man (%)
Sexual Behavior - Females 18+ that ever had anal sex with a man (%)
Sexual Behavior - Females 18+ that ever had any kind of sex with a woman (%)
Sexual Behavior - Average age people first had sex
Sexual Behavior - Average number of female sex partners in lifetime (males 18+)
Sexual Behavior - Average number of female vaginal sex partners in lifetime (males 18+)
Sexual Behavior - Average age people first performed oral sex on a woman (18+)
Sexual Behavior - Average number of woman performed oral sex on in lifetime (18+)
Sexual Behavior - Average number of male sex partners in lifetime (males 18+)
Sexual Behavior - Average number of male anal sex partners in lifetime (males 18+)
Sexual Behavior - Average age people first performed oral sex on a man (18+)
Sexual Behavior - Average number of male oral sex partners in lifetime (18+)
Sexual Behavior - People using protection when performing oral sex (%)
Sexual Behavior - Average number of times people have vaginal or anal sex a year
Sexual Behavior - People having sex without condom (%)
Sexual Behavior - Average number of male sex partners in lifetime (females 18+)
Sexual Behavior - Average number of male vaginal sex partners in lifetime (females 18+)
Sexual Behavior - Average number of female sex partners in lifetime (females 18+)
Sexual Behavior - Circumcised males 18+ (%)
Sleep Disorders - Average hours sleeping at night
Sleep Disorders - People that has trouble sleeping (%)
Smoking-Cigarette Use - People smoking cigarettes (%)
Taste & Smell - People 40+ having problems with smell (%)
Taste & Smell - People 40+ having problems with taste (%)
Taste & Smell - People 40+ that ever had wisdom teeth removed (%)
Taste & Smell - People 40+ that ever had tonsils teeth removed (%)
Taste & Smell - People 40+ that ever had a loss of consciousness because of a head injury (%)
Taste & Smell - People 40+ that ever had a broken nose or other serious injury to face or skull (%)
Taste & Smell - People 40+ that ever had two or more sinus infections (%)
Weight - Average height (inches)
Weight - Average weight (pounds)
Weight - Average BMI
Weight - People that are obese (%)
Weight - People that ever were obese (%)
Weight - People trying to lose weight (%)
According to our research of New York and other state lists, there were 4 registered sex offenders living in East Rochester, New York as of June 19, 2024 . The ratio of all residents to sex offenders in East Rochester is 1,666 to 1.The ratio of registered sex offenders to all residents in this city is lower than the state average.
Officers per 1,000 residents here:
1.23New York average:
3.42
Latest news from East Rochester, NY collected exclusively by city-data.com from local newspapers, TV, and radio stations
Ancestries: Italian (31.1%), American (21.9%), Irish (9.3%), German (2.8%), English (2.7%), Polish (2.4%).
Current Local Time:
Land area: 1.35 square miles.
Population density: 4,592 people per square mile (average).
275 residents are foreign born (1.8% Europe , 1.4% Latin America , 1.1% Asia ).
This village:
4.4%New York:
22.6%
Median real estate property taxes paid for housing units with mortgages in 2022: $4,879 (3.5%)Median real estate property taxes paid for housing units with no mortgage in 2022: $4,540 (3.3%)
Nearest city with pop. 50,000+: Rochester, NY
Nearest city with pop. 1,000,000+: Manhattan, NY
Nearest cities:
Latitude: 43.11 N, Longitude: 77.49 W
Daytime population change due to commuting: +510 (+8.1%)Workers who live and work in this village: 721 (21.1%)
Single-family new house construction building permits:
2010: 9 buildings , average cost: $148,9002009: 8 buildings , average cost: $178,0002008: 1 building , cost: $200,0002007: 4 buildings , average cost: $262,5002006: 15 buildings , average cost: $100,5002005: 2 buildings , average cost: $120,0002003: 1 building , cost: $40,0002002: 1 building , cost: $145,0002001: 1 building , cost: $375,0002000: 1 building , cost: $40,0001997: 1 building , cost: $100,000Unemployment in December 2023:
Most common occupations in East Rochester, NY (%)
Both Males Females
Other office and administrative support workers, including supervisors (5.2%)
Other management occupations, except farmers and farm managers (4.1%)
Secretaries and administrative assistants (3.7%)
Material recording, scheduling, dispatching, and distributing workers (3.6%)
Other sales and related occupations, including supervisors (3.6%)
Customer service representatives (3.4%)
Preschool, kindergarten, elementary, and middle school teachers (3.4%)
Material recording, scheduling, dispatching, and distributing workers (5.7%)
Building and grounds cleaning and maintenance occupations (5.2%)
Other management occupations, except farmers and farm managers (4.8%)
Vehicle and mobile equipment mechanics, installers, and repairers (4.4%)
Retail sales workers, except cashiers (3.5%)
Electrical equipment mechanics and other installation, maintenance, and repair workers, including supervisors (3.5%)
Other sales and related occupations, including supervisors (3.3%)
Other office and administrative support workers, including supervisors (7.6%)
Secretaries and administrative assistants (6.9%)
Health technologists and technicians (4.5%)
Preschool, kindergarten, elementary, and middle school teachers (4.2%)
Other teachers, instructors, education, training, and library occupations (3.9%)
Other sales and related occupations, including supervisors (3.8%)
Customer service representatives (3.8%)
Earthquake activity:
East Rochester-area historical earthquake activity is significantly above New York state average. It is 68% smaller than the overall U.S. average. On 10/7/1983 at 10:18:46, a magnitude 5.3 (5.1 MB, 5.3 LG, 5.1 ML, Class: Moderate, Intensity: VI - VII) earthquake occurred 168.1 miles away from East Rochester center On 9/25/1998 at 19:52:52, a magnitude 5.2 (4.8 MB, 4.3 MS, 5.2 LG, 4.5 MW, Depth: 3.1 mi) earthquake occurred 186.3 miles away from the city center On 4/20/2002 at 10:50:47, a magnitude 5.3 (5.3 ML, Depth: 3.0 mi) earthquake occurred 212.5 miles away from the city center On 4/20/2002 at 10:50:47, a magnitude 5.2 (5.2 MB, 4.2 MS, 5.2 MW, 5.0 MW) earthquake occurred 210.8 miles away from the city center On 8/23/2011 at 17:51:04, a magnitude 5.8 (5.8 MW, Depth: 3.7 mi) earthquake occurred 360.6 miles away from the city center On 1/31/1986 at 16:46:43, a magnitude 5.0 (5.0 MB) earthquake occurred 214.8 miles away from the city center Magnitude types: regional Lg-wave magnitude (LG), body-wave magnitude (MB), local magnitude (ML), surface-wave magnitude (MS), moment magnitude (MW) Natural disasters: The number of natural disasters in Monroe County (17) is near the US average (15).Major Disasters (Presidential) Declared: 10Emergencies Declared: 6Floods: 5, Storms: 5, Winter Storms: 3, Hurricanes: 2, Ice Storms: 2, Blizzard: 1, Power Outage: 1, Tropical Storm: 1, Wind: 1, Other: 2 (Note: some incidents may be assigned to more than one category). Hospitals and medical centers near East Rochester: PENFIELD PLACE (Nursing Home, about 2 miles away; PENFIELD, NY)
FMS-LIVING CENTER (Dialysis Facility, about 2 miles away; PITTSFORD, NY)
HIGHLANDS LIVING CENTER (Nursing Home, about 2 miles away; PITTSFORD, NY)
ROCHESTER FRIENDLY HOME (Nursing Home, about 3 miles away; ROCHESTER, NY)
THE FRIENDLY HOME (Nursing Home, about 3 miles away; ROCHESTER, NY)
FAIRPORT BAPTIST HOMES (Nursing Home, about 3 miles away; FAIRPORT, NY)
MARY CARIOLA CHILDREN'S CENTER, INC (Hospital, about 3 miles away; ROCHESTER, NY)
Amtrak station near East Rochester: 8 miles: ROCHESTER (320 CENTRAL AVE.) Services: ticket office, partially wheelchair accessible, enclosed waiting area, public restrooms, public payphones, vending machines, free short-term parking, call for car rental service, taxi stand, public transit connection.
Operable nuclear power plant near East Rochester:
8 miles: R.E. Ginna in Rochester, NY.
Colleges/universities with over 2000 students nearest to East Rochester:
Saint John Fisher College (about 2 miles; Rochester, NY ; Full-time enrollment: 3,373)
Nazareth College (about 2 miles; Rochester, NY ; FT enrollment: 2,632)
Monroe Community College (about 7 miles; Rochester, NY ; FT enrollment: 14,295)
University of Rochester (about 8 miles; Rochester, NY ; FT enrollment: 10,201)
Rochester Institute of Technology (about 10 miles; Rochester, NY ; FT enrollment: 14,177)
Finger Lakes Community College (about 21 miles; Canandaigua, NY ; FT enrollment: 4,732)
SUNY College at Brockport (about 25 miles; Brockport, NY ; FT enrollment: 7,398)
Public high school in East Rochester:
Public elementary/middle school in East Rochester:
See full list of schools located in East Rochester Library in East Rochester: EAST ROCHESTER PUBLIC LIBRARY Operating income: $201,919; Location: 111 WEST ELM STREET; 37,980 books ; 1,302 audio materials ; 2,073 video materials ; 13 local licensed databases ; 14 state licensed databases ; 51 print serial subscriptions )
Notable locations in East Rochester: (A) , East Rochester Public Library (B) , Village of East Rochester Courthouse (C) , East Rochester Village Offices (D) , East Rochester Fire Department (E) . Display/hide their locations on the map
Shopping Center: (1) . Display/hide its location on the map
Churches in East Rochester include: (A) , East Rochester United Methodist Church (B) , First Baptist Church (C) , First Community Church of East Rochester (D) , Trinity Evangelical Lutheran Church (E) , Koinonia Fellowship (F) , Reformed Presbyterian Church (G) , Saint Jerome's Church (H) . Display/hide their locations on the map
Parks in East Rochester include: (1) , Edmund-Lyon Park (2) . Display/hide their locations on the map
Monroe County has a predicted average indoor radon screening level between 2 and 4 pCi/L (pico curies per liter) - Moderate Potential Average household size: This village:
2.3 peopleNew York:
2.6 people
Percentage of family households: This village:
57.2%Whole state:
63.5%
Percentage of households with unmarried partners: This village:
10.0%Whole state:
6.8%
Likely homosexual households (counted as self-reported same-sex unmarried-partner households)
Lesbian couples: 0.3% of all households Gay men: 0.2% of all households
89 people in group homes intended for adults in 2010people in homes for the mentally ill in 2000people in homes for the mentally retarded in 2000
Banks with branches in East Rochester (2011 data):
HSBC Bank USA, National Association: Country Club Branch at 825 Fairport Rd, branch established on 1896/01/01. Info updated 2010/11/30: Bank assets: $206,009.7 mil, Deposits: $149,026.8 mil, headquarters in Mc Lean, VA, positive income , 474 total offices , Holding Company: Hsbc Holdings Plc
Manufacturers and Traders Trust Company: Country Club Branch at 849 Fairport Road, branch established on 1971/05/10. Info updated 2011/08/08: Bank assets: $76,887.1 mil, Deposits: $60,064.2 mil, headquarters in Buffalo, NY, positive income , Commercial Lending Specialization, 808 total offices , Holding Company: M&T Bank Corporation
JPMorgan Chase Bank, National Association: Fairport Road Branch at 865 Fairport Road, branch established on 1962/12/13. Info updated 2011/11/10: Bank assets: $1,811,678.0 mil, Deposits: $1,190,738.0 mil, headquarters in Columbus, OH, positive income , International Specialization, 5577 total offices , Holding Company: Jpmorgan Chase & Co.
For population 15 years and over in East Rochester:
Never married: 38.1%Now married: 39.5%Separated: 4.0%Widowed: 4.0%Divorced: 14.4% For population 25 years and over in East Rochester:
High school or higher: 90.7%Bachelor's degree or higher: 32.1%Graduate or professional degree: 10.5%Unemployed: 5.0%Mean travel time to work (commute): 13.8 minutes
Education Gini index (Inequality in education) Here:
9.7New York average:
13.9
Religion statistics for East Rochester, NY (based on Monroe County data)
Religion Adherents Congregations Catholic 191,112 65 Evangelical Protestant 60,385 240 Mainline Protestant 53,463 151 Other 28,550 74 Black Protestant 9,459 30 Orthodox 2,038 11 None 399,337 -
Source: Clifford Grammich, Kirk Hadaway, Richard Houseal, Dale E.Jones, Alexei Krindatch, Richie Stanley and Richard H.Taylor. 2012. 2010 U.S.Religion Census: Religious Congregations & Membership Study. Association of Statisticians of American Religious Bodies. Jones, Dale E., et al. 2002. Congregations and Membership in the United States 2000. Nashville, TN: Glenmary Research Center. Graphs represent county-level data
Food Environment Statistics: Number of grocery stores : 175Monroe County :
2.39 / 10,000 pop.New York :
4.13 / 10,000 pop.
Number of supercenters and club stores : 7This county :
0.10 / 10,000 pop.New York :
0.06 / 10,000 pop.
Number of convenience stores (no gas) : 70Monroe County :
0.96 / 10,000 pop.New York :
0.92 / 10,000 pop.
Number of convenience stores (with gas) : 170This county :
2.32 / 10,000 pop.New York :
1.68 / 10,000 pop.
Number of full-service restaurants : 552Monroe County :
7.54 / 10,000 pop.New York :
8.82 / 10,000 pop.
Adult obesity rate : Monroe County :
26.4%New York :
23.8%
Low-income preschool obesity rate : Health and Nutrition: Healthy diet rate : East Rochester:
48.8%State:
50.1%
Average overall health of teeth and gums : East Rochester:
46.1%New York:
48.1%
Average BMI : East Rochester:
28.7New York:
28.5
People feeling badly about themselves : East Rochester:
22.4%State:
20.3%
People not drinking alcohol at all : Average hours sleeping at night : This city:
6.8New York:
6.8
Overweight people : East Rochester:
34.3%New York:
33.4%
General health condition : This city:
55.7%New York:
56.5%
Average condition of hearing : East Rochester:
78.3%New York:
80.2%
More about Health and Nutrition of East Rochester, NY Residents
Local government employment and payroll (March 2022)
Function
Full-time employees
Monthly full-time payroll
Average yearly full-time wage
Part-time employees
Monthly part-time payroll
Solid Waste Management
19 $201,804 $127,455 0 $0 Parks and Recreation
19 $100,902 $63,728 3 $1,732 Police Protection - Officers
9 $94,966 $126,621 5 $16,930 Financial Administration
5 $23,688 $56,851 0 $0 Other Government Administration
4 $21,284 $63,852 11 $6,944 Other and Unallocable
2 $8,106 $48,636 2 $4,552 Judicial and Legal
2 $8,374 $50,244 3 $4,327 Local Libraries
1 $4,190 $50,280 9 $11,266 Police - Other
1 $7,058 $84,696 7 $8,353 Welfare
0 $0 1 $818
Totals for Government
62 $470,372 $91,040 41 $54,923
East Rochester government finances - Expenditure in 2021 (per resident):
Construction - General - Other: $193,000 ($31.06)
Solid Waste Management: $188,000 ($30.26)General Public Buildings: $2,000 ($0.32)Current Operations - General - Other: $2,881,000 ($463.71)
Police Protection: $1,276,000 ($205.38)Regular Highways: $800,000 ($128.76)Solid Waste Management: $653,000 ($105.10)Financial Administration: $294,000 ($47.32)General Public Buildings: $243,000 ($39.11)Parks and Recreation: $239,000 ($38.47)Judicial and Legal Services: $219,000 ($35.25)Libraries: $215,000 ($34.60)Local Fire Protection: $210,000 ($33.80)Sewerage: $188,000 ($30.26)Protective Inspection and Regulation - Other: $176,000 ($28.33)Central Staff Services: $153,000 ($24.63)Parking Facilities: $18,000 ($2.90)General - Interest on Debt: $390,000 ($62.77)
Intergovernmental to Local - Other - Financial Administration: $5,000 ($0.80)
Other Capital Outlay - Local Fire Protection: $297,000 ($47.80)
General - Other: $82,000 ($13.20)Police Protection: $37,000 ($5.96)Protective Inspection and Regulation - Other: $8,000 ($1.29)Total Salaries and Wages: $3,423,000 ($550.94)
East Rochester government finances - Revenue in 2021 (per resident):
Charges - Solid Waste Management: $791,000 ($127.31)
Other: $127,000 ($20.44)Parks and Recreation: $22,000 ($3.54)Sewerage: $15,000 ($2.41)Federal Intergovernmental - Other: $601,000 ($96.73)
Local Intergovernmental - General Local Government Support: $1,719,000 ($276.68)
Other: $231,000 ($37.18)Highways: $12,000 ($1.93)Miscellaneous - General Revenue - Other: $525,000 ($84.50)
Rents: $112,000 ($18.03)Fines and Forfeits: $35,000 ($5.63)Interest Earnings: $4,000 ($0.64)State Intergovernmental - Other: $291,000 ($46.84)
Highways: $108,000 ($17.38)Tax - Property: $4,927,000 ($793.01)
Other License: $212,000 ($34.12)Public Utilities Sales: $127,000 ($20.44)
East Rochester government finances - Debt in 2021 (per resident):
Long Term Debt - Beginning Outstanding - Unspecified Public Purpose: $6,475,000 ($1042.17)
Outstanding Unspecified Public Purpose: $6,065,000 ($976.18)Retired Unspecified Public Purpose: $410,000 ($65.99)
East Rochester government finances - Cash and Securities in 2021 (per resident):
Bond Funds - Cash and Securities: $4,000 ($0.64)
Other Funds - Cash and Securities: $4,405,000 ($709.00)
3.45% of this county's 2021 resident taxpayers lived in other counties in 2020 ($64,907 average adjusted gross income )
Here:
3.45%New York average:
5.29%
0.01% of residents moved from foreign countries ($70 average AGI )Monroe County:
0.01%New York average:
0.01%
Top counties from which taxpayers relocated into this county between 2020 and 2021:
4.11% of this county's 2020 resident taxpayers moved to other counties in 2021 ($66,936 average adjusted gross income )
Here:
4.11%New York average:
6.93%
0.01% of residents moved to foreign countries ($84 average AGI )Monroe County:
0.01%New York average:
0.02%
Top counties to which taxpayers relocated from this county between 2020 and 2021:
Businesses in East Rochester, NY
Name Count Name Count
Burger King 1 Papa John's Pizza 1 Cricket Wireless 1 Rite Aid 1 FedEx 1 Tim Hortons 1 Ford 1 U-Haul 1 Nike 1 UPS 1 Nissan 1 Volkswagen 1
Strongest AM radio stations in East Rochester:
WHAM (1180 AM; 50 kW; ROCHESTER, NY; Owner: CITICASTERS LICENSES, L.P.)
WXXI (1370 AM; 5 kW; ROCHESTER, NY; Owner: WXXI PUBLIC BROADCASTING COUNCIL)
WHIC (1460 AM; 5 kW; ROCHESTER, NY; Owner: HOLY FAMILY COMMUNICATIONS)
WHTK (1280 AM; 5 kW; ROCHESTER, NY)
WROC (950 AM; 1 kW; ROCHESTER, NY)
WLGZ (990 AM; 5 kW; ROCHESTER, NY; Owner: KIMTRON, INC.)
WACK (1420 AM; 5 kW; NEWARK, NY; Owner: PEMBROOK PINES, INC.)
WWKB (1520 AM; 50 kW; BUFFALO, NY; Owner: ENTERCOM BUFFALO LICENSE, LLC)
WYSL (1040 AM; 2 kW; AVON, NY; Owner: RADIO LIVINGSTON, LTD)
WRSB (1310 AM; 1 kW; CANANDAIGUA, NY; Owner: DAVID WOLFE)
WABH (1380 AM; 10 kW; BATH, NY)
WTOR (770 AM; daytime; 9 kW; YOUNGSTOWN, NY; Owner: BIRACH BROADCASTING CORPORATION)
WGY (810 AM; 50 kW; SCHENECTADY, NY; Owner: CLEAR CHANNEL BROADCASTING LICENSES, INC.)
Strongest FM radio stations in East Rochester:
WBEE-FM (92.5 FM; ROCHESTER, NY; Owner: ENTERCOM ROCHESTER LICENSE, LLC.)
WBBF-FM (93.3 FM; FAIRPORT, NY; Owner: ENTERCOM ROCHESTER LICENSE, LLC.)
WCMF-FM (96.5 FM; ROCHESTER, NY; Owner: INFINITY RADIO OPERATIONS INC.)
WXXI-FM (91.5 FM; ROCHESTER, NY; Owner: WXXI PUBLIC BROADCASTING COUNCIL)
W238AB (95.5 FM; ROCHESTER, NY; Owner: CITICASTERS LICENSES, L.P.)
WPXY-FM (97.9 FM; ROCHESTER, NY; Owner: INFINITY RADIO OPERATIONS INC.)
WZNE (94.1 FM; BRIGHTON, NY; Owner: INFINITY RADIO OPERATIONS INC.)
WDKX (103.9 FM; ROCHESTER, NY; Owner: MONROE COUNTY BROADCASTING CO., LTD.)
WZXV (99.7 FM; PALMYRA, NY; Owner: CALVARY CHAPEL OF FINGER LAKES, INC.)
WVOR-FM (100.5 FM; ROCHESTER, NY; Owner: CITICASTERS LICENSES, L.P.)
WBER (90.5 FM; ROCHESTER, NY; Owner: MONROE B.O.C.E.S. #1)
WRMM-FM (101.3 FM; ROCHESTER, NY; Owner: INFINITY RADIO OPERATIONS INC.)
WRUR-FM (88.5 FM; ROCHESTER, NY; Owner: UNIVERSITY OF ROCHESTER B/CAST CORP.)
WBZA (98.9 FM; ROCHESTER, NY; Owner: ENTERCOM ROCHESTER LICENSE, LLC.)
WDCZ-FM (102.7 FM; WEBSTER, NY; Owner: KIMTRON, INC.)
WKGS (106.7 FM; IRONDEQUOIT, NY; Owner: CITICASTERS LICENSES, L.P.)
WJZR (105.9 FM; ROCHESTER, NY; Owner: NORTH COAST RADIO, INC.)
WISY (102.3 FM; CANANDAIGUA, NY; Owner: CITICASTERS LICENSES, L.P.)
WCIY (88.9 FM; CANANDAIGUA, NY; Owner: FAMILY LIFE MINISTRIES, INC.)
WFXF (107.3 FM; SOUTH BRISTOL TOWNSH, NY; Owner: CITICASTERS LICENSES, L.P.)
TV broadcast stations around East Rochester:
WBGT-LP (Channel 40; ROCHESTER, NY; Owner: WBGT, LLC)
WBXO-LP (Channel 15; ROCHESTER, NY; Owner: METRO TV, INC.)
WUHF (Channel 31; ROCHESTER, NY; Owner: WUHF LICENSEE, LLC)
WOKR (Channel 13; ROCHESTER, NY; Owner: CENTRAL NY NEWS, INC.)
WHEC-TV (Channel 10; ROCHESTER, NY; Owner: WHEC-TV, LLC)
WROC-TV (Channel 8; ROCHESTER, NY; Owner: NEXSTAR BROADCASTING OF ROCHESTER, LLC)
WXXI-TV (Channel 21; ROCHESTER, NY; Owner: WXXI PUBLIC BROADCASTING COUNCIL)
W42CO (Channel 42; ROCHESTER, NY; Owner: TRI-STATE CHRISTIAN TV, INC.)
W26BZ (Channel 26; VICTOR, NY; Owner: WBGT, LLC)
WAWW-LP (Channel 38; ROCHESTER, NY; Owner: VENTURE TECHNOLOGIES GROUP, LLC)
WROH-LP (Channel 47; ROCHESTER, NY; Owner: TIGER EYE BROADCASTING CORPORATION)
WPXJ-TV (Channel 51; BATAVIA, NY; Owner: PAXSON BUFFALO LICENSE, INC.)
WGCE-CA (Channel 6; GREECE/ROCHESTER, NY; Owner: SALVATORE J. CATERINO)
FCC Registered Antenna Towers: 5
Edward G Roach, 1617 Creek Street (Lat: 43.164556 Lon: -77.509944), Type: 60.6, Overall height: 60.6 m, Registrant: Sba Towers, Inc., Eroach@sbasite.Com, , Boca -Raton, Phone: (561) 995-7670 Edward G Roach, 1617 Creek Street (Lat: 43.164556 Lon: -77.509944), Type: 60.6, Overall height: 60.6 m, Registrant: Sba Towers, Inc., Eroach@sbasite.Com, , Boca -Raton, Phone: (561) 995-7670 RICHARD J VERDOUW, West Ivy Street (Lat: 43.108611 Lon: -77.491389), Type: 14.9, Overall height: 14.9 m, Registrant: United States Licensing, Gary@4fcchelp.Com, , Roche-ster, Phone: (585) 621-4599 RICHARD J VERDOUW, West Ivy Street (Lat: 43.108611 Lon: -77.491389), Type: 14.9, Overall height: 14.9 m, Registrant: United States Licensing, Gary@4fcchelp.Com, , Roche-ster, Phone: (585) 621-4599 Edward G Roach, 1617 Creek Street (Lat: 43.164556 Lon: -77.509944), Type: 60.6, Structure height: 36055 m, Overall height: 60.6 m, Registrant: Sba Towers, LLC, Eroach@sbasite.Com, , Boca -Raton, Phone: (561) 995-7670 FCC Registered Commercial Land Mobile Towers: 1
Lat: 43.114778 Lon: -77.486667, Call Sign: KC23206, Assigned Frequencies: 450.600 MHz, 455.600 MHz, Grant Date: 05/21/1992, Expiration Date: 06/01/2030, Registrant: Iheartmedia, Inc., 7136 S. Yale Avenue, Suite 501, Tulsa, OK 74136, Phone: (918) 664-4581, Fax: (918) 664-3066, Email:
FCC Registered Broadcast Land Mobile Towers: 5
BASE, 415 E Main St (Lat: 43.113667 Lon: -77.491389), Type: Mast, Structure height: 18 m, Overall height: 20 m, Call Sign: KNCV360, Assigned Frequencies: 154.175 MHz, 154.250 MHz, 154.310 MHz, 154.385 MHz, 156.232 MHz, 155.392 MHz, Grant Date: 12/18/2013, Expiration Date: 03/15/2024, Registrant: Universal Licensing Service, 4401-A Connecticut Ave Nw #232, Washington, DC 20008, Phone: (877) 677-3639, Fax: (949) 209-3097, Email:
533 W Commercial St (Lat: 43.116167 Lon: -77.499167), Call Sign: KBM735, Licensee ID: L00057426, Assigned Frequencies: 151.565 MHz, Grant Date: 10/20/1998, Expiration Date: 12/13/2003, Cancellation Date: 10/27/2003, Registrant: Penfield Plumbing And Heating Inc, 533 W Commercial St, East Rochester, NY 14445 Marsh Rd Sta 117 (Lat: 43.099500 Lon: -77.480556), Type: Pipe, Structure height: 6 m, Call Sign: WCH885, Assigned Frequencies: 173.203 MHz, 173.396 MHz, Grant Date: 03/08/2022, Expiration Date: 01/10/2032, Registrant: Utilities Technology Council, 2550 South Clark St., Suite 960, Arlington, VA 22202, Phone: (202) 833-6818, Fax: (202) 872-1331, Email:
125 N. Washington Street (Lat: 43.117806 Lon: -77.488111), Type: Upole, Structure height: 9.1 m, Call Sign: WPXV576, Assigned Frequencies: 173.396 MHz, Grant Date: 04/14/2023, Expiration Date: 06/17/2033, Certifier: Donald H Regoord, Registrant: Utilities Technology Council, 2550 South Clark St., Suite 960, Arlington, VA 22202, Phone: (203) 833-6818, Email:
200 Woodbine Ave (Lat: 43.107194 Lon: -77.492889), Type: Mast, Structure height: 9.1 m, Overall height: 10.7 m, Call Sign: WQWE431, Assigned Frequencies: 72.1400 MHz, Grant Date: 07/30/2015, Expiration Date: 07/30/2025, Certifier: Jose Correa, Registrant: Primex Wireless Inc, 965 Wells St., Lake Geneva, WI 53147, Phone: (800) 537-0464 FCC Registered Microwave Towers: 3
NY-ROC043A, 1617 Creek Street (Lat: 43.164556 Lon: -77.509944), Type: Tower, Structure height: 60.6 m, Call Sign: WQHY485, Assigned Frequencies: 11265.0 MHz, 11225.0 MHz, Grant Date: 11/30/2007, Expiration Date: 11/30/2017, Cancellation Date: 05/12/2017, Certifier: Nadja Sodos-Wallace, Registrant: Sprint Corporation, 12502 Sunrise Valley Drive, M/S: Varesa0209, Reston, VA 20196, Phone: (800) 572-8256, Fax: (703) 433-4483, Email:
NY-ROC079A, Corner Of West Maple Avenue And Garfield Street (Lat: 43.115111 Lon: -77.486472), Type: Tank, Structure height: 56.7 m, Call Sign: WQMF441, Assigned Frequencies: 11015.0 MHz, 10735.0 MHz, 10735.0 MHz, 11095.0 MHz, 10815.0 MHz, 10815.0 MHz, Grant Date: 07/23/2010, Expiration Date: 07/23/2020, Cancellation Date: 05/12/2017, Certifier: Nadja S Sodos-Wallace, Registrant: Sprint Corporation, 12502 Sunrise Valley Drive, M/S: Varesa0209, Reston, VA 20196, Phone: (800) 572-8256, Fax: (703) 433-4483, Email:
EAST ROCHESTER, 104 Garfield Street (Lat: 43.114778 Lon: -77.486917), Overall height: 58.5 m, Call Sign: WLU901, Assigned Frequencies: 18605.0 MHz, Grant Date: 03/06/2001, Expiration Date: 02/01/2011, Cancellation Date: 06/03/2010, Certifier: Carol L Tacker, Registrant: At&t Mobility LLC, 1120 20th Street, Nw, Suite 1000, Washington, DC 20036, Phone: (202) 457-2055, Fax: (202) 457-3074, Email:
FCC Registered Amateur Radio Licenses: 41 (
See the full list of FCC Registered Amateur Radio Licenses in East Rochester )
FAA Registered Aircraft: 1
Aircraft: PIPER PA-23-250 (Category: Land, Engines: 2, Seats: 6, Weight: Up to 12,499 Pounds, Speed: 150 mph), Engine: LYCOMING IO-540 SER (300 HP) (Reciprocating)N-Number: 101HH, N101HH, N-101HH, Serial Number: 27-8054057, Year manufactured: 1980, Airworthiness Date: 06/18/1980, Certificate Issue Date: 04/01/1997Registrant (LLC): Elmhurst Holdings LLC, 349 W Commercial St Ste 3300, East Rochester, NY 14445
Home Mortgage Disclosure Act Aggregated Statistics For Year 2009(Based on 2 full tracts) A) FHA, FSA/RHS & VA B) Conventional C) Refinancings D) Home Improvement Loans F) Non-occupant Loans on G) Loans On Manufactured Number Average Value Number Average Value Number Average Value Number Average Value Number Average Value Number Average Value
LOANS ORIGINATED 45 $91,111 30 $84,300 57 $80,368 19 $14,316 8 $61,875 0 $0 APPLICATIONS APPROVED, NOT ACCEPTED 6 $97,000 1 $75,000 7 $78,000 0 $0 2 $76,000 0 $0 APPLICATIONS DENIED 5 $94,800 1 $95,000 35 $88,800 12 $13,083 8 $62,625 1 $143,000 APPLICATIONS WITHDRAWN 2 $83,500 3 $86,667 25 $90,440 4 $41,500 3 $66,000 0 $0 FILES CLOSED FOR INCOMPLETENESS 1 $42,000 1 $52,000 6 $83,333 3 $45,000 2 $66,000 0 $0
Aggregated Statistics For Year 2008(Based on 2 full tracts) A) FHA, FSA/RHS & VA B) Conventional C) Refinancings D) Home Improvement Loans E) Loans on Dwellings For 5+ Families F) Non-occupant Loans on Number Average Value Number Average Value Number Average Value Number Average Value Number Average Value Number Average Value
LOANS ORIGINATED 49 $92,816 50 $73,880 38 $75,974 14 $18,500 1 $550,000 17 $70,118 APPLICATIONS APPROVED, NOT ACCEPTED 3 $77,333 2 $72,500 6 $77,667 6 $8,333 0 $0 1 $99,000 APPLICATIONS DENIED 12 $91,000 11 $66,545 47 $84,532 11 $17,636 1 $200,000 5 $68,200 APPLICATIONS WITHDRAWN 2 $100,000 3 $135,333 16 $73,562 4 $63,250 0 $0 0 $0 FILES CLOSED FOR INCOMPLETENESS 3 $104,333 0 $0 2 $132,000 1 $20,000 0 $0 0 $0
Aggregated Statistics For Year 2007(Based on 2 full tracts) A) FHA, FSA/RHS & VA B) Conventional C) Refinancings D) Home Improvement Loans E) Loans on Dwellings For 5+ Families F) Non-occupant Loans on Number Average Value Number Average Value Number Average Value Number Average Value Number Average Value Number Average Value
LOANS ORIGINATED 31 $88,484 81 $74,296 56 $77,875 21 $25,619 0 $0 29 $69,793 APPLICATIONS APPROVED, NOT ACCEPTED 0 $0 9 $59,889 9 $74,889 5 $12,400 1 $145,000 5 $55,200 APPLICATIONS DENIED 11 $88,000 18 $63,889 76 $69,868 25 $32,200 0 $0 12 $79,833 APPLICATIONS WITHDRAWN 3 $82,333 5 $88,000 45 $83,511 1 $5,000 0 $0 3 $91,667 FILES CLOSED FOR INCOMPLETENESS 1 $81,000 1 $87,000 10 $96,100 0 $0 0 $0 0 $0
Aggregated Statistics For Year 2006(Based on 2 full tracts) A) FHA, FSA/RHS & VA B) Conventional C) Refinancings D) Home Improvement Loans F) Non-occupant Loans on G) Loans On Manufactured Number Average Value Number Average Value Number Average Value Number Average Value Number Average Value Number Average Value
LOANS ORIGINATED 30 $90,300 92 $69,380 61 $65,230 17 $12,412 17 $73,059 0 $0 APPLICATIONS APPROVED, NOT ACCEPTED 1 $92,000 8 $50,500 22 $80,727 3 $8,333 3 $88,333 1 $36,000 APPLICATIONS DENIED 5 $92,000 17 $70,765 73 $80,548 28 $23,179 7 $62,000 2 $17,000 APPLICATIONS WITHDRAWN 2 $93,000 7 $87,571 41 $72,049 5 $25,400 4 $71,000 0 $0 FILES CLOSED FOR INCOMPLETENESS 0 $0 4 $62,250 10 $87,200 2 $46,500 2 $40,500 0 $0
Aggregated Statistics For Year 2005(Based on 2 full tracts) A) FHA, FSA/RHS & VA B) Conventional C) Refinancings D) Home Improvement Loans F) Non-occupant Loans on G) Loans On Manufactured Number Average Value Number Average Value Number Average Value Number Average Value Number Average Value Number Average Value
LOANS ORIGINATED 20 $79,450 88 $71,420 96 $65,740 30 $17,333 27 $71,111 1 $12,000 APPLICATIONS APPROVED, NOT ACCEPTED 0 $0 6 $69,333 16 $64,625 7 $21,714 4 $74,750 0 $0 APPLICATIONS DENIED 2 $99,000 14 $60,929 100 $68,930 33 $23,697 12 $46,250 0 $0 APPLICATIONS WITHDRAWN 1 $75,000 18 $54,667 40 $71,125 5 $36,000 6 $48,000 0 $0 FILES CLOSED FOR INCOMPLETENESS 0 $0 4 $56,250 22 $83,682 1 $170,000 1 $78,000 0 $0
Aggregated Statistics For Year 2004(Based on 2 full tracts) A) FHA, FSA/RHS & VA B) Conventional C) Refinancings D) Home Improvement Loans E) Loans on Dwellings For 5+ Families F) Non-occupant Loans on Number Average Value Number Average Value Number Average Value Number Average Value Number Average Value Number Average Value
LOANS ORIGINATED 25 $80,000 97 $73,103 86 $66,244 20 $16,450 2 $168,500 31 $68,871 APPLICATIONS APPROVED, NOT ACCEPTED 0 $0 7 $68,571 17 $78,294 5 $29,800 0 $0 1 $70,000 APPLICATIONS DENIED 3 $135,000 8 $70,125 98 $68,510 23 $18,739 0 $0 3 $46,000 APPLICATIONS WITHDRAWN 0 $0 4 $73,000 67 $76,821 5 $64,600 0 $0 2 $55,500 FILES CLOSED FOR INCOMPLETENESS 2 $117,500 1 $85,000 34 $85,647 2 $35,000 0 $0 2 $87,000
Aggregated Statistics For Year 2003(Based on 2 full tracts) A) FHA, FSA/RHS & VA B) Conventional C) Refinancings D) Home Improvement Loans E) Loans on Dwellings For 5+ Families F) Non-occupant Loans on Number Average Value Number Average Value Number Average Value Number Average Value Number Average Value Number Average Value
LOANS ORIGINATED 32 $78,625 76 $74,461 199 $65,171 16 $15,500 0 $0 38 $69,263 APPLICATIONS APPROVED, NOT ACCEPTED 2 $65,500 7 $65,286 21 $60,571 6 $13,000 0 $0 3 $76,333 APPLICATIONS DENIED 3 $73,667 14 $53,643 104 $73,135 19 $11,474 1 $380,000 4 $42,250 APPLICATIONS WITHDRAWN 2 $107,000 7 $66,286 52 $80,173 4 $15,250 0 $0 5 $60,000 FILES CLOSED FOR INCOMPLETENESS 1 $65,000 3 $83,333 3 $69,000 2 $9,000 0 $0 0 $0
Aggregated Statistics For Year 2002(Based on 2 full tracts) A) FHA, FSA/RHS & VA B) Conventional C) Refinancings D) Home Improvement Loans F) Non-occupant Loans on Number Average Value Number Average Value Number Average Value Number Average Value Number Average Value
LOANS ORIGINATED 46 $73,717 62 $63,339 95 $64,358 16 $12,875 27 $60,259 APPLICATIONS APPROVED, NOT ACCEPTED 1 $82,000 9 $60,556 24 $65,917 3 $8,333 3 $62,333 APPLICATIONS DENIED 2 $76,500 11 $57,909 77 $68,208 15 $8,133 5 $58,400 APPLICATIONS WITHDRAWN 1 $77,000 8 $91,375 42 $67,786 2 $18,000 1 $83,000 FILES CLOSED FOR INCOMPLETENESS 0 $0 1 $100,000 16 $80,938 0 $0 3 $61,000
Aggregated Statistics For Year 2001(Based on 2 full tracts) A) FHA, FSA/RHS & VA B) Conventional C) Refinancings D) Home Improvement Loans F) Non-occupant Loans on Number Average Value Number Average Value Number Average Value Number Average Value Number Average Value
LOANS ORIGINATED 48 $64,875 67 $65,940 81 $58,815 21 $8,429 17 $63,588 APPLICATIONS APPROVED, NOT ACCEPTED 1 $51,000 3 $105,000 14 $58,500 6 $11,333 0 $0 APPLICATIONS DENIED 4 $58,500 10 $59,300 81 $59,901 12 $11,750 3 $46,667 APPLICATIONS WITHDRAWN 3 $85,333 0 $0 50 $63,720 9 $26,222 0 $0 FILES CLOSED FOR INCOMPLETENESS 2 $71,500 1 $60,000 7 $88,429 1 $10,000 0 $0
Aggregated Statistics For Year 2000(Based on 2 full tracts) A) FHA, FSA/RHS & VA B) Conventional C) Refinancings D) Home Improvement Loans F) Non-occupant Loans on Number Average Value Number Average Value Number Average Value Number Average Value Number Average Value
LOANS ORIGINATED 37 $68,676 50 $56,940 33 $54,606 24 $16,458 9 $55,778 APPLICATIONS APPROVED, NOT ACCEPTED 0 $0 3 $61,333 11 $54,455 9 $11,556 0 $0 APPLICATIONS DENIED 7 $75,000 7 $56,000 54 $46,426 16 $23,750 3 $42,333 APPLICATIONS WITHDRAWN 2 $94,000 7 $56,286 20 $58,000 3 $46,333 0 $0 FILES CLOSED FOR INCOMPLETENESS 2 $33,000 3 $51,000 6 $58,000 0 $0 0 $0
Aggregated Statistics For Year 1999(Based on 2 partial tracts) A) FHA, FSA/RHS & VA B) Conventional C) Refinancings D) Home Improvement Loans F) Non-occupant Loans on Number Average Value Number Average Value Number Average Value Number Average Value Number Average Value
LOANS ORIGINATED 41 $71,636 42 $61,713 64 $53,815 18 $12,932 7 $50,031 APPLICATIONS APPROVED, NOT ACCEPTED 1 $71,420 2 $57,185 20 $60,824 6 $6,293 0 $0 APPLICATIONS DENIED 7 $59,699 9 $52,998 48 $59,070 13 $13,623 1 $53,560 APPLICATIONS WITHDRAWN 4 $73,315 6 $64,290 23 $54,055 2 $7,540 0 $0 FILES CLOSED FOR INCOMPLETENESS 0 $0 0 $0 9 $67,733 1 $14,210 0 $0
Detailed HMDA statistics for the following Tracts:
0120.00
, 0121.00
Private Mortgage Insurance Companies Aggregated Statistics For Year 2009(Based on 2 full tracts) A) Conventional B) Refinancings Number Average Value Number Average Value
LOANS ORIGINATED 5 $75,000 2 $92,000 APPLICATIONS APPROVED, NOT ACCEPTED 0 $0 1 $92,000 APPLICATIONS DENIED 2 $89,000 0 $0 APPLICATIONS WITHDRAWN 0 $0 1 $106,000 FILES CLOSED FOR INCOMPLETENESS 0 $0 0 $0
Aggregated Statistics For Year 2008(Based on 2 full tracts) A) Conventional B) Refinancings C) Non-occupant Loans on Number Average Value Number Average Value Number Average Value
LOANS ORIGINATED 25 $77,320 6 $89,667 3 $63,000 APPLICATIONS APPROVED, NOT ACCEPTED 5 $64,200 4 $123,250 2 $51,000 APPLICATIONS DENIED 1 $84,000 0 $0 0 $0 APPLICATIONS WITHDRAWN 1 $70,000 0 $0 0 $0 FILES CLOSED FOR INCOMPLETENESS 0 $0 0 $0 0 $0
Aggregated Statistics For Year 2007(Based on 2 full tracts) A) Conventional B) Refinancings C) Non-occupant Loans on Number Average Value Number Average Value Number Average Value
LOANS ORIGINATED 31 $78,226 8 $88,000 2 $100,000 APPLICATIONS APPROVED, NOT ACCEPTED 4 $75,250 5 $100,400 0 $0 APPLICATIONS DENIED 1 $61,000 1 $81,000 1 $61,000 APPLICATIONS WITHDRAWN 2 $73,500 1 $82,000 0 $0 FILES CLOSED FOR INCOMPLETENESS 0 $0 0 $0 0 $0
Aggregated Statistics For Year 2006(Based on 2 full tracts) A) Conventional B) Refinancings C) Non-occupant Loans on Number Average Value Number Average Value Number Average Value
LOANS ORIGINATED 31 $76,839 6 $86,500 2 $64,000 APPLICATIONS APPROVED, NOT ACCEPTED 7 $78,000 1 $59,000 1 $50,000 APPLICATIONS DENIED 0 $0 1 $77,000 1 $77,000 APPLICATIONS WITHDRAWN 1 $75,000 1 $109,000 1 $75,000 FILES CLOSED FOR INCOMPLETENESS 0 $0 1 $60,000 1 $60,000
Aggregated Statistics For Year 2005(Based on 2 full tracts) A) Conventional B) Refinancings C) Non-occupant Loans on Number Average Value Number Average Value Number Average Value
LOANS ORIGINATED 28 $85,143 13 $90,692 5 $88,400 APPLICATIONS APPROVED, NOT ACCEPTED 5 $100,200 4 $67,500 1 $35,000 APPLICATIONS DENIED 0 $0 0 $0 0 $0 APPLICATIONS WITHDRAWN 1 $57,000 0 $0 0 $0 FILES CLOSED FOR INCOMPLETENESS 0 $0 0 $0 0 $0
Aggregated Statistics For Year 2004(Based on 2 full tracts) A) Conventional B) Refinancings C) Non-occupant Loans on Number Average Value Number Average Value Number Average Value
LOANS ORIGINATED 46 $81,413 12 $83,333 9 $84,778 APPLICATIONS APPROVED, NOT ACCEPTED 6 $73,167 4 $85,250 1 $70,000 APPLICATIONS DENIED 1 $71,000 0 $0 1 $71,000 APPLICATIONS WITHDRAWN 0 $0 0 $0 0 $0 FILES CLOSED FOR INCOMPLETENESS 0 $0 0 $0 0 $0
Aggregated Statistics For Year 2003(Based on 2 full tracts) A) Conventional B) Refinancings C) Non-occupant Loans on Number Average Value Number Average Value Number Average Value
LOANS ORIGINATED 40 $75,300 23 $76,957 5 $61,200 APPLICATIONS APPROVED, NOT ACCEPTED 4 $74,500 4 $71,750 1 $83,000 APPLICATIONS DENIED 0 $0 0 $0 0 $0 APPLICATIONS WITHDRAWN 1 $102,000 1 $75,000 0 $0 FILES CLOSED FOR INCOMPLETENESS 0 $0 0 $0 0 $0
Aggregated Statistics For Year 2002(Based on 2 full tracts) A) Conventional B) Refinancings C) Non-occupant Loans on Number Average Value Number Average Value Number Average Value
LOANS ORIGINATED 32 $66,969 13 $75,769 7 $72,714 APPLICATIONS APPROVED, NOT ACCEPTED 4 $72,750 1 $39,000 0 $0 APPLICATIONS DENIED 0 $0 1 $86,000 0 $0 APPLICATIONS WITHDRAWN 0 $0 0 $0 0 $0 FILES CLOSED FOR INCOMPLETENESS 1 $35,000 1 $83,000 0 $0
Aggregated Statistics For Year 2001(Based on 2 full tracts) A) Conventional B) Refinancings C) Non-occupant Loans on Number Average Value Number Average Value Number Average Value
LOANS ORIGINATED 20 $79,750 6 $74,000 4 $83,750 APPLICATIONS APPROVED, NOT ACCEPTED 3 $61,333 2 $64,500 1 $51,000 APPLICATIONS DENIED 0 $0 2 $54,500 0 $0 APPLICATIONS WITHDRAWN 0 $0 1 $62,000 0 $0 FILES CLOSED FOR INCOMPLETENESS 0 $0 0 $0 0 $0
Aggregated Statistics For Year 2000(Based on 2 full tracts) A) Conventional B) Refinancings C) Non-occupant Loans on Number Average Value Number Average Value Number Average Value
LOANS ORIGINATED 22 $69,000 3 $66,333 2 $49,500 APPLICATIONS APPROVED, NOT ACCEPTED 1 $325,000 1 $84,000 0 $0 APPLICATIONS DENIED 1 $61,000 1 $96,000 0 $0 APPLICATIONS WITHDRAWN 0 $0 0 $0 0 $0 FILES CLOSED FOR INCOMPLETENESS 0 $0 0 $0 0 $0
Aggregated Statistics For Year 1999(Based on 2 partial tracts) A) Conventional B) Refinancings C) Non-occupant Loans on Number Average Value Number Average Value Number Average Value
LOANS ORIGINATED 16 $65,891 7 $71,487 1 $65,780 APPLICATIONS APPROVED, NOT ACCEPTED 1 $67,660 1 $78,930 0 $0 APPLICATIONS DENIED 0 $0 0 $0 0 $0 APPLICATIONS WITHDRAWN 0 $0 0 $0 0 $0 FILES CLOSED FOR INCOMPLETENESS 0 $0 0 $0 0 $0
Detailed PMIC statistics for the following Tracts:
0120.00
, 0121.00 East Rochester compared to New York state average:
Median house value significantly below state average. Unemployed percentage significantly below state average. Black race population percentage significantly below state average. Hispanic race population percentage significantly below state average. Foreign-born population percentage significantly below state average. Length of stay since moving in significantly above state average. East Rochester on our top lists :
#16 on the list of "Top 101 cities with the largest percentage of people in homes for the mentally ill (population 1,000+)"
#20 on the list of "Top 101 counties with the highest percentage of residents that visited a dentist within the past year"
#21 on the list of "Top 101 counties with the largest increase in the number of infant deaths per 1000 residents 2000-2006 to 2007-2013 (pop. 50,000+)"
#22 on the list of "Top 101 counties with the lowest percentage of residents relocating from other counties between 2010 and 2011 (pop. 50,000+)"
#33 on the list of "Top 101 counties with the lowest percentage of residents relocating to other counties in 2011"
#35 on the list of "Top 101 counties with the most Catholic congregations (pop. 50,000+)"
Top Patent Applicants
Steven M. Malachowski (11)
Alan T. Coté (7)
Jeremy Griffith (4)
Joel S. Lawther (4)
Mark J. Boch (2)
Jay E. Reeder (2)
Roberto Ramos, Iii (2)
Mark T. Schluentz (2)
Alan Thomas Cote (2)
Robert Case (2)
Total of 56 patent applications in 2008-2024.
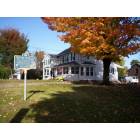
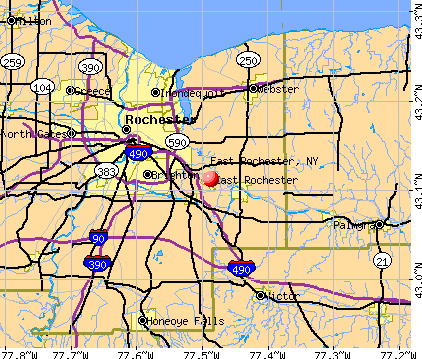


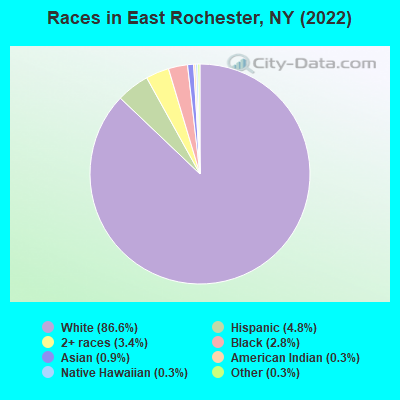
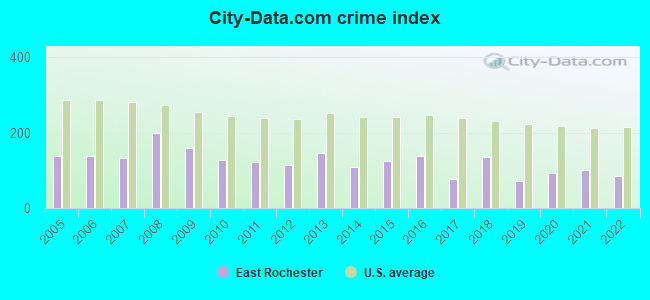
 Recent articles from our blog. Our writers, many of them Ph.D. graduates or candidates, create easy-to-read articles on a wide variety of topics.

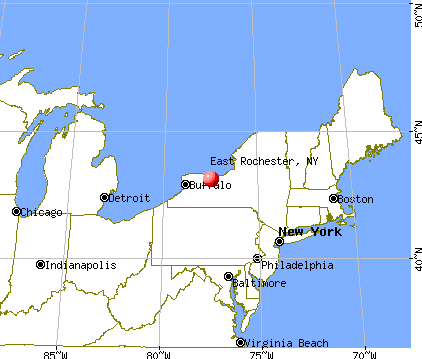
 (7.3 miles
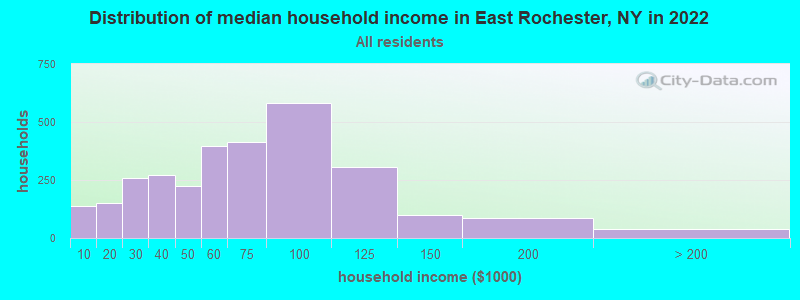
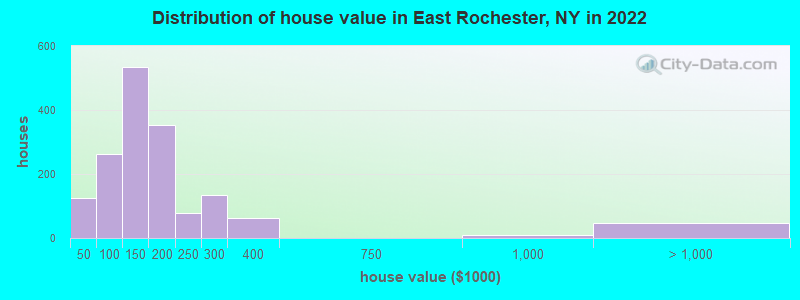

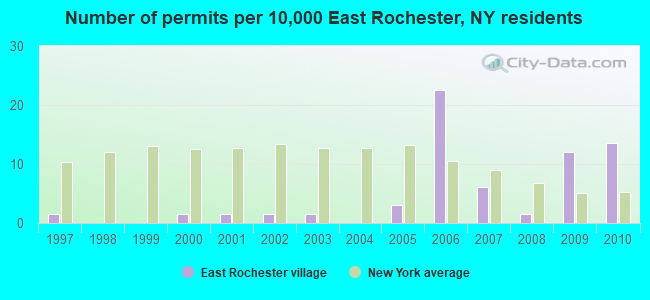
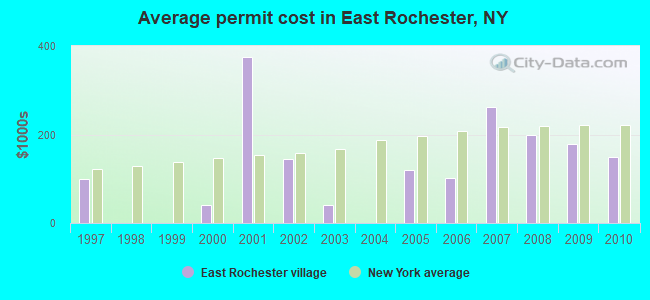
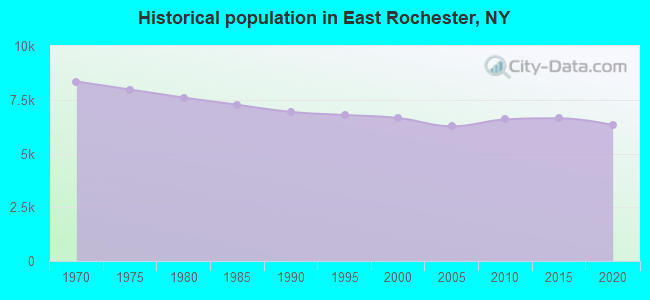
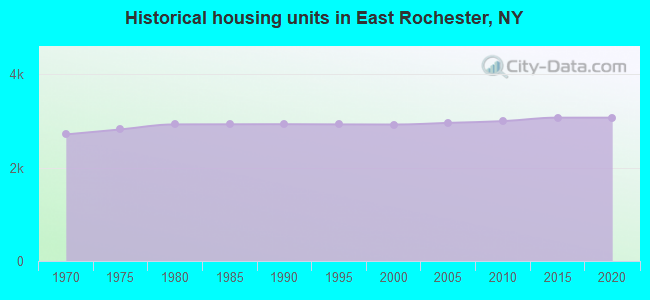
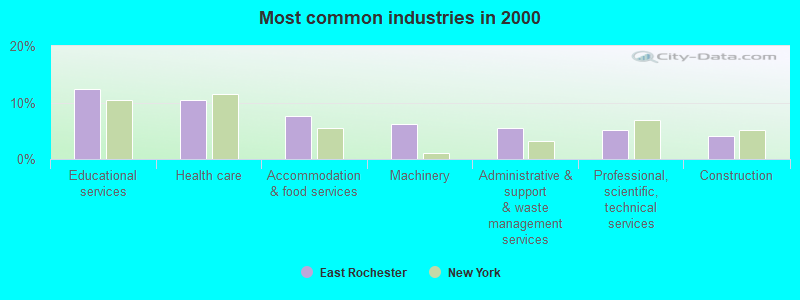
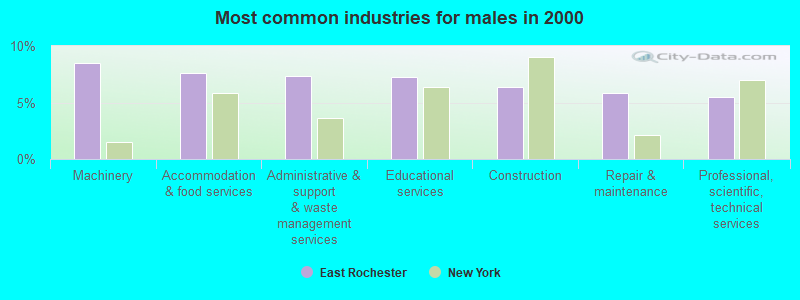
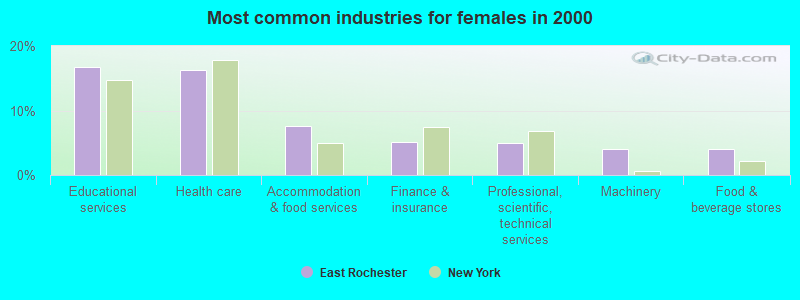
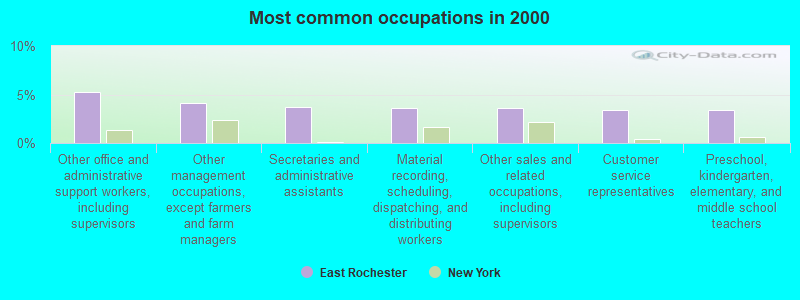
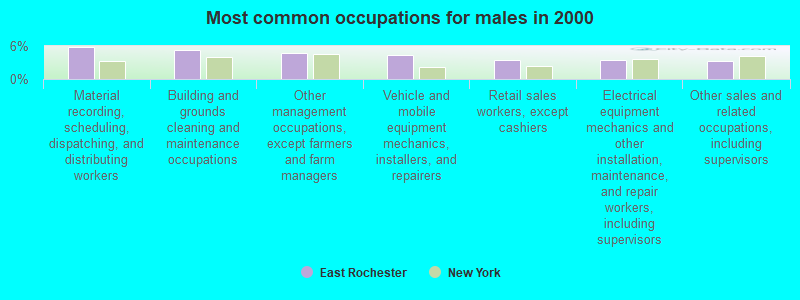
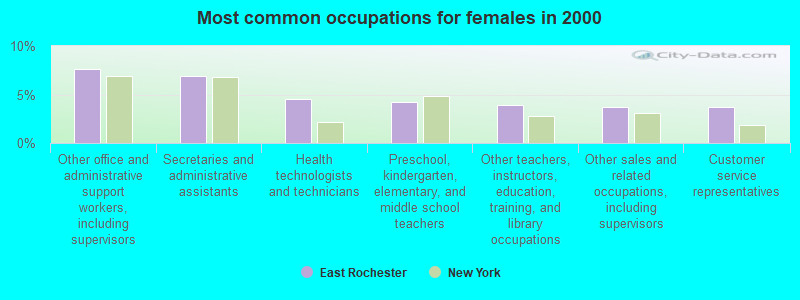


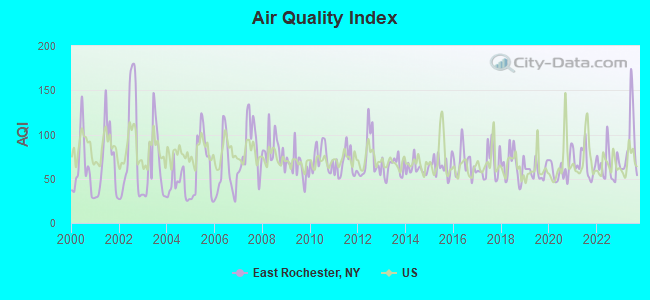
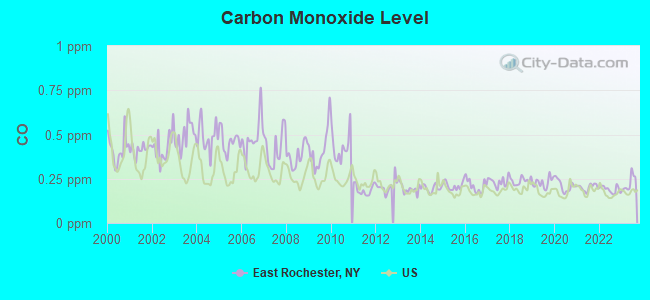
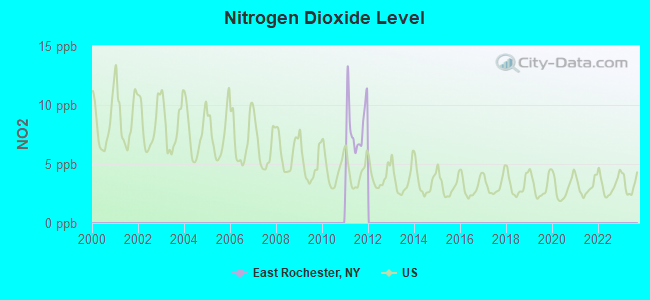
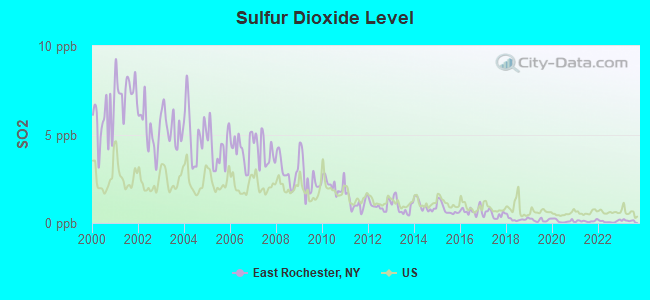
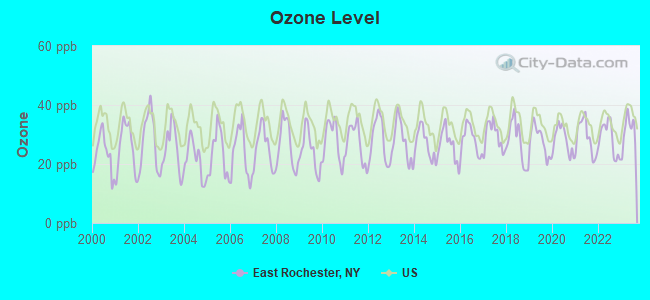
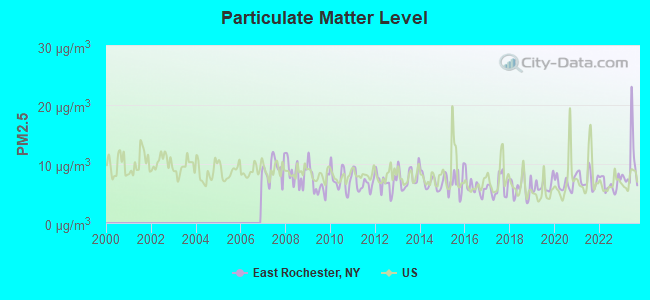
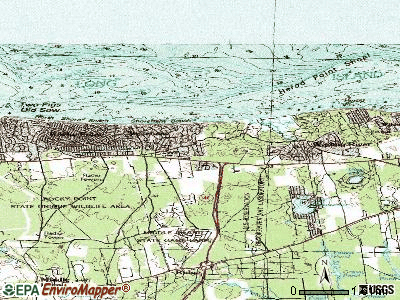
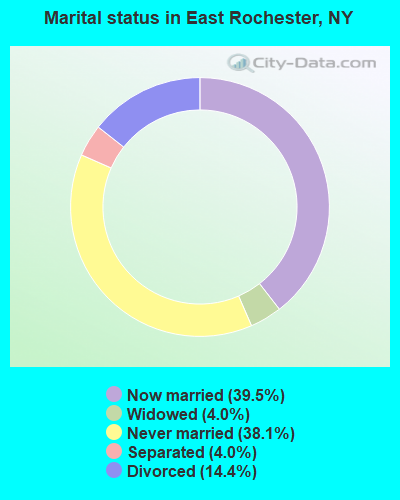
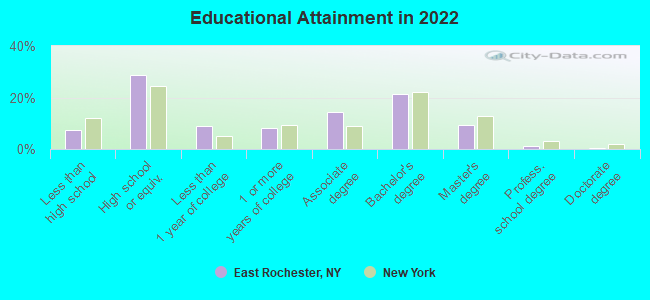
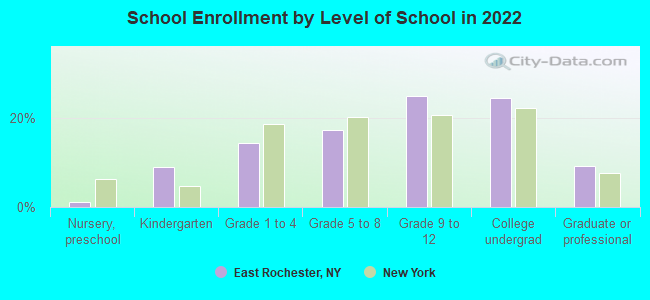
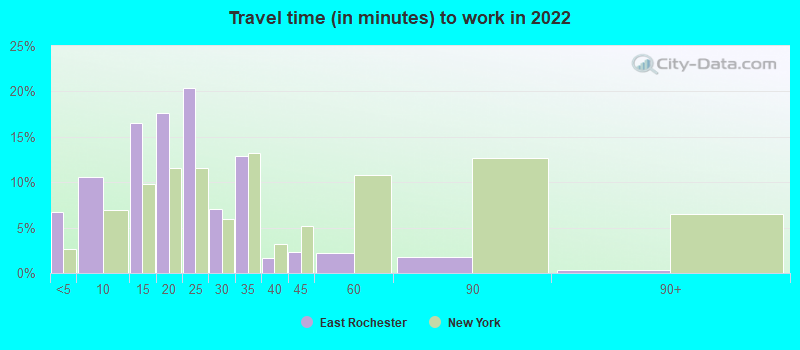
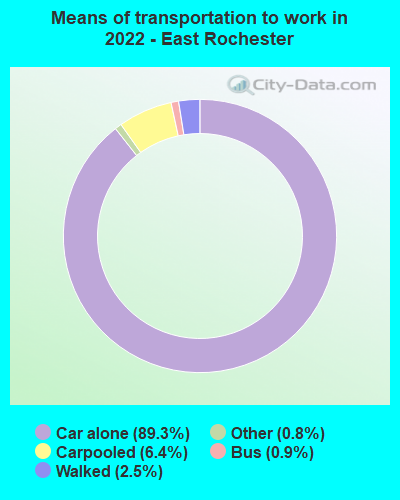
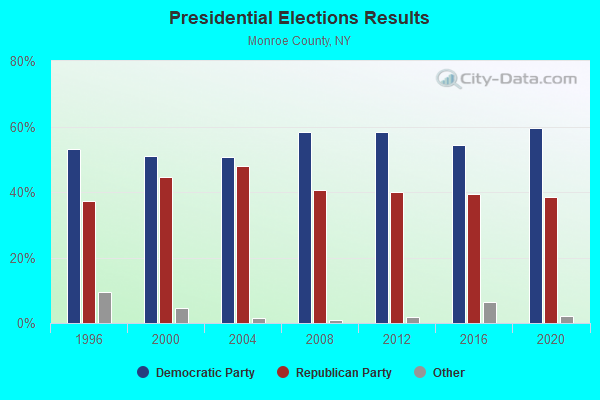
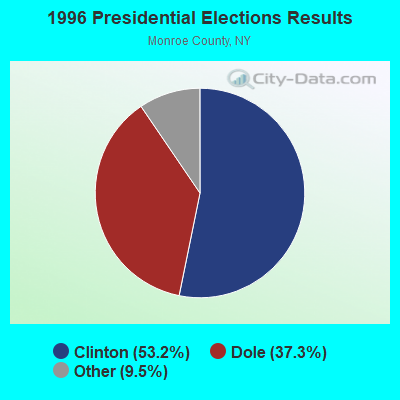
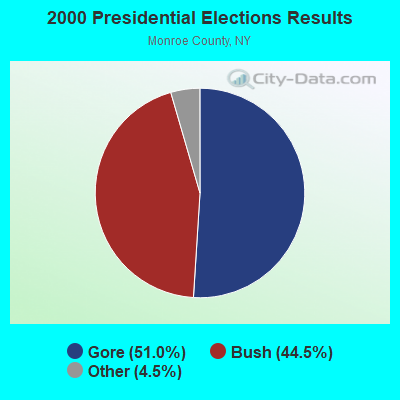
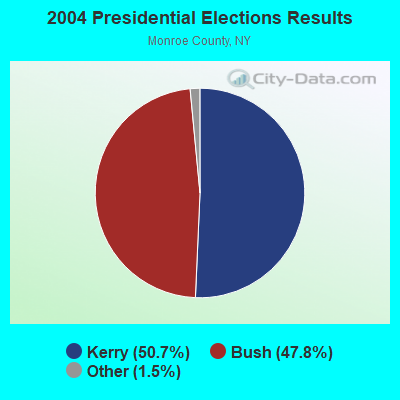
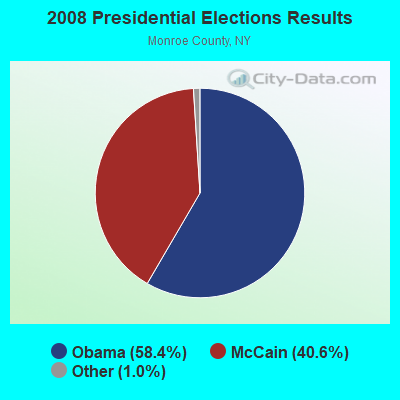
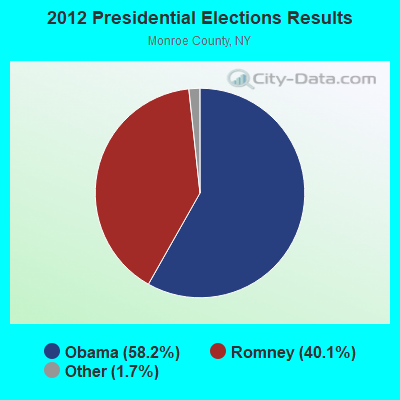
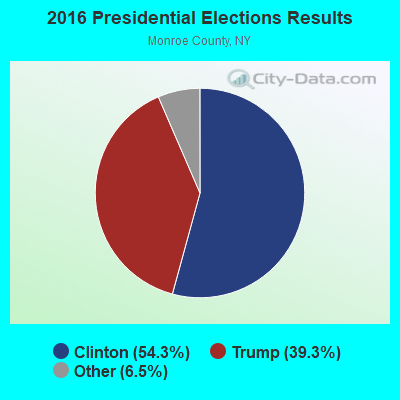
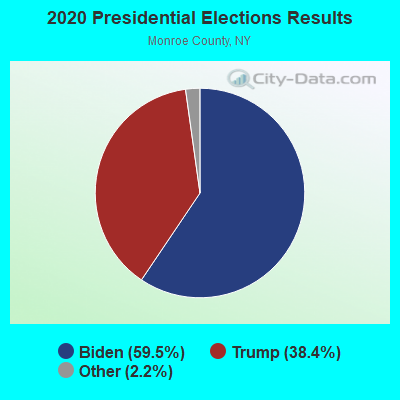
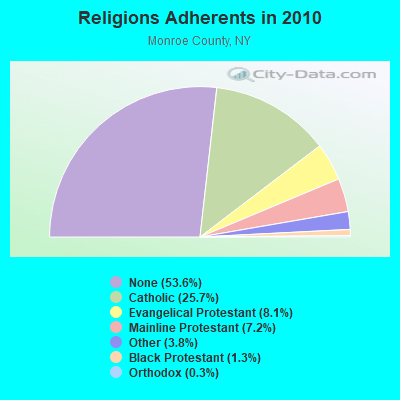
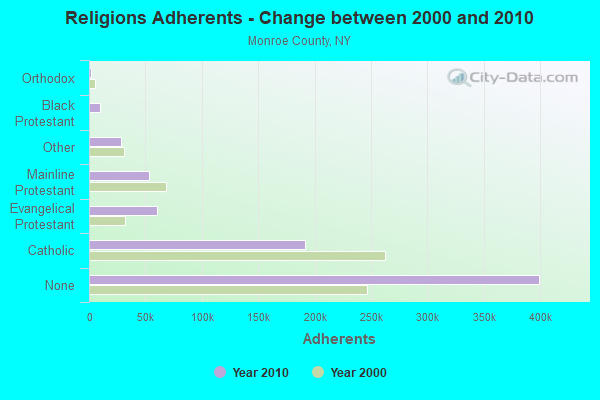
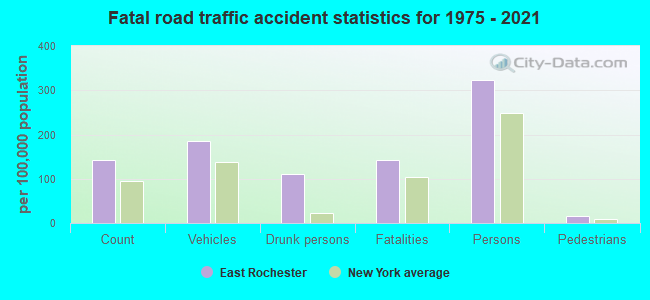
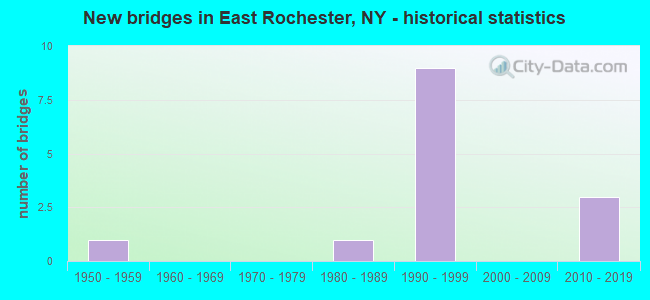
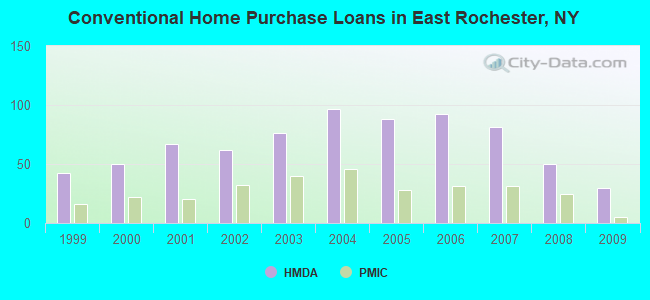
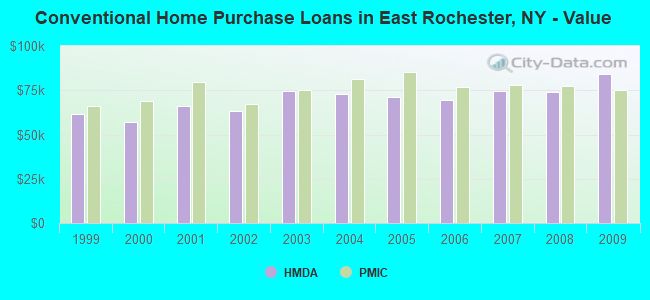
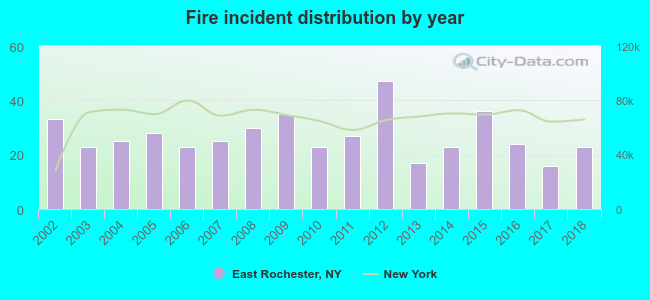 According to the data from the years 2002 - 2018 the average number of fire incidents per year is 27. The highest number of reported fire incidents - 47 took place in 2012, and the least - 16 in 2017. The data has a dropping trend.
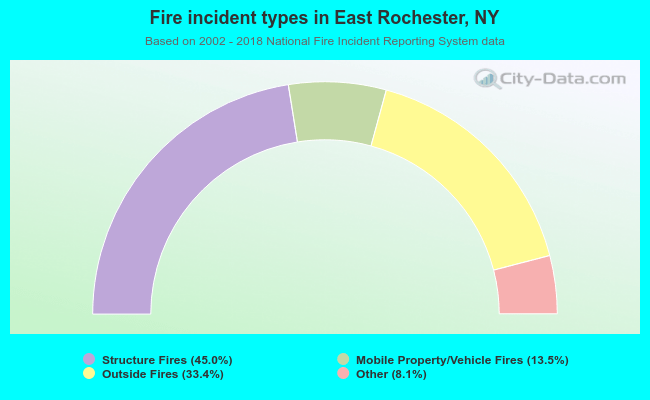 When looking into fire subcategories, the most incidents belonged to: Structure Fires (45.0%), and Outside Fires (33.4%).