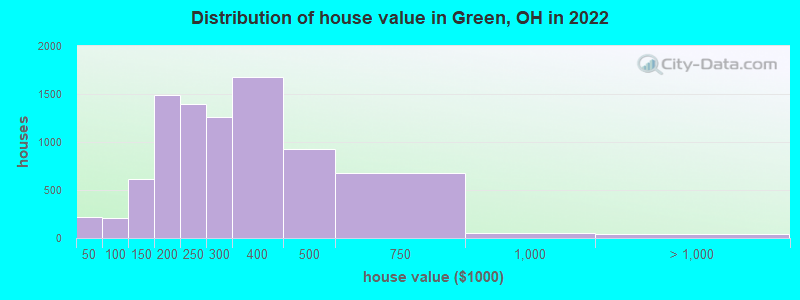
Estimated median house or condo value in 2022: $274,590 (it was $138,700 in 2000)
Green:
$274,590
OH:
$204,100
Mean prices in 2022:all housing units: $296,838; detached houses: $304,551; townhouses or other attached units: $270,628; in 2-unit structures: $213,482; in 3-to-4-unit structures: $136,554; in 5-or-more-unit structures: $209,383; mobile homes: $7,186
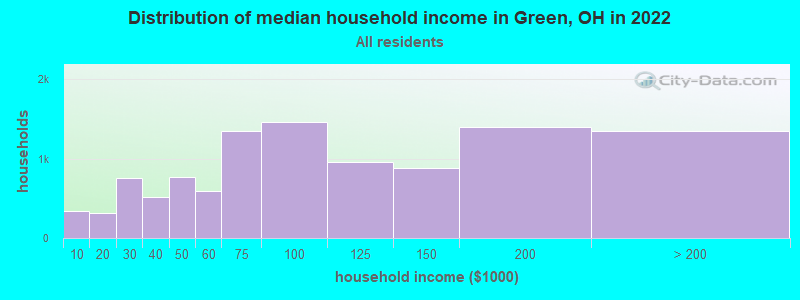
Median gross rent in 2022: $1,074.
March 2022 cost of living index in Green: 96.3 (near average, U.S. average is 100)
Percentage of residents living in poverty in 2022: 6.1%
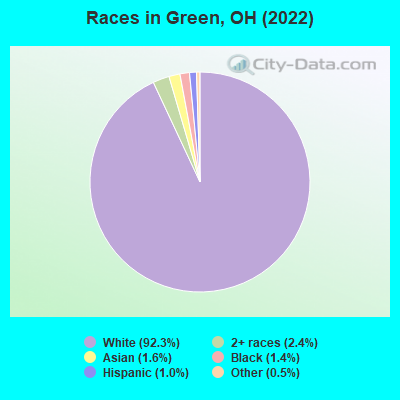
(5.5% for White Non-Hispanic residents, 38.3% for Hispanic or Latino residents, 17.9% for two or more races residents)
Latest news from Green, OH collected exclusively by city-data.com from local newspapers, TV, and radio stations
Ancestries: German (21.9%), English (13.3%), Irish (10.8%), American (10.7%), Italian (7.8%), European (2.7%).
Current Local Time: EST time zone
Incorporated in 1992
Elevation: 1150 feet
Land area: 32.1 square miles.
Population density: 851 people per square mile (low).
632 residents are foreign born (1.1% Europe, 0.8% Asia).
This city:
2.3%
Ohio:
4.9%
Median real estate property taxes paid for housing units with mortgages in 2022: $3,878 (1.3%) Median real estate property taxes paid for housing units with no mortgage in 2022: $3,070 (1.3%)
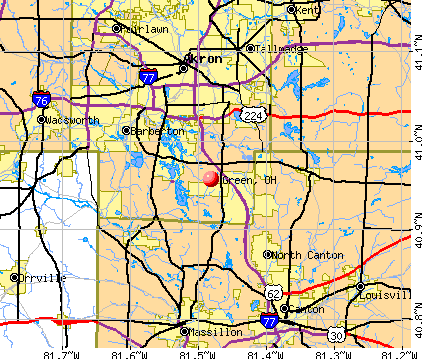
Nearest city with pop. 50,000+: Akron, OH (8.3 miles , pop. 217,074).
Nearest city with pop. 1,000,000+: Chicago, IL (327.3 miles , pop. 2,896,016).
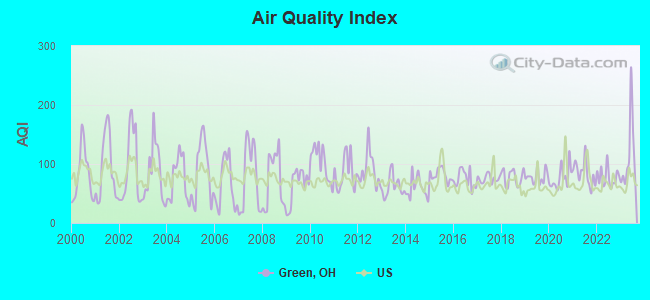
Air Quality Index (AQI) level in 2023 was 114. This is significantly worse than average.
City:
114
U.S.:
73
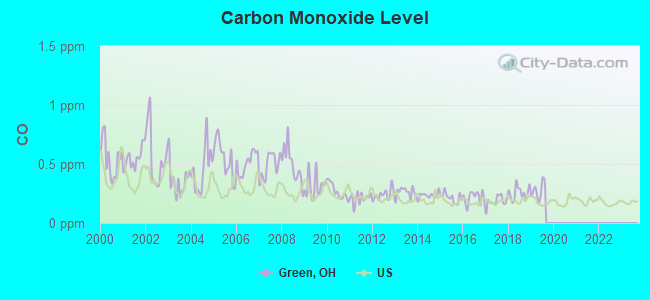
Carbon Monoxide (CO) [ppm] level in 2019 was 0.276. This is about average.Closest monitor was 7.5 miles away from the city center.
City:
0.276
U.S.:
0.251
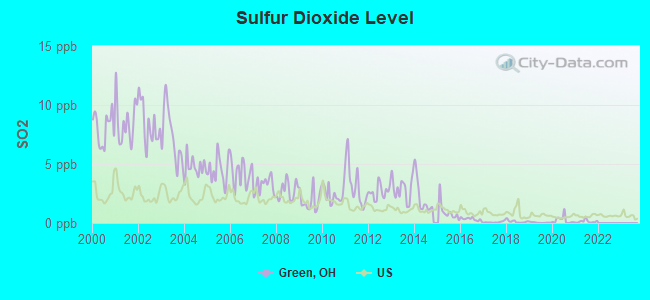
Sulfur Dioxide (SO2) [ppb] level in 2021 was 0.136. This is significantly better than average.Closest monitor was 0.7 miles away from the city center.
City:
0.136
U.S.:
1.515
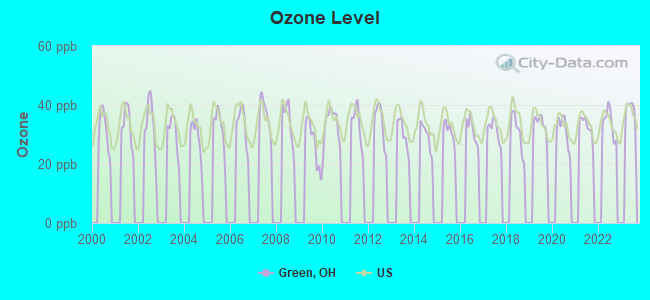
Ozone [ppb] level in 2022 was 33.9. This is about average.Closest monitor was 7.4 miles away from the city center.
City:
33.9
U.S.:
33.3
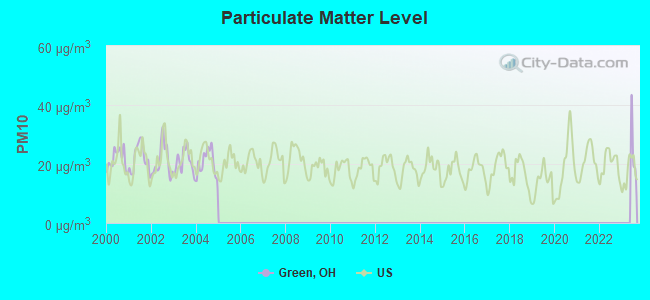
Particulate Matter (PM10) [µg/m3] level in 2004 was 20.5. This is about average.Closest monitor was 7.4 miles away from the city center.
City:
20.5
U.S.:
19.2
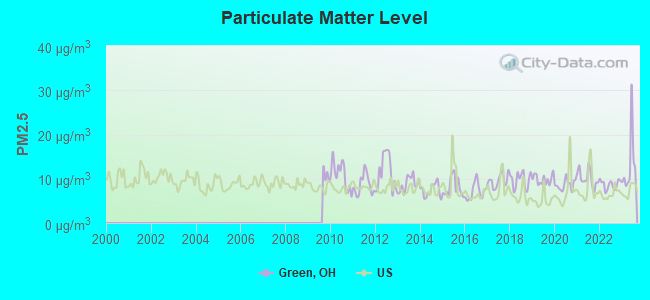
Particulate Matter (PM2.5) [µg/m3] level in 2023 was 13.1. This is significantly worse than average.Closest monitor was 7.4 miles away from the city center.
City:
13.1
U.S.:
8.1
Tornado activity:
Green-area historical tornado activity is near Ohio state average. It is 12% greater than the overall U.S. average.
On 5/31/1985, a category F5 (max. wind speeds 261-318 mph) tornado 24.1 miles away from the Green city center killed 18 peopleand injured 310 peopleand causedbetween $50,000,000 and $500,000,000 in damages.
On 4/11/1965, a category F4 (max. wind speeds 207-260 mph) tornado 31.6 miles away from the city center killed 18 peopleand injured 200 peopleand causedbetween $5,000,000 and $50,000,000 in damages.
Earthquake activity:
Green-area historical earthquake activity is significantly above Ohio state average. It is 47% smaller than the overall U.S. average.
On 9/25/1998 at 19:52:52, a magnitude 5.2 (4.8 MB, 4.3 MS, 5.2 LG, 4.5 MW, Depth: 3.1 mi, Class: Moderate, Intensity: VI - VII) earthquake occurred 67.5 miles away from Green center On 1/31/1986 at 16:46:43, a magnitude 5.0 (5.0 MB) earthquake occurred 47.7 miles away from Green center On 8/23/2011 at 17:51:04, a magnitude 5.8 (5.8 MW, Depth: 3.7 mi) earthquake occurred 283.3 miles away from Green center On 7/27/1980 at 18:52:21, a magnitude 5.2 (5.1 MB, 4.7 MS, 5.0 UK, 5.2 UK) earthquake occurred 231.2 miles away from the city center On 12/31/2011 at 20:05:01, a magnitude 4.0 (4.0 ML, Depth: 3.1 mi, Class: Light, Intensity: IV - V) earthquake occurred 43.1 miles away from Green center On 6/10/2019 at 14:50:45, a magnitude 4.0 (4.0 MB, Depth: 1.2 mi) earthquake occurred 50.0 miles away from the city center Magnitude types: regional Lg-wave magnitude (LG), body-wave magnitude (MB), local magnitude (ML), surface-wave magnitude (MS), moment magnitude (MW)
Natural disasters:
The number of natural disasters in Summit County (11) is smaller than the US average (15). Major Disasters (Presidential) Declared: 7 Emergencies Declared: 3
Causes of natural disasters: Storms: 6, Tornadoes: 5, Floods: 4, Winds: 2, Blizzard: 1, Hurricane: 1, Power Outage: 1, Snowstorm: 1, Tropical Depression: 1, Other: 1 (Note: some incidents may be assigned to more than one category).
Hospitals and medical centers near Green:
FMC - AKRON CANTON KIDNEY CENTER (Dialysis Facility, about 1 miles away; UNIONTOWN, OH)
PEBBLE CREEK (Nursing Home, about 3 miles away; AKRON, OH)
PEBBLE CREEK SENIOR CARE RESIDENCE (Nursing Home, about 3 miles away; AKRON, OH)
HOME IV TEAM INC (Home Health Center, about 3 miles away; AKRON, OH)
GUARDIAN ANGEL HOME CARE, INC (Home Health Center, about 3 miles away; AKRON, OH)
ST LUKE LUTHERAN COMMUNITY-PORTAGE LAKES (Nursing Home, about 4 miles away; AKRON, OH)
GENTIVA HEALTH SERVICES (Home Health Center, about 4 miles away; AKRON, OH)
Amtrak station near Green:
9 miles: AKRON (906 E. BOWERY ST.) . Services: enclosed waiting area, public restrooms, public payphones, free short-term parking, free long-term parking, taxi stand.
Notable locations in Green: Langmoor Golf Course (A), Turkeyfoot Golf Course (B), Mayfair Country Club (C), Camp Y Noah (D), K and S Greenhouse and Plant Farm (E), Interstate Business Park (F), Miller Industrial Park (G), Akron - Canton Corporate Park (H), Boettler Business Park (I), Airport 77 Industrial Center (J), Green Fire Department Station 1 (K), Green Fire Department Station 2 (L). Display/hide their locations on the map
Churches in Green include: Green Baptist Church (A), Greensburg United Methodist Church (B), Kingdom Hall Church (C), Queen of Heaven Church (D). Display/hide their locations on the map
Lakes and reservoirs: Singer Lake (A), Wonder Lake (B), Miller Lake (C), Mud Lake (D), Lake Noah (E), Cottage Grove Lake (F), Comet Lake (G), Nimisila Reservoir (H). Display/hide their locations on the map
Birthplace of: Mary Taylor (politician) - Politician.
Summit County has a predicted average indoor radon screening level greater than 4 pCi/L (pico curies per liter) - Highest Potential
Drinking water stations with addresses in Green and their reported violations in the past:
SANDBAR (Population served: 80, Groundwater):
Past health violations:
MCL, Monthly (TCR) - Between OCT-2010 and DEC-2010, Contaminant: Coliform. Follow-up actions: St Public Notif requested (JAN-20-2011), St Violation/Reminder Notice (JAN-20-2011), St Compliance achieved (2 times from AUG-16-2011 to AUG-16-2011)
Past monitoring violations:
Monitoring, Source Water (GWR) - In DEC-01-2010, Contaminant: E. COLI. Follow-up actions: St Public Notif requested (JAN-13-2011), St Violation/Reminder Notice (JAN-13-2011), St Compliance achieved (JAN-20-2011)
Monitoring, Repeat Major (TCR) - Between OCT-2010 and DEC-2010, Contaminant: Coliform (TCR). Follow-up actions: St Public Notif requested (JAN-13-2011), St Violation/Reminder Notice (JAN-13-2011), St Compliance achieved (2 times from AUG-16-2011 to AUG-16-2011)
4 routine major monitoring violations
3 regular monitoring violations
Average household size:
This city:
2.5 people
Ohio:
2.4 people
Percentage of family households:
This city:
71.7%
Whole state:
65.0%
Percentage of households with unmarried partners:
This city:
5.2%
Whole state:
6.8%
Likely homosexual households (counted as self-reported same-sex unmarried-partner households)
Lesbian couples: 0.3% of all households
Gay men: 0.3% of all households
People in group quarters in Green in 2010:
130 people in nursing facilities/skilled-nursing facilities
6 people in group homes intended for adults
3 people in group homes for juveniles (non-correctional)
2 people in workers' group living quarters and job corps centers
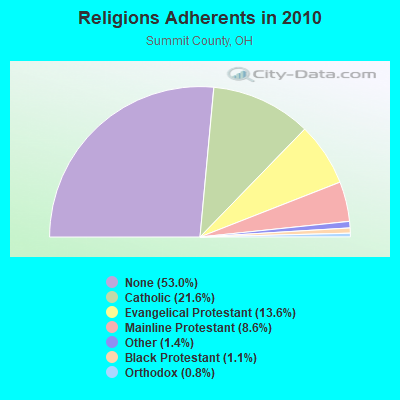
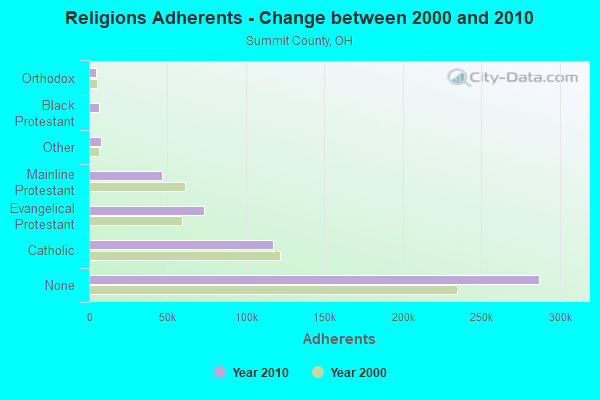
Religion statistics for Green, OH (based on Summit County data)
Religion
Adherents
Congregations
Catholic
116,941
33
Evangelical Protestant
73,586
254
Mainline Protestant
46,521
127
Other
7,347
34
Black Protestant
6,129
26
Orthodox
4,230
12
None
287,027
-
Source: Clifford Grammich, Kirk Hadaway, Richard Houseal, Dale E.Jones, Alexei Krindatch, Richie Stanley and Richard H.Taylor. 2012. 2010 U.S.Religion Census: Religious Congregations & Membership Study. Association of Statisticians of American Religious Bodies. Jones, Dale E., et al. 2002. Congregations and Membership in the United States 2000. Nashville, TN: Glenmary Research Center. Graphs represent county-level data
Green, 3670 Tabs Drive (Lat: 40.963417 Lon: -81.478278), Type: Ltower, Structure height: 54.9 m, Overall height: 60 m, Call Sign: WPWS532, Assigned Frequencies: 6605.00 MHz, 6226.89 MHz, 6226.89 MHz, 6226.89 MHz, 6226.89 MHz, 6345.49 MHz, 6256.54 MHz, 6345.49 MHz, 6256.54 MHz, 6345.49 MHz... (+3 more), Grant Date: 10/25/2022, Expiration Date: 01/14/2033, Certifier: Robert J Scarlatelli, Registrant: County Of Summit, Ohio, 175 S. Main St Suite 103, Akron, OH 44308, Phone: (330) 643-8008, Email:
GALLIPOLIS II, 114 West Drive (Lat: 38.804222 Lon: -82.232194), Type: Mast, Structure height: 73.1 m, Overall height: 77.7 m, Call Sign: WQCI672, Assigned Frequencies: 6315.84 MHz, Grant Date: 03/14/2005, Expiration Date: 02/01/2015, Cancellation Date: 11/25/2014, Certifier: Glenn S Rabin, Registrant: Verizon Wireless, 1120 Sanctuary Pkwy #150 Gasa5reg, Alpharetta, GA 30009-7630, Phone: (770) 797-1070, Fax: (770) 797-1036, Email:
CLE0228, 280 S-Sw Of W End Of Tamy Dr (Lat: 40.963611 Lon: -81.478889), Type: Tower, Structure height: 60.7 m, Call Sign: WQCP850, Licensee ID: L01728370, Assigned Frequencies: 19560.0 MHz, Grant Date: 04/26/2005, Expiration Date: 04/26/2015, Cancellation Date: 09/11/2013, Certifier: Joseph M Sandri Jr., Registrant: Fibertower Network Services, Corp., Debtor-In-Possession, 1875 Eye Street, Nw, 5th Floor, Room 505, Washington, DC 20006, Phone: (202) 223-1028, Email:
STATION, S Main And Caston Rd County Hwy 22 (Lat: 40.955056 Lon: -81.529556), Overall height: 125.6 m, Call Sign: KSU37, Assigned Frequencies: 12490.0 MHz, 12470.0 MHz, 12550.0 MHz, 12530.0 MHz, 17810.0 MHz, 17890.0 MHz, 12570.0 MHz, 12610.0 MHz, Grant Date: 12/17/1991, Expiration Date: 12/17/1996, Cancellation Date: 12/11/1996, Phone: (313) 642-6226
FCC Registered Paging Towers:
1
4.5 Mi E Of N Bloomfield On Sr 87 (Lat: 41.462833 Lon: -80.779528), Call Sign: KNKO716, Assigned Frequencies: 931.337 MHz, Grant Date: 12/27/2019, Expiration Date: 11/08/2029, Certifier: J. Roy Pottle, Registrant: Wilkinson Barker Knauer, LLP, 1800 M Street, N.W., Suite 800n, Washington, DC 20036, Phone: (202) 783-4141, Fax: (202) 783-5851, Email:
Home Mortgage Disclosure Act Aggregated Statistics For Year 2009 (Based on 3 full tracts)
A) FHA, FSA/RHS & VA Home Purchase Loans
B) Conventional Home Purchase Loans
C) Refinancings
D) Home Improvement Loans
E) Loans on Dwellings For 5+ Families
F) Non-occupant Loans on < 5 Family Dwellings (A B C & D)
G) Loans On Manufactured Home Dwelling (A B C & D)
Number
Average Value
Number
Average Value
Number
Average Value
Number
Average Value
Number
Average Value
Number
Average Value
Number
Average Value
LOANS ORIGINATED
103
$153,126
147
$159,129
574
$166,122
14
$68,857
2
$2,046,500
12
$146,333
2
$6,500
APPLICATIONS APPROVED, NOT ACCEPTED
5
$96,000
9
$114,556
52
$153,173
3
$14,000
0
$0
1
$96,000
0
$0
APPLICATIONS DENIED
9
$180,667
24
$106,583
209
$168,478
16
$20,312
0
$0
9
$67,667
5
$10,600
APPLICATIONS WITHDRAWN
10
$114,900
13
$159,000
90
$164,011
2
$74,500
1
$3,513,000
5
$120,600
0
$0
FILES CLOSED FOR INCOMPLETENESS
2
$101,500
0
$0
32
$156,906
1
$212,000
0
$0
0
$0
0
$0
Aggregated Statistics For Year 2008 (Based on 3 full tracts)
A) FHA, FSA/RHS & VA Home Purchase Loans
B) Conventional Home Purchase Loans
C) Refinancings
D) Home Improvement Loans
E) Loans on Dwellings For 5+ Families
F) Non-occupant Loans on < 5 Family Dwellings (A B C & D)
G) Loans On Manufactured Home Dwelling (A B C & D)
Number
Average Value
Number
Average Value
Number
Average Value
Number
Average Value
Number
Average Value
Number
Average Value
Number
Average Value
LOANS ORIGINATED
83
$154,422
240
$178,212
256
$162,277
38
$33,947
1
$750,000
28
$140,250
1
$4,000
APPLICATIONS APPROVED, NOT ACCEPTED
5
$116,800
18
$161,833
41
$144,439
7
$65,429
0
$0
4
$138,500
1
$31,000
APPLICATIONS DENIED
17
$144,706
33
$125,424
180
$156,500
35
$40,914
0
$0
18
$84,333
3
$4,667
APPLICATIONS WITHDRAWN
7
$154,857
19
$162,474
62
$176,274
4
$39,500
1
$5,400,000
4
$71,000
1
$33,000
FILES CLOSED FOR INCOMPLETENESS
1
$285,000
2
$199,500
19
$176,421
1
$200,000
0
$0
0
$0
0
$0
Aggregated Statistics For Year 2007 (Based on 3 full tracts)
A) FHA, FSA/RHS & VA Home Purchase Loans
B) Conventional Home Purchase Loans
C) Refinancings
D) Home Improvement Loans
E) Loans on Dwellings For 5+ Families
F) Non-occupant Loans on < 5 Family Dwellings (A B C & D)
G) Loans On Manufactured Home Dwelling (A B C & D)
Number
Average Value
Number
Average Value
Number
Average Value
Number
Average Value
Number
Average Value
Number
Average Value
Number
Average Value
LOANS ORIGINATED
33
$168,030
327
$154,985
317
$132,763
66
$41,091
1
$310,000
38
$130,947
1
$10,000
APPLICATIONS APPROVED, NOT ACCEPTED
0
$0
34
$142,912
80
$144,250
10
$43,100
0
$0
4
$127,000
0
$0
APPLICATIONS DENIED
3
$210,333
56
$149,554
282
$153,245
49
$59,653
0
$0
17
$122,235
1
$17,000
APPLICATIONS WITHDRAWN
7
$157,429
24
$166,500
98
$137,143
14
$67,071
0
$0
7
$109,143
0
$0
FILES CLOSED FOR INCOMPLETENESS
2
$154,500
5
$178,000
32
$146,906
1
$107,000
0
$0
1
$80,000
0
$0
Aggregated Statistics For Year 2006 (Based on 3 full tracts)
A) FHA, FSA/RHS & VA Home Purchase Loans
B) Conventional Home Purchase Loans
C) Refinancings
D) Home Improvement Loans
E) Loans on Dwellings For 5+ Families
F) Non-occupant Loans on < 5 Family Dwellings (A B C & D)
G) Loans On Manufactured Home Dwelling (A B C & D)
Number
Average Value
Number
Average Value
Number
Average Value
Number
Average Value
Number
Average Value
Number
Average Value
Number
Average Value
LOANS ORIGINATED
21
$154,762
496
$148,466
436
$121,901
51
$52,627
3
$1,868,333
57
$105,298
3
$8,000
APPLICATIONS APPROVED, NOT ACCEPTED
1
$215,000
31
$127,129
106
$116,462
11
$47,818
0
$0
8
$83,000
1
$10,000
APPLICATIONS DENIED
2
$163,000
82
$173,524
321
$152,386
65
$63,215
1
$154,000
22
$144,818
3
$26,667
APPLICATIONS WITHDRAWN
4
$163,500
47
$157,681
174
$140,736
19
$117,000
1
$40,000
13
$86,308
0
$0
FILES CLOSED FOR INCOMPLETENESS
1
$85,000
10
$128,400
73
$178,685
2
$39,500
0
$0
1
$85,000
0
$0
Aggregated Statistics For Year 2005 (Based on 3 full tracts)
A) FHA, FSA/RHS & VA Home Purchase Loans
B) Conventional Home Purchase Loans
C) Refinancings
D) Home Improvement Loans
E) Loans on Dwellings For 5+ Families
F) Non-occupant Loans on < 5 Family Dwellings (A B C & D)
G) Loans On Manufactured Home Dwelling (A B C & D)
Number
Average Value
Number
Average Value
Number
Average Value
Number
Average Value
Number
Average Value
Number
Average Value
Number
Average Value
LOANS ORIGINATED
24
$154,458
549
$149,455
523
$139,403
55
$50,364
0
$0
59
$126,424
2
$42,000
APPLICATIONS APPROVED, NOT ACCEPTED
1
$96,000
46
$122,848
108
$137,722
17
$58,176
0
$0
10
$98,700
1
$55,000
APPLICATIONS DENIED
6
$116,833
79
$130,190
352
$152,665
74
$53,378
1
$160,000
22
$87,636
10
$41,500
APPLICATIONS WITHDRAWN
1
$175,000
39
$187,154
266
$153,350
34
$166,735
0
$0
10
$126,100
1
$45,000
FILES CLOSED FOR INCOMPLETENESS
0
$0
13
$106,538
49
$163,102
2
$67,000
0
$0
0
$0
0
$0
Aggregated Statistics For Year 2004 (Based on 3 full tracts)
A) FHA, FSA/RHS & VA Home Purchase Loans
B) Conventional Home Purchase Loans
C) Refinancings
D) Home Improvement Loans
E) Loans on Dwellings For 5+ Families
F) Non-occupant Loans on < 5 Family Dwellings (A B C & D)
G) Loans On Manufactured Home Dwelling (A B C & D)
Number
Average Value
Number
Average Value
Number
Average Value
Number
Average Value
Number
Average Value
Number
Average Value
Number
Average Value
LOANS ORIGINATED
25
$131,960
496
$154,806
620
$123,935
54
$63,463
0
$0
59
$100,424
1
$8,000
APPLICATIONS APPROVED, NOT ACCEPTED
1
$117,000
61
$119,508
110
$124,264
8
$47,750
0
$0
12
$106,500
3
$13,667
APPLICATIONS DENIED
5
$126,000
64
$131,438
283
$144,714
56
$54,196
1
$187,000
34
$112,500
6
$31,667
APPLICATIONS WITHDRAWN
4
$123,500
51
$168,843
244
$143,873
19
$88,000
0
$0
7
$136,286
0
$0
FILES CLOSED FOR INCOMPLETENESS
1
$138,000
20
$179,600
49
$151,082
4
$76,250
0
$0
3
$87,333
0
$0
Aggregated Statistics For Year 2003 (Based on 3 full tracts)
A) FHA, FSA/RHS & VA Home Purchase Loans
B) Conventional Home Purchase Loans
C) Refinancings
D) Home Improvement Loans
E) Loans on Dwellings For 5+ Families
F) Non-occupant Loans on < 5 Family Dwellings (A B C & D)
Number
Average Value
Number
Average Value
Number
Average Value
Number
Average Value
Number
Average Value
Number
Average Value
LOANS ORIGINATED
27
$132,222
403
$148,007
1,409
$129,211
39
$45,179
2
$750,500
55
$109,327
APPLICATIONS APPROVED, NOT ACCEPTED
1
$117,000
34
$125,588
206
$116,684
8
$36,125
0
$0
11
$92,727
APPLICATIONS DENIED
2
$106,000
40
$114,075
299
$134,518
27
$26,000
0
$0
19
$104,000
APPLICATIONS WITHDRAWN
2
$98,000
42
$135,905
231
$137,420
7
$55,571
0
$0
19
$126,316
FILES CLOSED FOR INCOMPLETENESS
1
$113,000
9
$134,111
68
$130,221
3
$80,000
0
$0
3
$90,333
Aggregated Statistics For Year 2002 (Based on 3 full tracts)
A) FHA, FSA/RHS & VA Home Purchase Loans
B) Conventional Home Purchase Loans
C) Refinancings
D) Home Improvement Loans
F) Non-occupant Loans on < 5 Family Dwellings (A B C & D)
Number
Average Value
Number
Average Value
Number
Average Value
Number
Average Value
Number
Average Value
LOANS ORIGINATED
35
$119,629
408
$139,017
1,035
$126,523
31
$16,548
58
$88,103
APPLICATIONS APPROVED, NOT ACCEPTED
2
$130,000
20
$139,350
135
$136,067
18
$15,333
6
$117,167
APPLICATIONS DENIED
5
$113,600
40
$127,025
225
$118,267
38
$18,105
10
$98,800
APPLICATIONS WITHDRAWN
1
$144,000
22
$176,773
161
$121,764
5
$48,600
4
$97,000
FILES CLOSED FOR INCOMPLETENESS
0
$0
6
$74,000
50
$132,220
0
$0
4
$152,750
Aggregated Statistics For Year 2001 (Based on 3 full tracts)
A) FHA, FSA/RHS & VA Home Purchase Loans
B) Conventional Home Purchase Loans
C) Refinancings
D) Home Improvement Loans
E) Loans on Dwellings For 5+ Families
F) Non-occupant Loans on < 5 Family Dwellings (A B C & D)
Number
Average Value
Number
Average Value
Number
Average Value
Number
Average Value
Number
Average Value
Number
Average Value
LOANS ORIGINATED
34
$127,529
409
$131,861
890
$118,633
52
$19,923
1
$6,000,000
38
$87,605
APPLICATIONS APPROVED, NOT ACCEPTED
2
$127,500
33
$117,364
141
$110,695
30
$32,733
0
$0
8
$75,750
APPLICATIONS DENIED
3
$99,667
26
$105,000
294
$111,327
36
$23,972
0
$0
15
$78,867
APPLICATIONS WITHDRAWN
2
$150,000
21
$139,952
140
$115,307
8
$16,250
0
$0
4
$122,750
FILES CLOSED FOR INCOMPLETENESS
0
$0
10
$132,200
47
$108,532
2
$18,000
0
$0
5
$103,200
Aggregated Statistics For Year 2000 (Based on 3 full tracts)
A) FHA, FSA/RHS & VA Home Purchase Loans
B) Conventional Home Purchase Loans
C) Refinancings
D) Home Improvement Loans
F) Non-occupant Loans on < 5 Family Dwellings (A B C & D)
Number
Average Value
Number
Average Value
Number
Average Value
Number
Average Value
Number
Average Value
LOANS ORIGINATED
41
$111,439
317
$131,801
258
$102,686
59
$18,610
24
$86,583
APPLICATIONS APPROVED, NOT ACCEPTED
3
$161,333
33
$104,970
88
$90,375
20
$16,250
4
$77,500
APPLICATIONS DENIED
2
$94,000
44
$58,386
154
$102,552
52
$16,731
11
$54,273
APPLICATIONS WITHDRAWN
4
$85,250
18
$117,889
81
$100,309
12
$16,667
3
$104,667
FILES CLOSED FOR INCOMPLETENESS
2
$143,500
8
$107,250
26
$110,462
0
$0
0
$0
Aggregated Statistics For Year 1999 (Based on 3 full tracts)
A) FHA, FSA/RHS & VA Home Purchase Loans
B) Conventional Home Purchase Loans
C) Refinancings
D) Home Improvement Loans
F) Non-occupant Loans on < 5 Family Dwellings (A B C & D)


 Recent articles from our blog. Our writers, many of them Ph.D. graduates or candidates, create easy-to-read articles on a wide variety of topics.

 (8.3 miles